File list
Jump to navigation
Jump to search
This special page shows all uploaded files.
| Date | Name | Thumbnail | Size | User | Description | Versions |
|---|---|---|---|---|---|---|
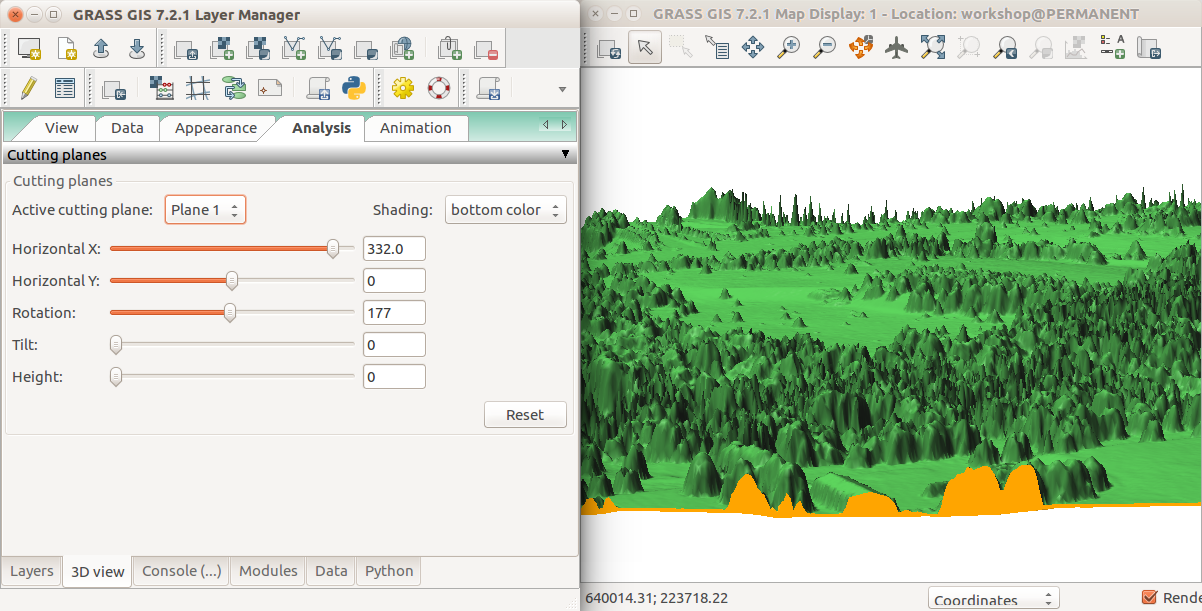
| 02:47, 6 August 2017 | Nviz cutting plane analysis tab.png (file) |  |
361 KB | ⚠️Wenzeslaus | GRASS GIS 7.2 3D view in wxGUI, 3D view tab, Analysis tab, Controlling cutting plane | 1 |
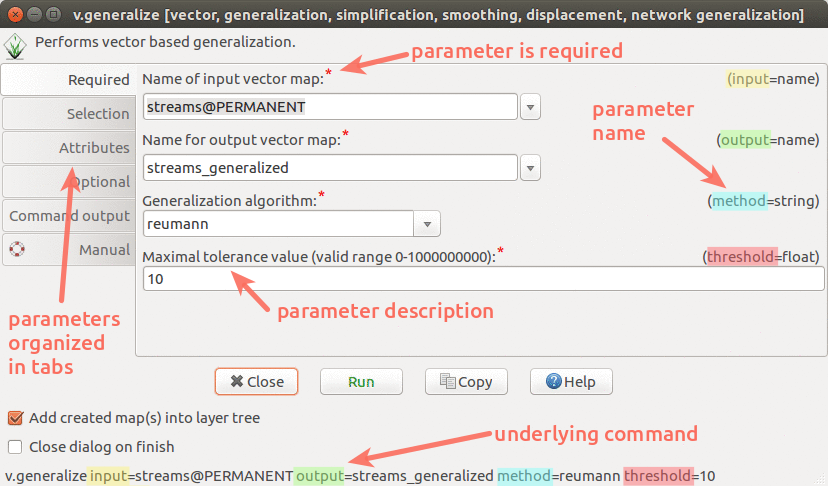
| 22:48, 1 August 2017 | Wxgui module parameters v generalize.png (file) |  |
171 KB | Annakrat | wxGUI dialog/form for v.generalize with descriptions and highlights | 1 |
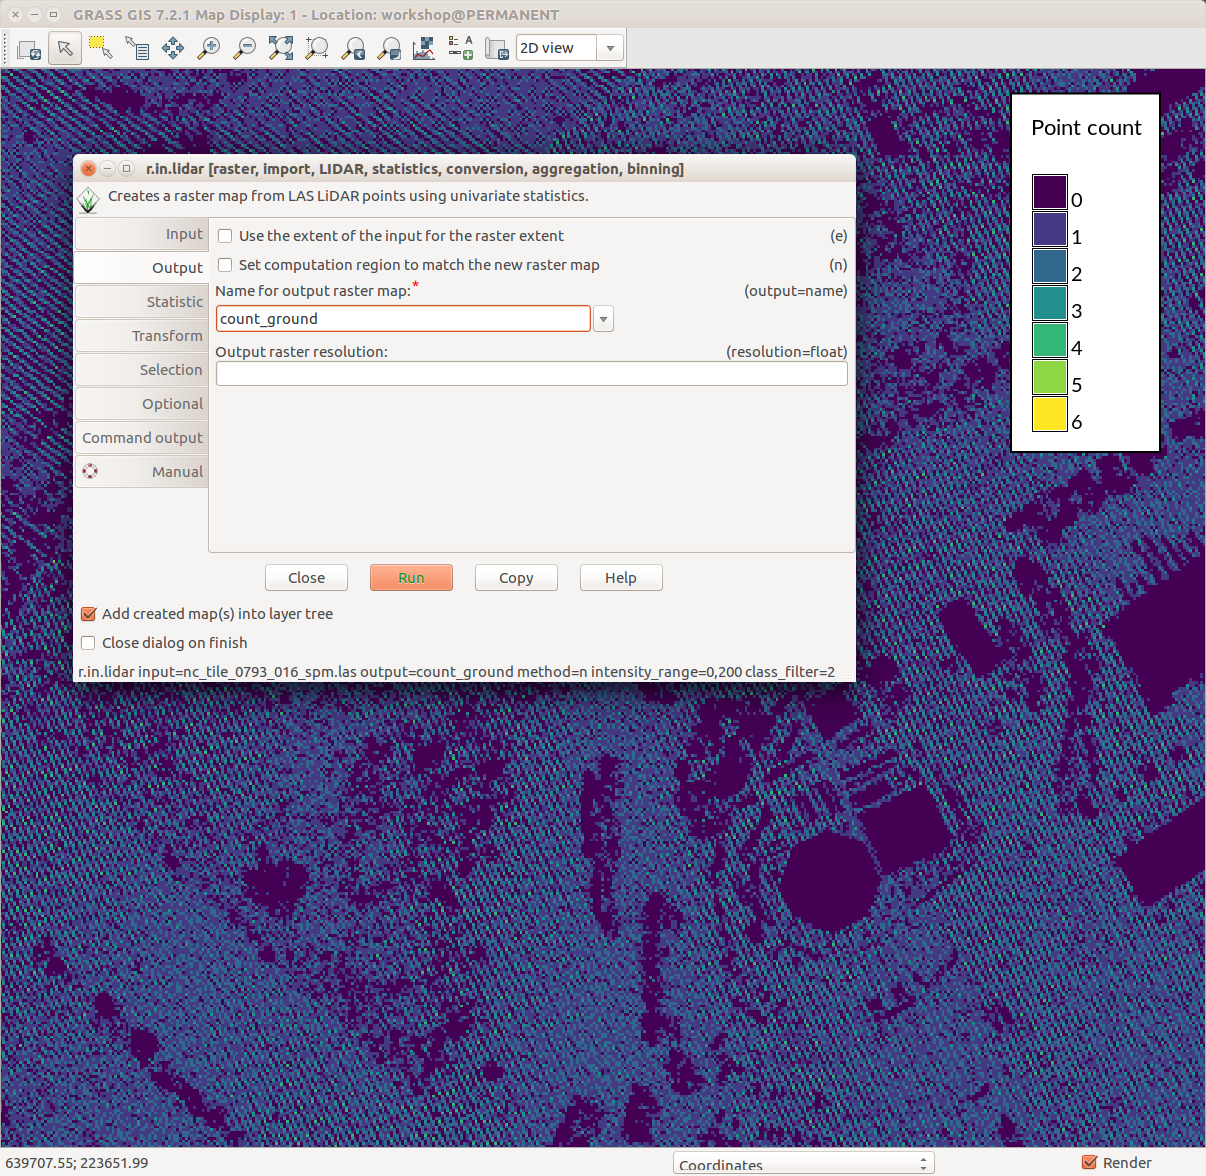
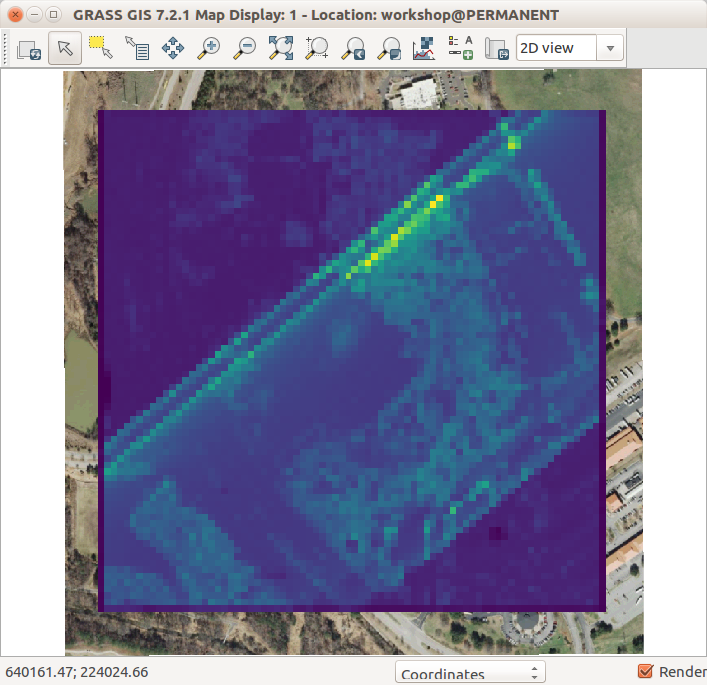
| 19:16, 1 August 2017 | Counting ground points per cell with r.in.lidar.png (file) |  |
231 KB | ⚠️Wenzeslaus | GRASS GIS 7.2 wxGUI Map Display, legend with d.legend, r.in.lidar dialog, ground point density pattern in the background | 1 |
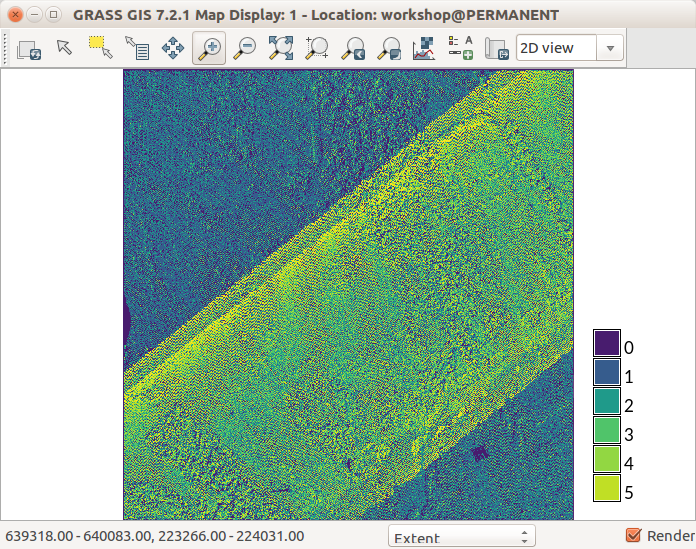
| 13:37, 1 August 2017 | Lidar point density with fine resolution showing swath overlap.png (file) |  |
246 KB | ⚠️Wenzeslaus | r.in.lidar with method=n using fine resolution GRASS GIS 7.2 Map Display | 1 |
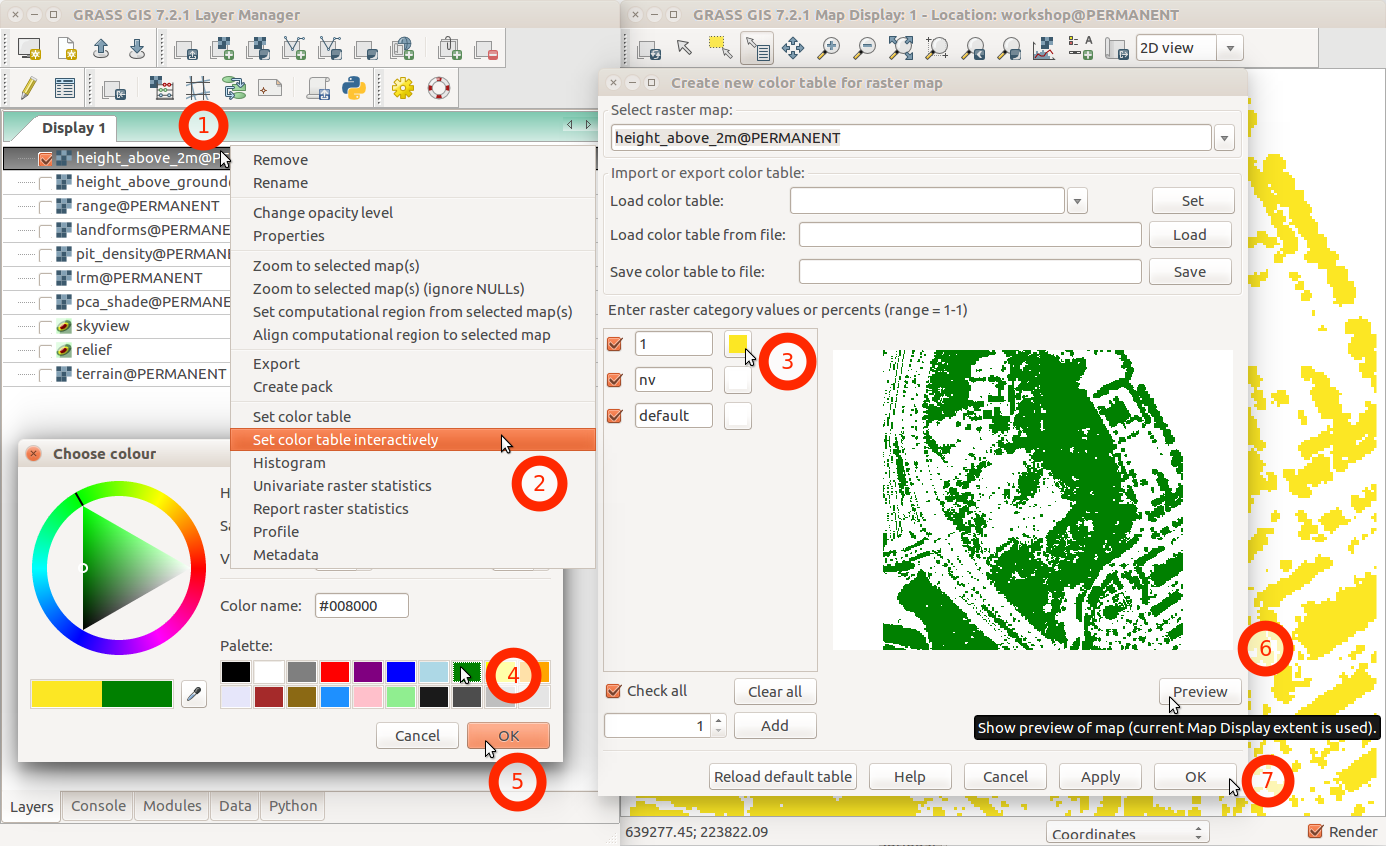
| 02:46, 1 August 2017 | Change color table interactively with menu and labels.png (file) |  |
231 KB | ⚠️Wenzeslaus | GRASS GIS 7.2 wxGUI dialog ''Create new color table for raster map'' started from layer context menu using ''Set color table interactively'' | 1 |
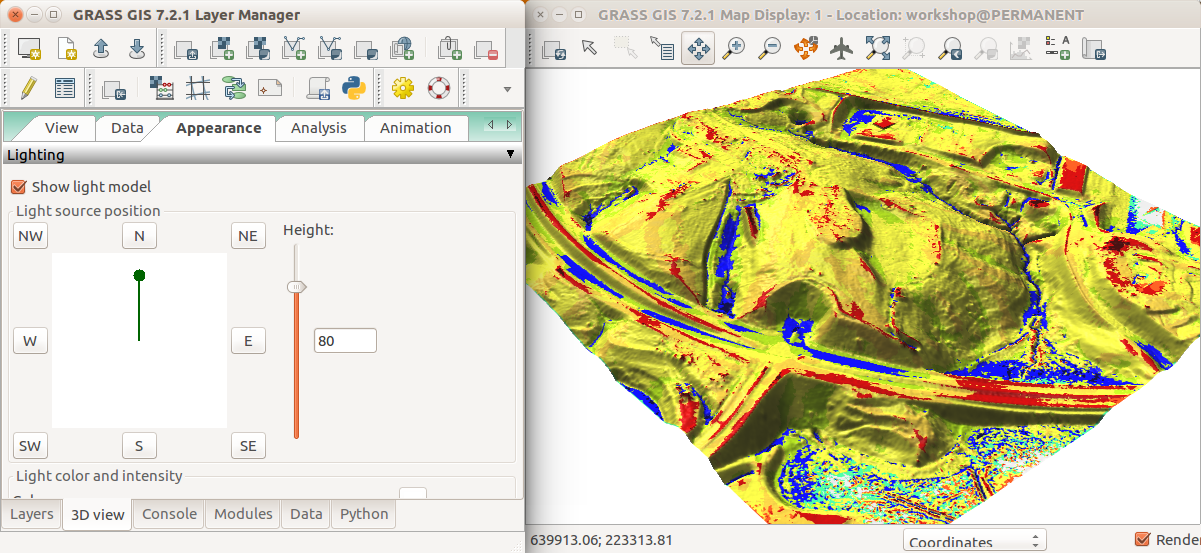
| 02:20, 1 August 2017 | Geomorphons in 3D view Appearance tab.png (file) |  |
535 KB | ⚠️Wenzeslaus | GRASS GIS 7.2 wxGUI NVIZ Appearance tab to change the light source position | 1 |
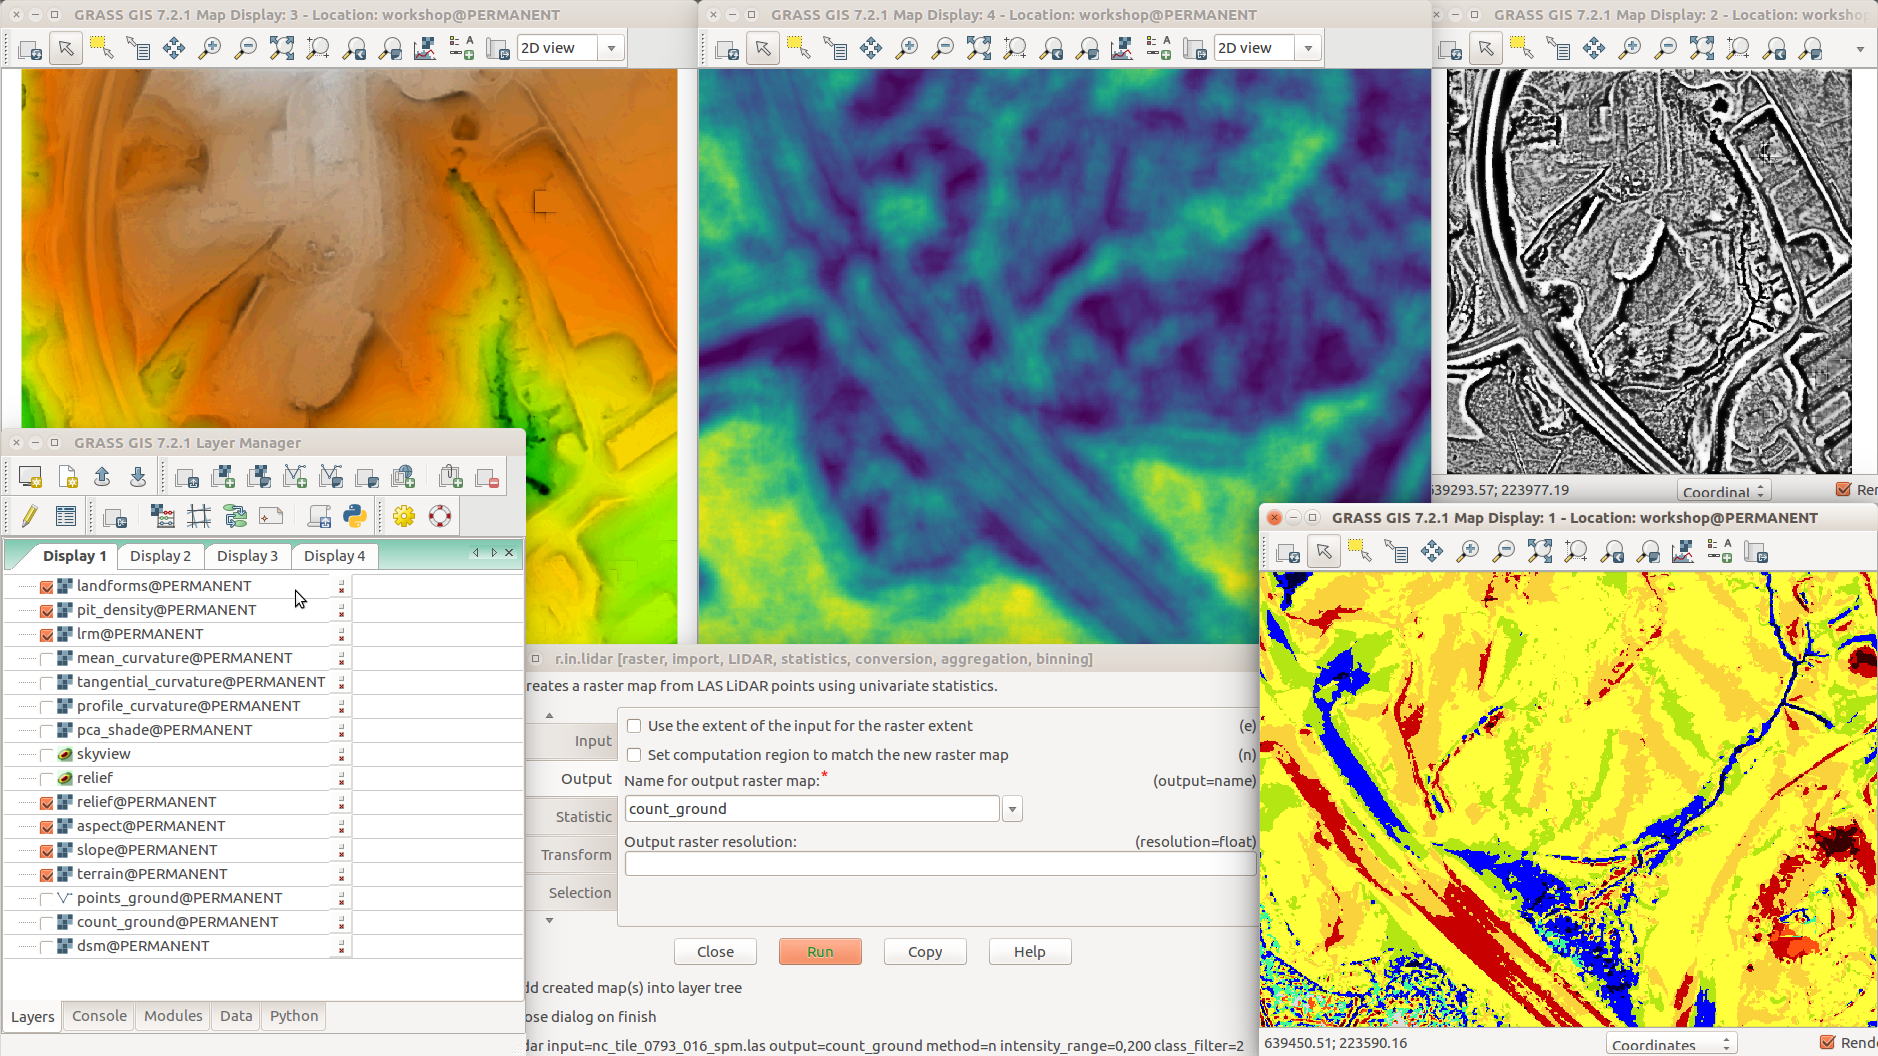
| 02:05, 1 August 2017 | Different terrain analyses and visualizations in multiple Map Displays.png (file) |  |
1,014 KB | ⚠️Wenzeslaus | GRASS GIS 7.2 with various addons r.skyview + d.shade (top left) r.terrain.texture (pit density, top middle) r.local.relief (LRM, top right) Layer Manager, Layers tab (bottom left) r.in.lidar (dialog, bottom middle) r.geomorphon (landforms, bottom right) | 1 |
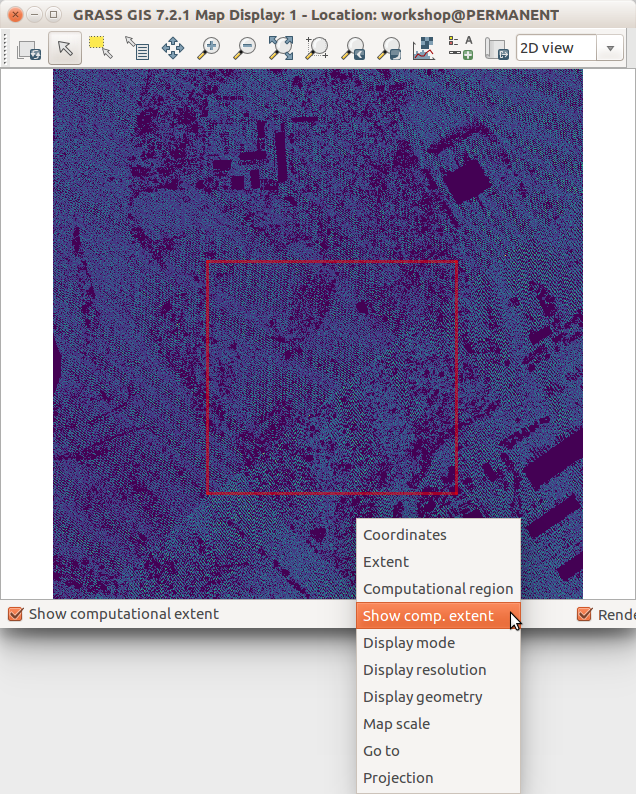
| 01:58, 1 August 2017 | Show computational extent in Map Display.png (file) |  |
239 KB | ⚠️Wenzeslaus | GRASS GIS 7.2 wxGUI Map Display | 1 |
| 01:48, 1 August 2017 | Lidar point density with coarse resolution and ortho in the background.png (file) |  |
143 KB | ⚠️Wenzeslaus | r.in.lidar res=10 -e | 1 |
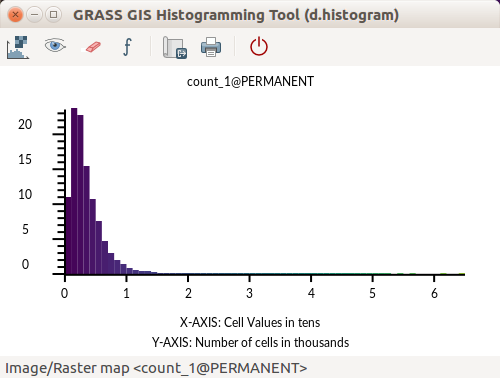
| 01:41, 1 August 2017 | GRASS GIS Histogramming Tool d.histogram - count of point.png (file) |  |
24 KB | ⚠️Wenzeslaus | d.histogram powered histogram in GRASS GIS 7.2 Count of points per cell | 1 |
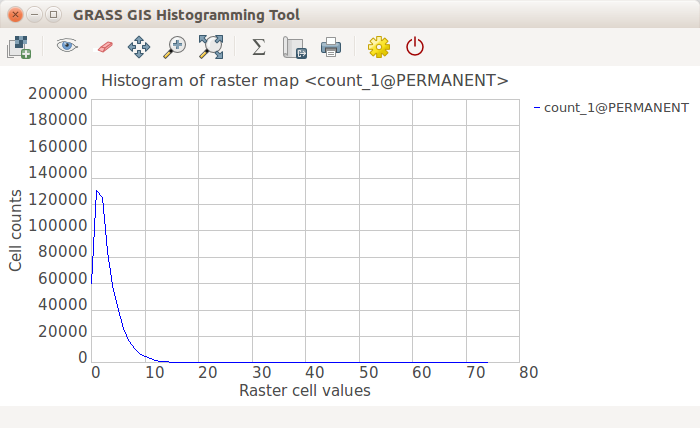
| 01:41, 1 August 2017 | GRASS GIS Histogramming Tool wxPython - count of point.png (file) |  |
33 KB | ⚠️Wenzeslaus | wxPython powered histogram in GRASS GIS 7.2 | 1 |
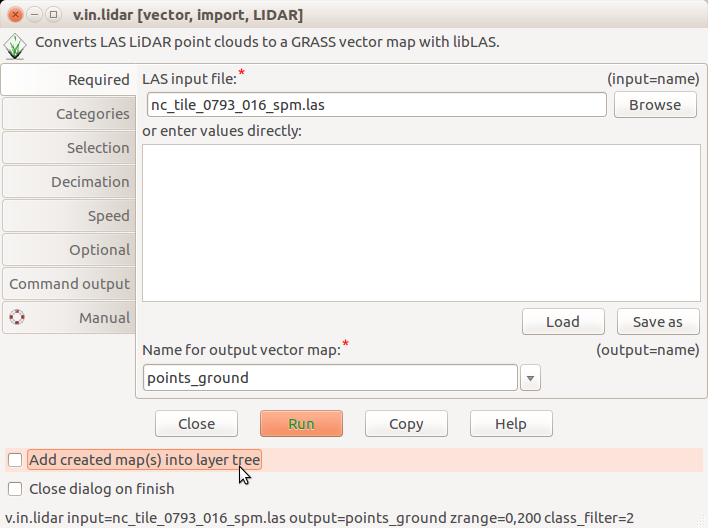
| 20:55, 31 July 2017 | V.in.lidar dialog do not add into layer tree.png (file) |  |
59 KB | ⚠️Wenzeslaus | Unchecked ''Add created map(s) into layer tree'' in v.in.lidar | 1 |
| 15:11, 22 July 2017 | Paris2017sprint.jpg.jpg (file) |  |
1.55 MB | ⚠️MilenaN | 1 | |
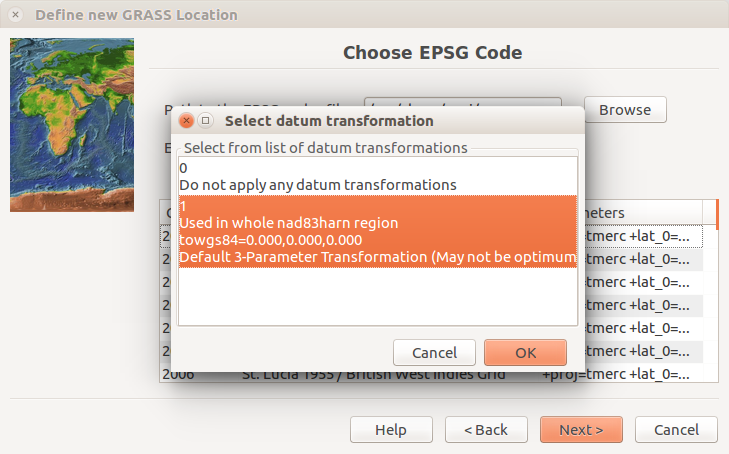
| 15:28, 21 July 2017 | Location wizard epsg datum transformation.png (file) | 116 KB | ⚠️Wenzeslaus | Choose EPSG page of the Location Wizard after pressing Next with a dialog for selecting datum transformation with the default selection. EPSG is 3358. Screenshot from GRASS GIS 7.2.1. | 1 | |
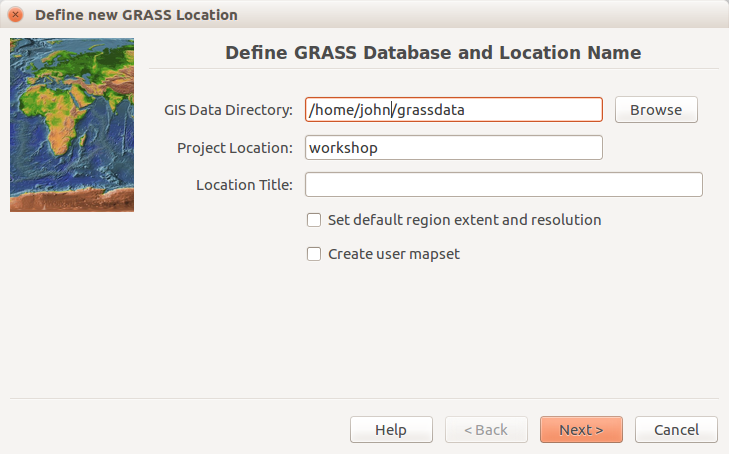
| 15:25, 21 July 2017 | Location wizard define.png (file) |  |
83 KB | ⚠️Wenzeslaus | Initial (define path and names) page of the Location Wizard. The user name is john. The location name workshop. Database is in /home/john/grassdata. Screenshot from GRASS GIS 7.2.1. | 1 |
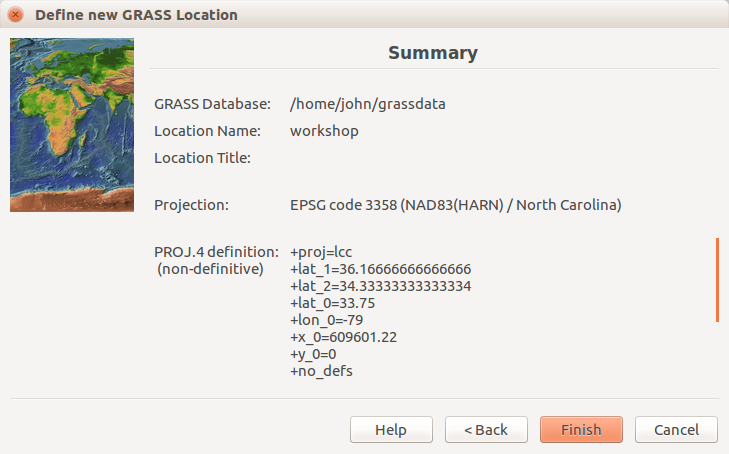
| 15:22, 21 July 2017 | Location wizard summary 7.2.1.png (file) |  |
88 KB | ⚠️Wenzeslaus | Summary page of the Location Wizard. The user name is john. The location name workshop. Database is in /home/john/grassdata. EPSG is 3358. | 1 |
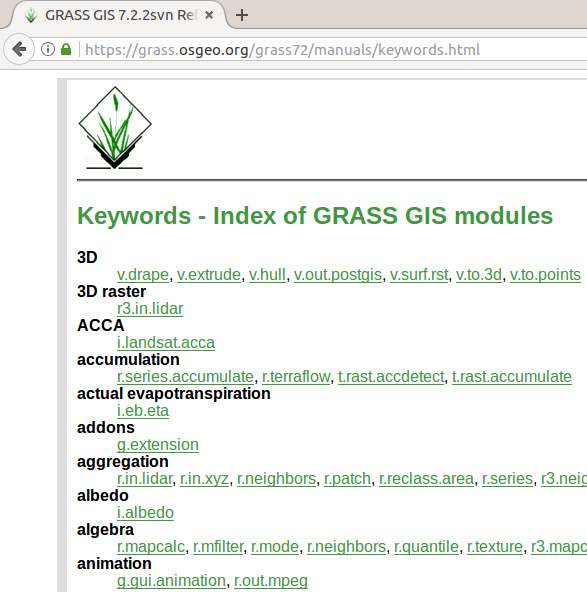
| 15:19, 21 July 2017 | Manual pages online keywords 7.2.png (file) |  |
51 KB | ⚠️Wenzeslaus | https://grass.osgeo.org/grass72/manuals/keywords.html for 7.2.2svn showing web browser tab and part of the page | 1 |
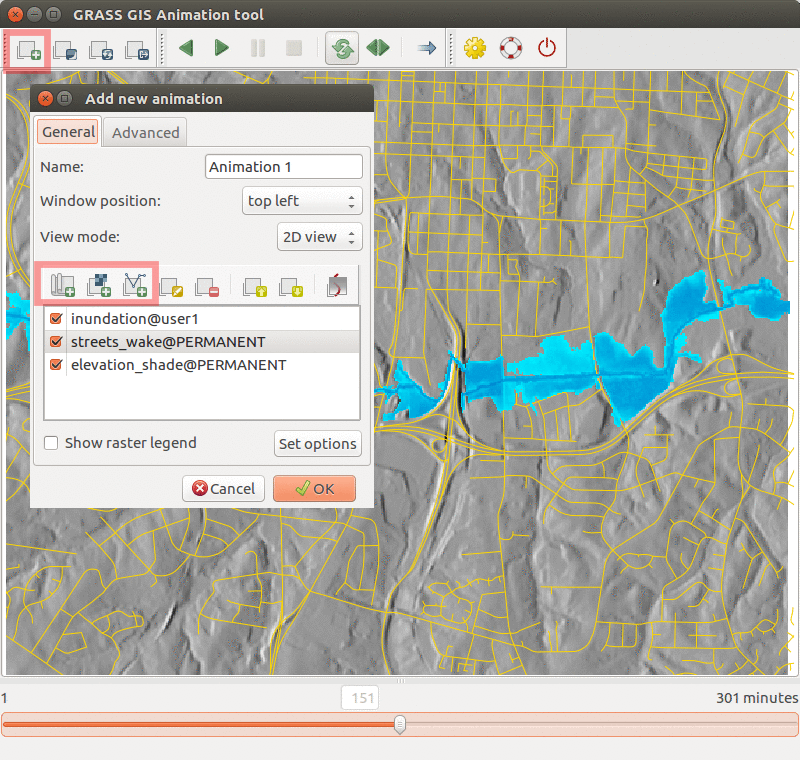
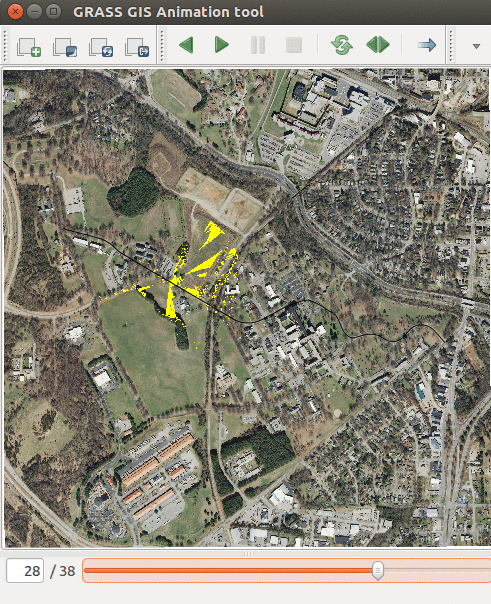
| 04:38, 21 July 2017 | Animation tool inundation.png (file) |  |
468 KB | Annakrat | Inundation computed with {{addonCmd|r.stream.distance}} and {{addonCmd|r.lake.series}} and visualized in Animation Tool. | 1 |
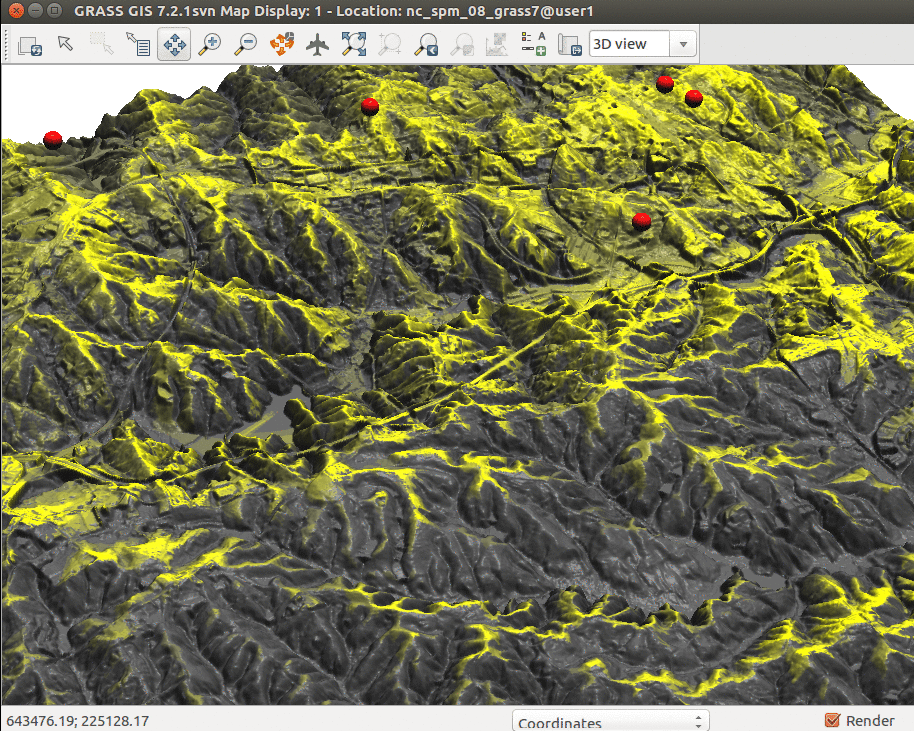
| 20:28, 19 July 2017 | Cumulative viewshed elevation.png (file) |  |
1.08 MB | Annakrat | Cumulative viewshed draped over elevation raster (Boston 2017 workshop) | 1 |
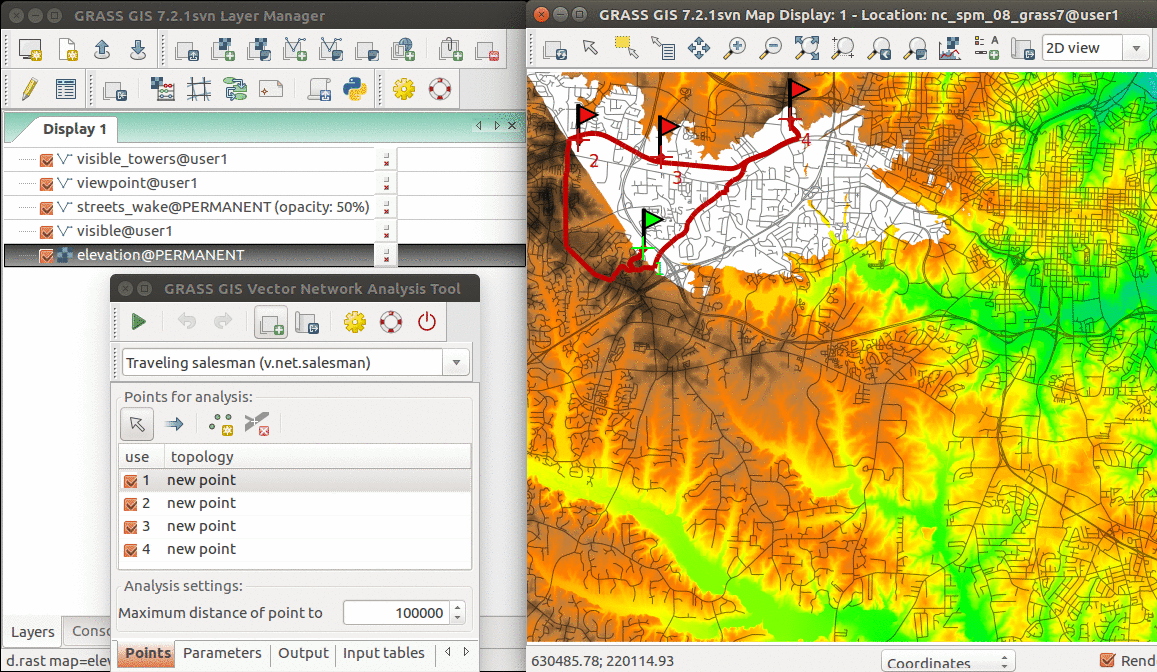
| 19:33, 19 July 2017 | Vector network GUI GRASS 72.png (file) |  |
727 KB | Annakrat | Example of using Vector Network Analysis Tool for Traveling Salesman problem | 1 |
| 18:12, 19 July 2017 | Grass gis cli ubuntu purple r.in.lidar.png (file) |  |
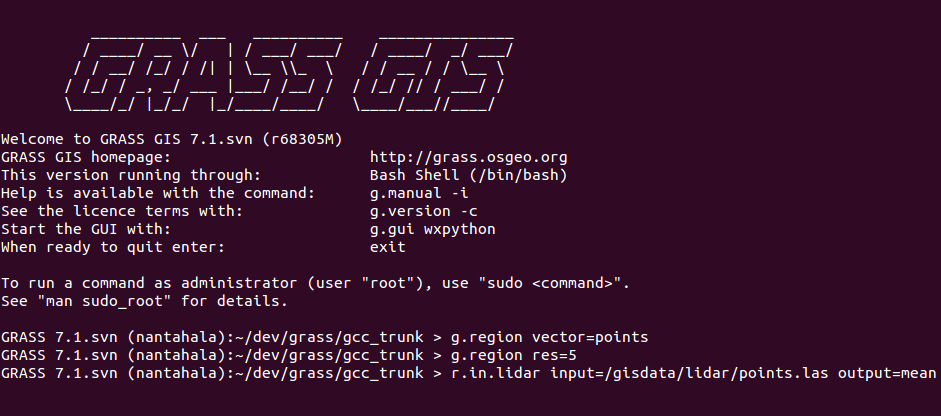
52 KB | ⚠️Wenzeslaus | GRASS GIS command line interface (CLI) in Ubuntu terminal (purple/violet) Commands: g.region vector=points g.region res=5 r.in.lidar input=/gisdata/lidar/points.las output=mean | 1 |
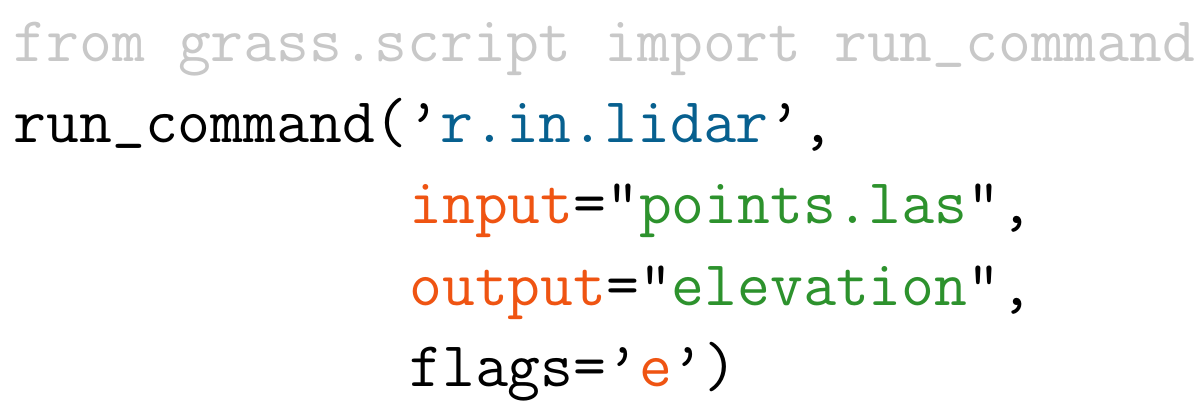
| 17:44, 19 July 2017 | Example r.in.lidar command in Python.png (file) |  |
47 KB | ⚠️Wenzeslaus | Example r.in.lidar command in Python with highlighted module name (blue), options and flags (red) and option values (green) and import (grey) | 1 |
| 17:42, 19 July 2017 | Example r.in.lidar command in Bash.png (file) | 23 KB | ⚠️Wenzeslaus | Example r.in.lidar command in Bash with highlighted module name (blue), options and flags (red) and option values (green) | 1 | |
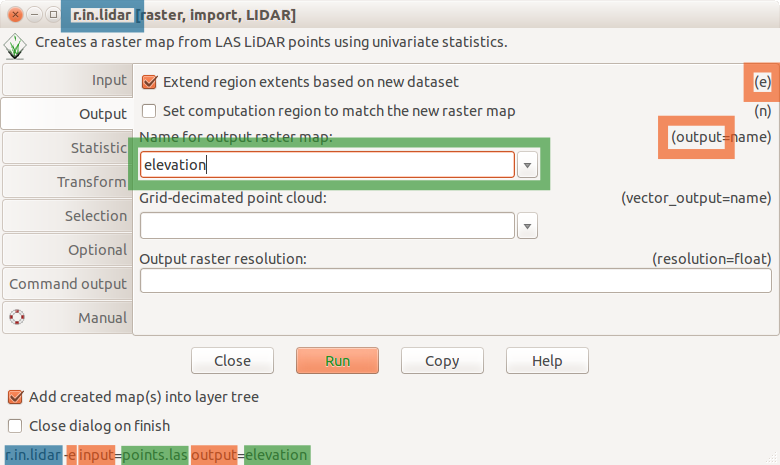
| 17:38, 19 July 2017 | R in lidar dialog.png (file) |  |
58 KB | ⚠️Wenzeslaus | r.in.lidar dialog with Output tab active and highlighted module name (blue), options and flags (red) and option values (green) | 1 |
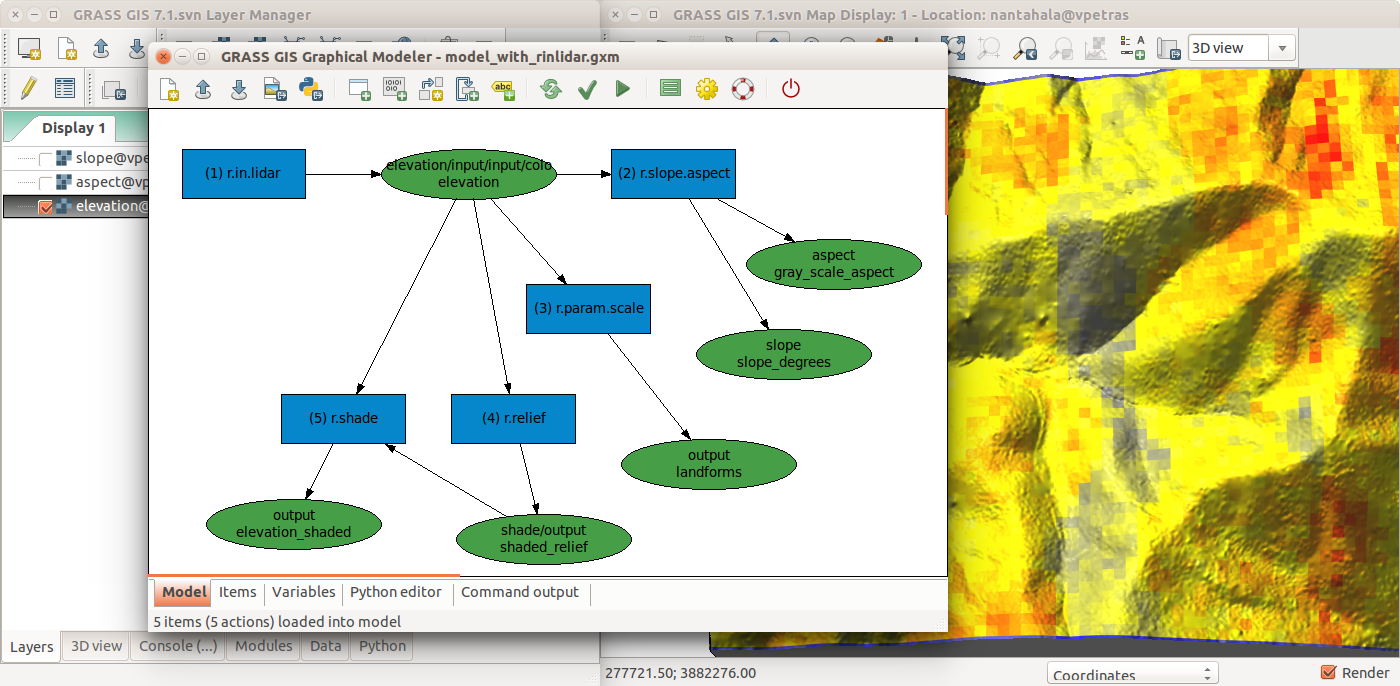
| 17:35, 19 July 2017 | Graphical Modeler with r.in.lidar and terrain analysis.png (file) |  |
457 KB | ⚠️Wenzeslaus | r.in.lidar followed by r.slope.aspect, r.param.scale, r.relief with r.shade in GRASS GIS Graphical Modeler with the main GUI in the background | 1 |
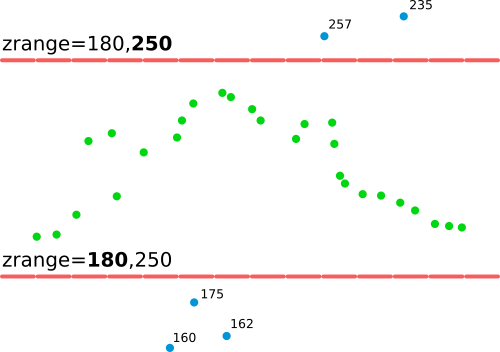
| 15:52, 19 July 2017 | R in lidar explanation of zrange option.png (file) |  |
14 KB | ⚠️Wenzeslaus | Explanation of zrange option applicable to v.in.lidar or r.in.lidar | 1 |
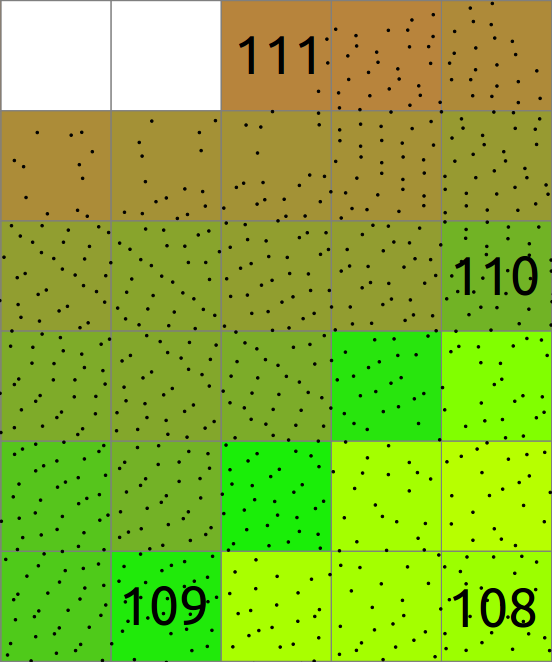
| 15:20, 19 July 2017 | Binning mean explanation.png (file) |  |
61 KB | ⚠️Wenzeslaus | Explanation of binning of points into a 2D raster map where resulting cell value is mean of point values. | 1 |
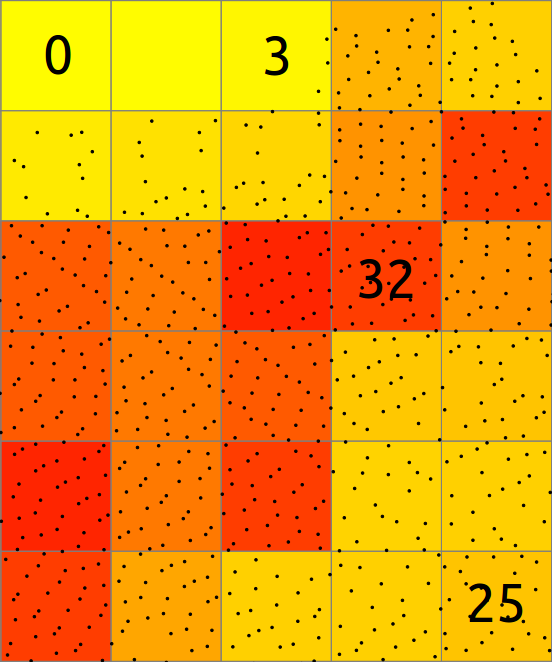
| 15:19, 19 July 2017 | Binning count explanation.png (file) |  |
54 KB | ⚠️Wenzeslaus | Explanation of binning of points into a 2D raster map. | 1 |
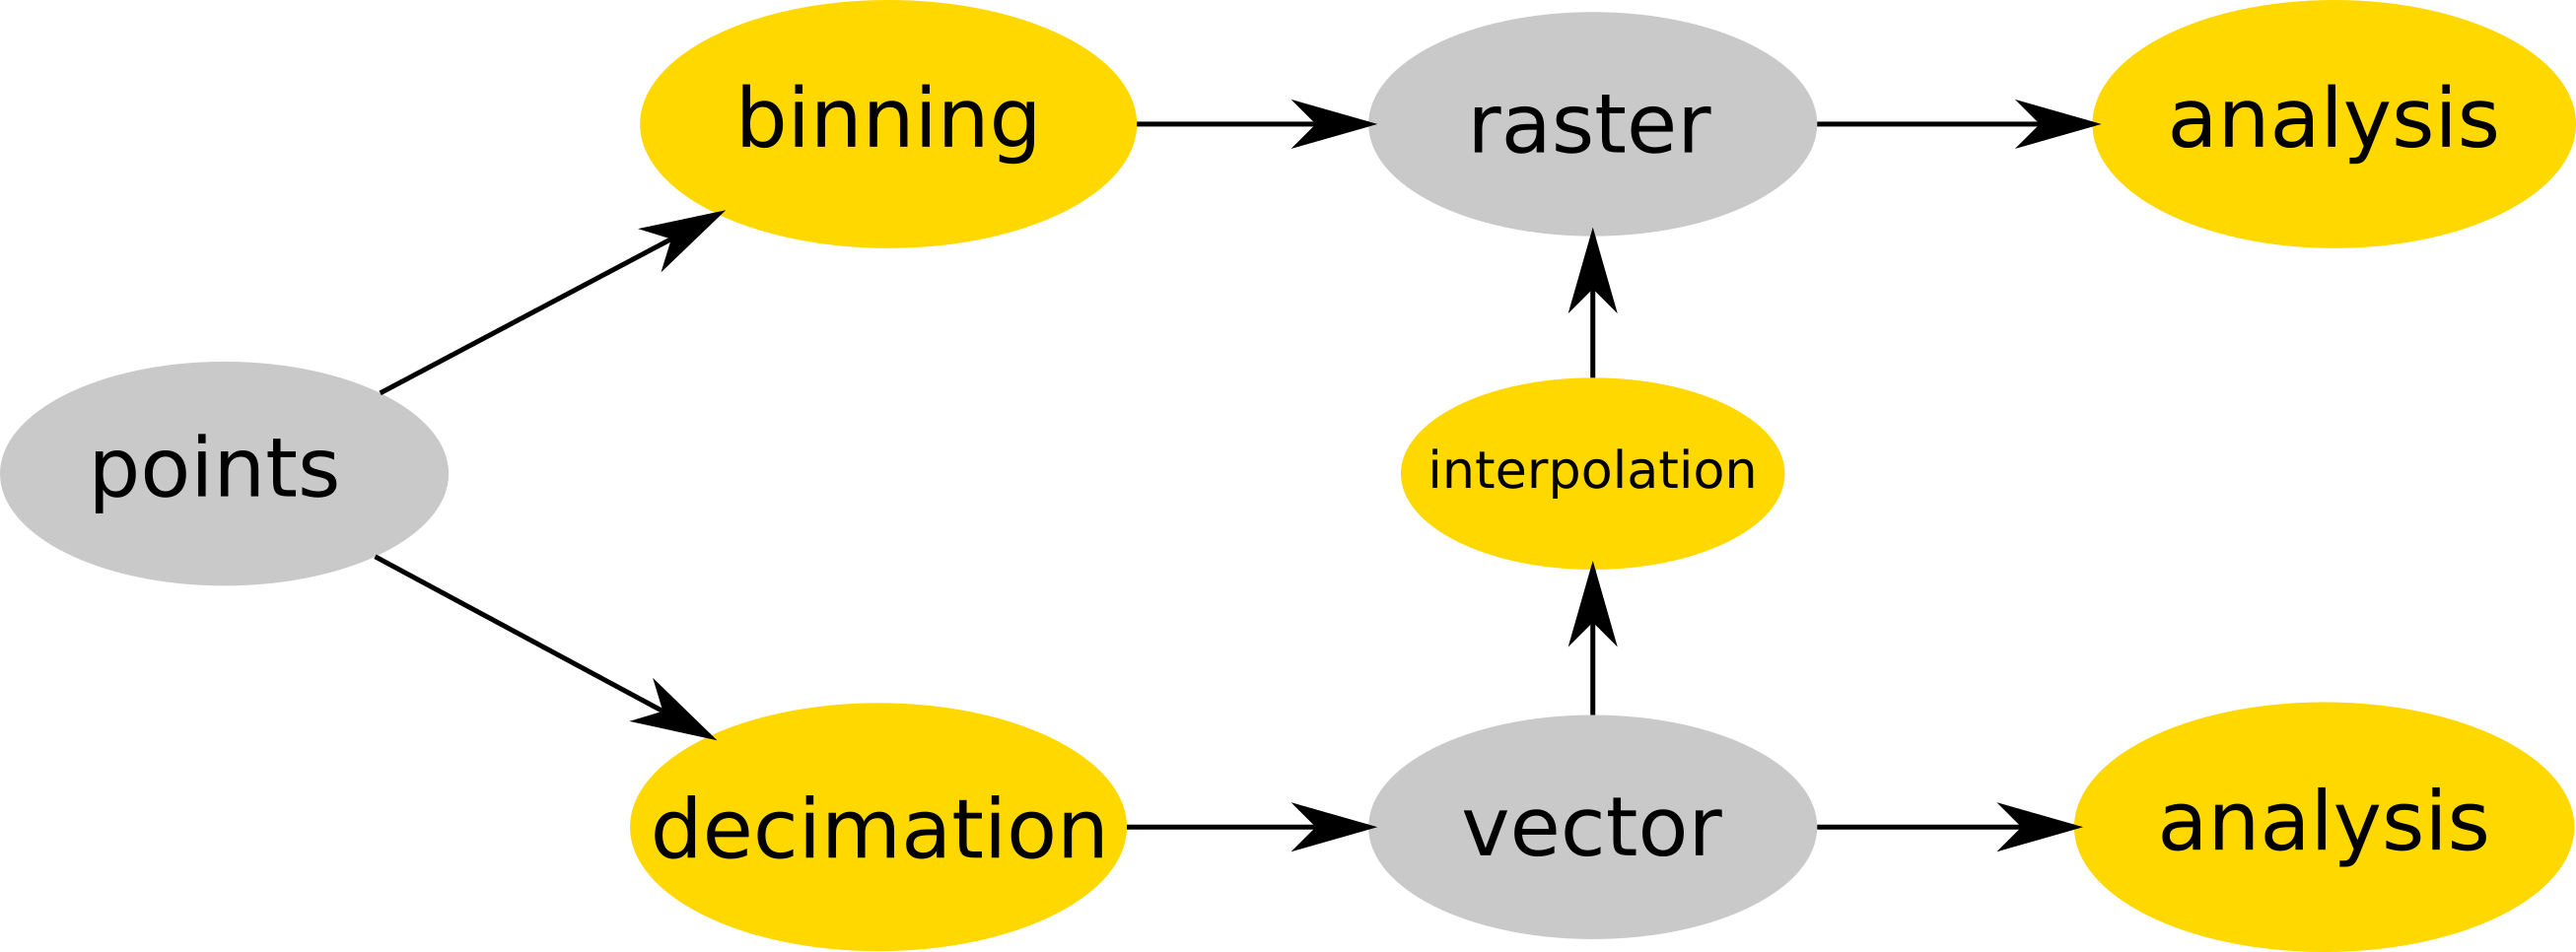
| 15:17, 19 July 2017 | Binning and decimation workflow schema for point clouds.png (file) |  |
127 KB | ⚠️Wenzeslaus | Point cloud is either binned into a raster map (e.g. r.in.lidar) and then analyzed (as raster) or (optionally) decimated (e.g. v.in.lidar), converted to vector map and then interpolated (e.g. v.surf.rst) into raster or analyzed as vector map (e.g. v.ve... | 1 |
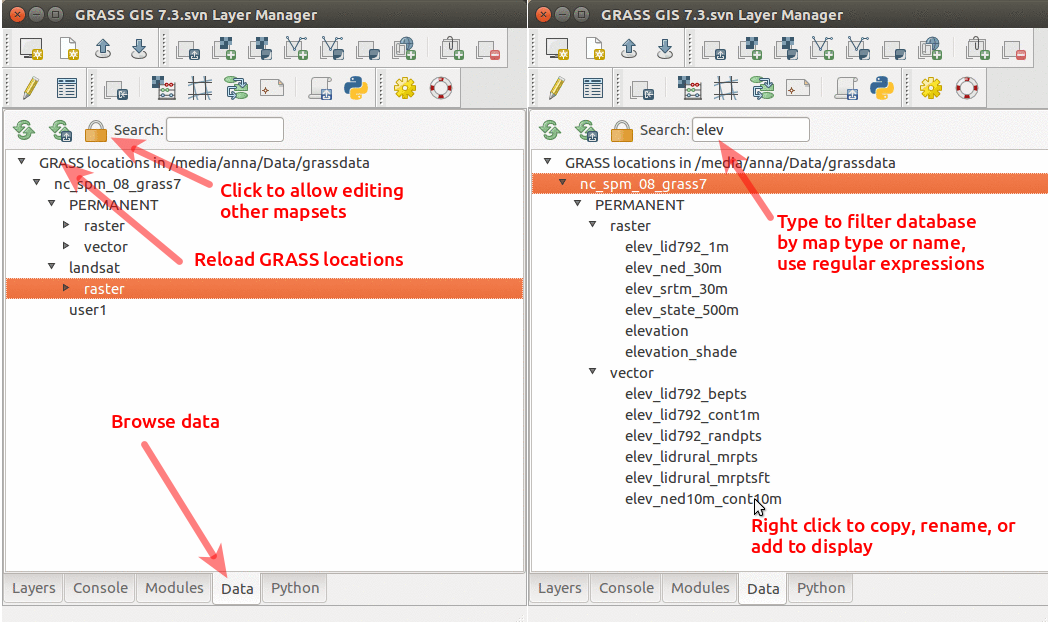
| 01:36, 19 July 2017 | GRASS GIS 7.3 data catalog.png (file) |  |
241 KB | Annakrat | Data catalog in GRASS GIS 7.3 with nc_spm_08_grass7 location | 1 |
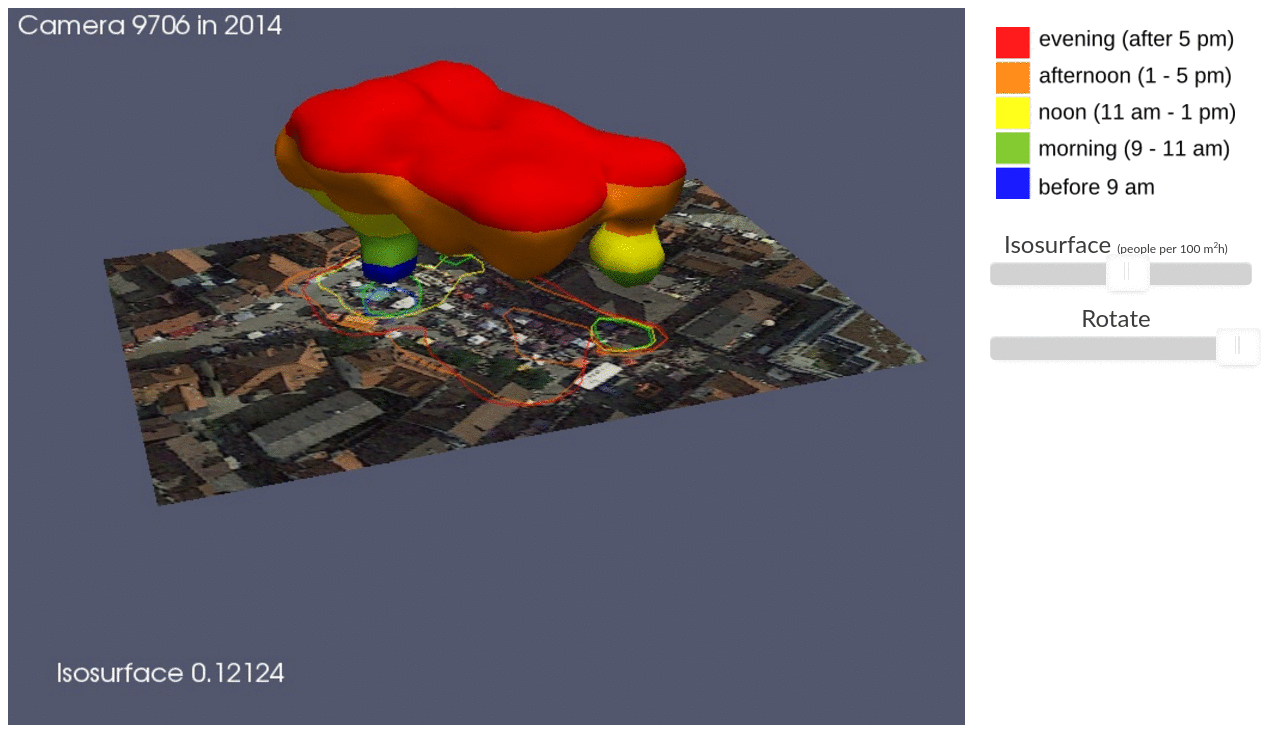
| 01:40, 18 July 2017 | ICC STC illustration.png (file) |  |
468 KB | Annakrat | Presentation on Using space-time cube for visualization and analysis of active transportation patterns derived from public webcams by Anna Petrasova, Aaron Hipp, and Helena Mitasova from North Carolina State University | 1 |
| 21:51, 22 June 2017 | Blender-plain.png (file) |  |
11 KB | Annakrat | Blender logo | 1 |
| 21:00, 22 June 2017 | ICC workshop 3Dview ortho.png (file) |  |
1.45 MB | Annakrat | 3D visulization of digital surface model draped with orthophoto | 1 |
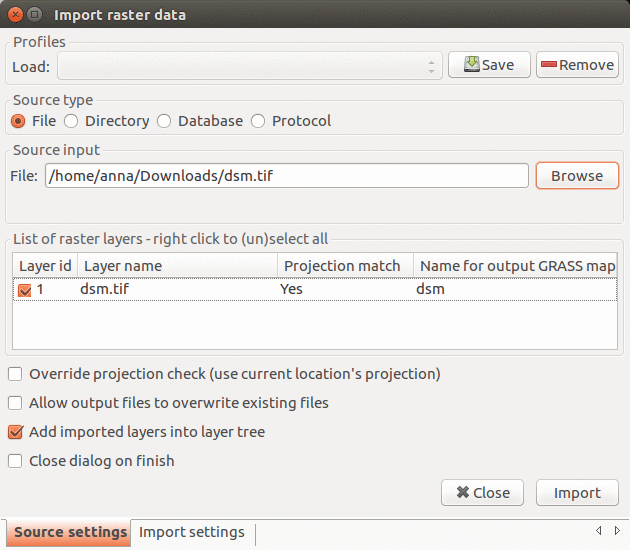
| 14:02, 22 June 2017 | Import raster 7.2.1.png (file) |  |
130 KB | Annakrat | Import raster data dialog in GRASS GIS 7.2.1 | 1 |
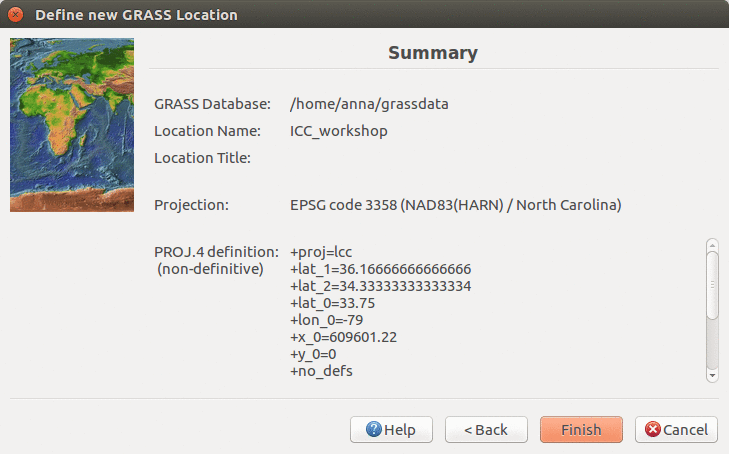
| 03:22, 22 June 2017 | ICC workshop location wizard summary 7.2.png (file) |  |
114 KB | Annakrat | Location Wizard summary page | 1 |
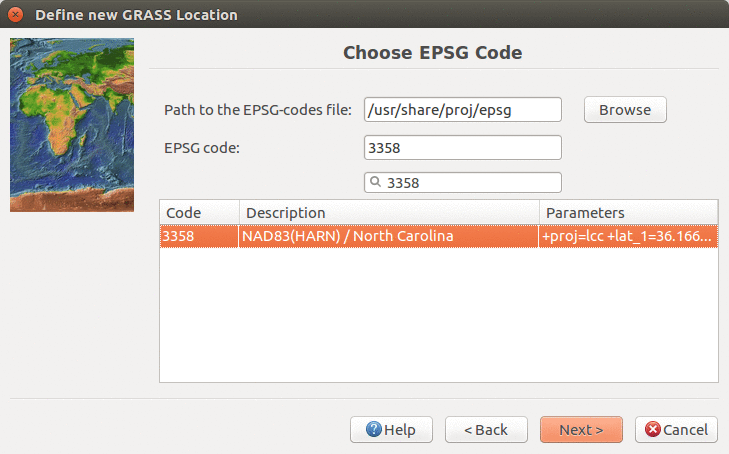
| 03:21, 22 June 2017 | Location wizard EPSG3358 7.2.png (file) |  |
131 KB | Annakrat | Creating new location with EPSG 3358 in Location Wizard | 1 |
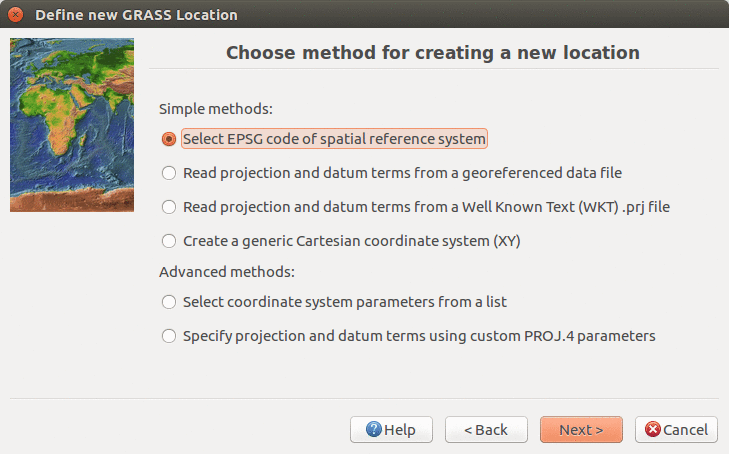
| 03:20, 22 June 2017 | Location wizard method 7.2.png (file) |  |
126 KB | Annakrat | Define CRS in Location Wizard in 7.2. version using EPSG code | 1 |
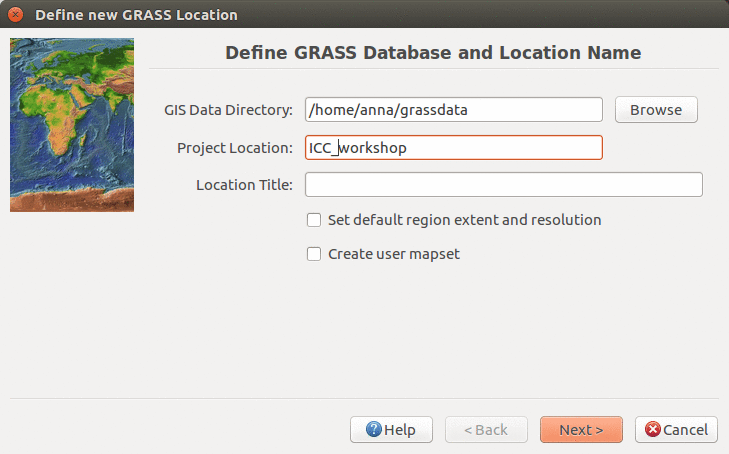
| 03:18, 22 June 2017 | ICC workshop location wizard define 7.2.png (file) |  |
118 KB | Annakrat | Defining new location name in Location Wizard (ICC workshop) | 1 |
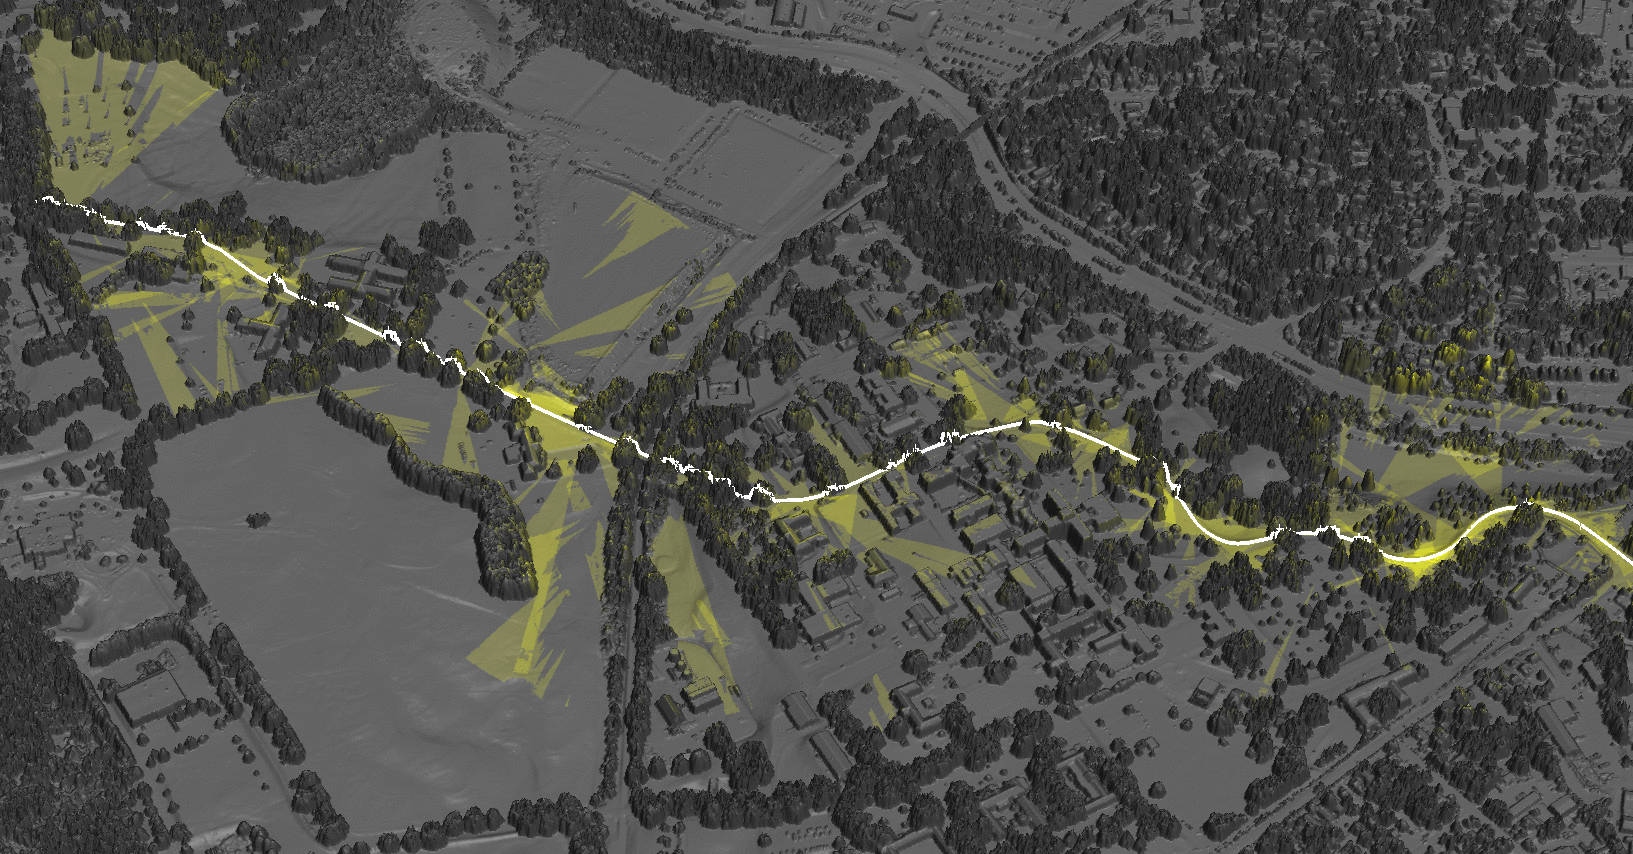
| 21:40, 21 June 2017 | Animation tool viewsheds.png (file) |  |
619 KB | Annakrat | Showing series of viewsheds with Animation Tool | 1 |
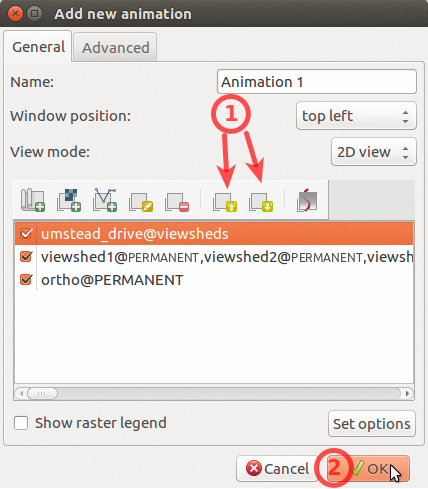
| 20:55, 21 June 2017 | Animation tool layers.png (file) |  |
114 KB | Annakrat | How to change order of layers in Animation Tool | 1 |
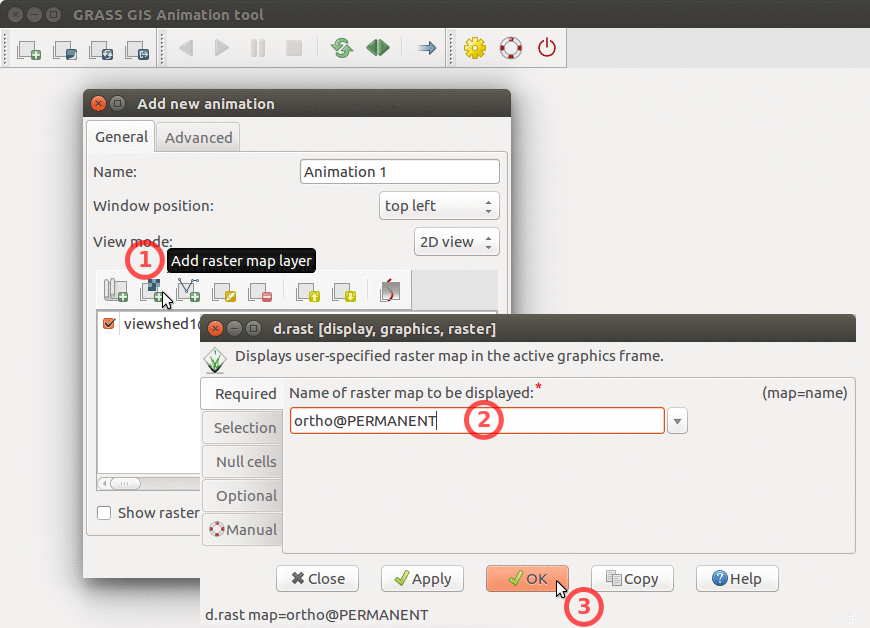
| 20:54, 21 June 2017 | Animation tool add base raster.png (file) |  |
251 KB | Annakrat | How to add base raster to Animation Tool | 1 |
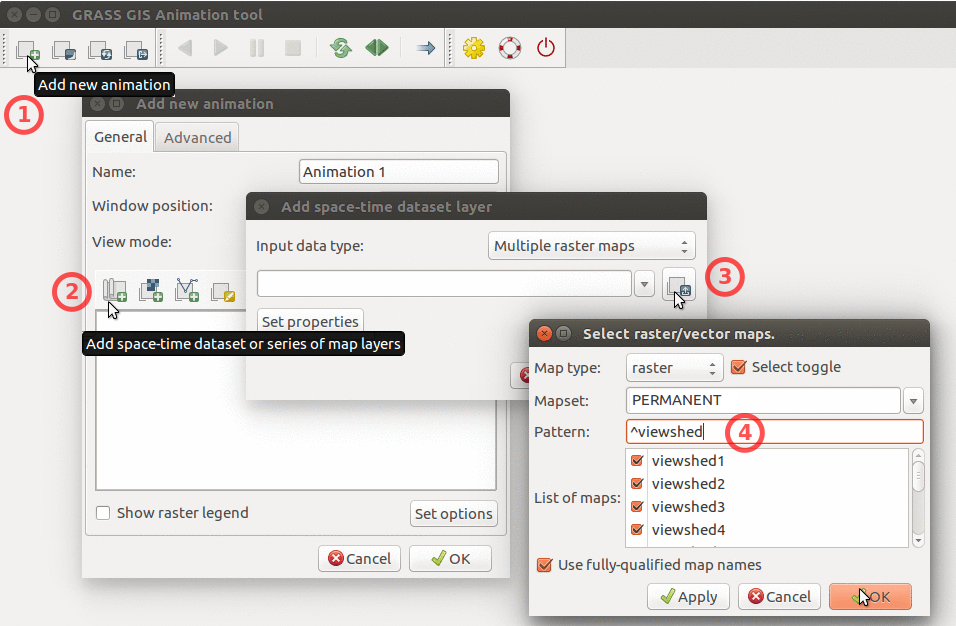
| 20:54, 21 June 2017 | Animation tool add multiple rasters.png (file) |  |
320 KB | Annakrat | How to add multiple raster maps and filter them by name. | 1 |
| 19:27, 21 June 2017 | Cumulative viewshed.png (file) |  |
1.34 MB | Annakrat | Cumulative viewshed computed from views along a road. | 1 |
| 09:47, 12 June 2017 | FOSS4G-Europe-2017.png (file) |  |
386 KB | Lucadelu | 1 | |
| 15:14, 2 June 2017 | Icc2017 logo.png (file) | 64 KB | ⚠️Wenzeslaus | Logo of the 28th International Cartographic Conference of the International Cartographic Association, Washington, DC, July 2 to 7, 2017 http://icc2017.org/ http://icc2017.org/wp-content/uploads/2016/08/logo.png | 1 | |
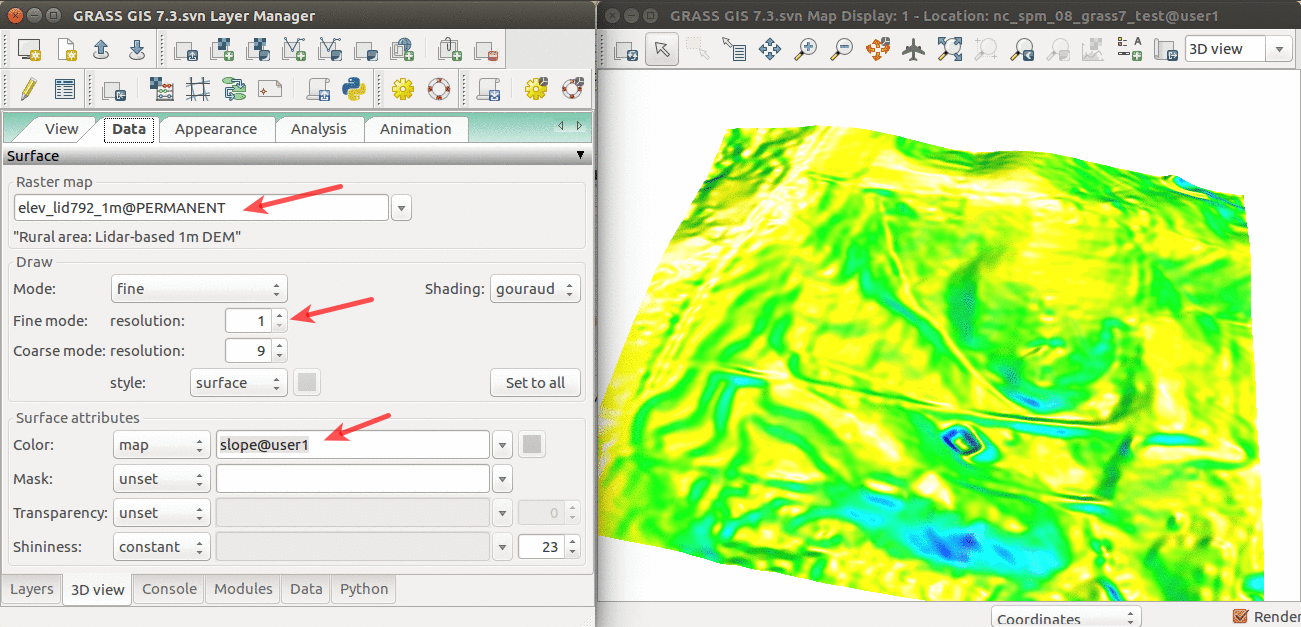
| 14:48, 11 April 2017 | Elevation slope 3D view.png (file) |  |
565 KB | Annakrat | 3D visualization of elev_lid792_1m DEM with slope draped over. | 1 |
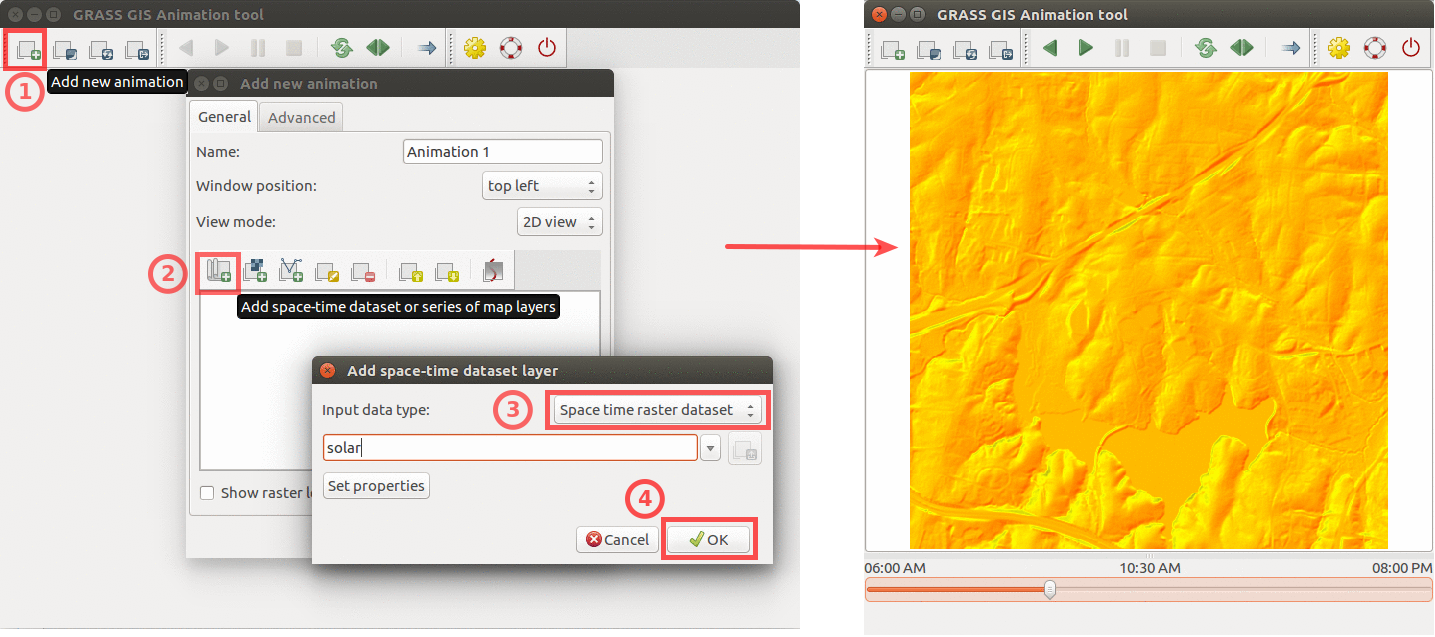
| 22:15, 9 April 2017 | Animation solar example.png (file) |  |
439 KB | Annakrat | Using GRASS GIS animation tool to animate solar irradiance during a day. Computed by {{addonCmd|r.sun.hourly}}. | 1 |
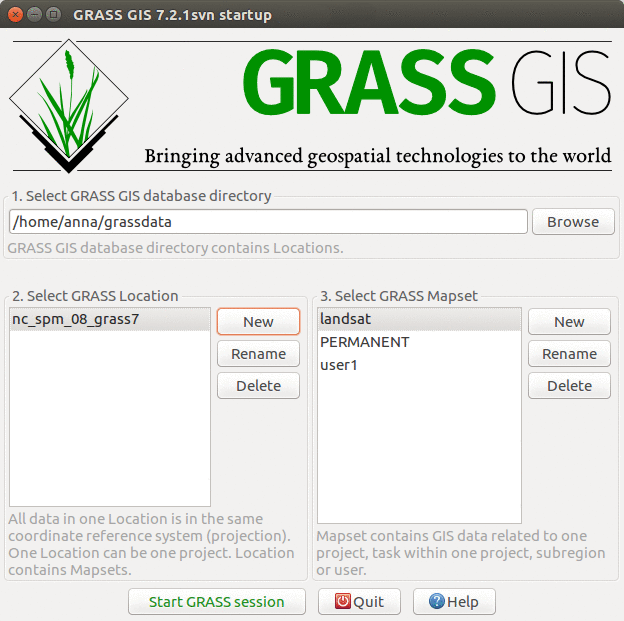
| 15:29, 5 April 2017 | GRASS startup ncspm.png (file) |  |
150 KB | Annakrat | GRASS GIS 7.2 startup screen with North Carolina sample dataset | 1 |
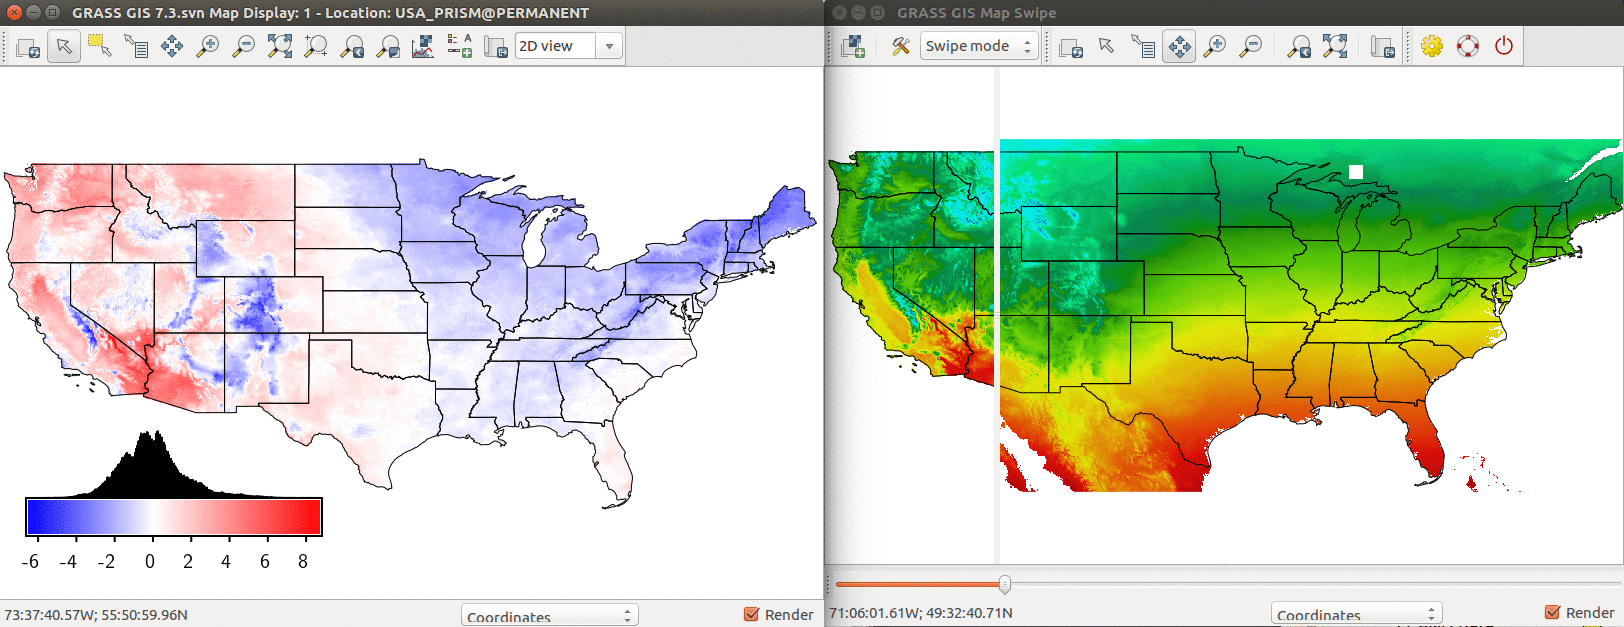
| 20:03, 4 April 2017 | US temp model comparison.png (file) |  |
529 KB | Annakrat | Comparison of PRISM annual mean temperature and modeled temperature based on latitude and elevation. Left: Difference between modeled and real temperature in degree Celsius. Right: Using Map Swipe to visually assess the model (modeled temperature on th... | 1 |
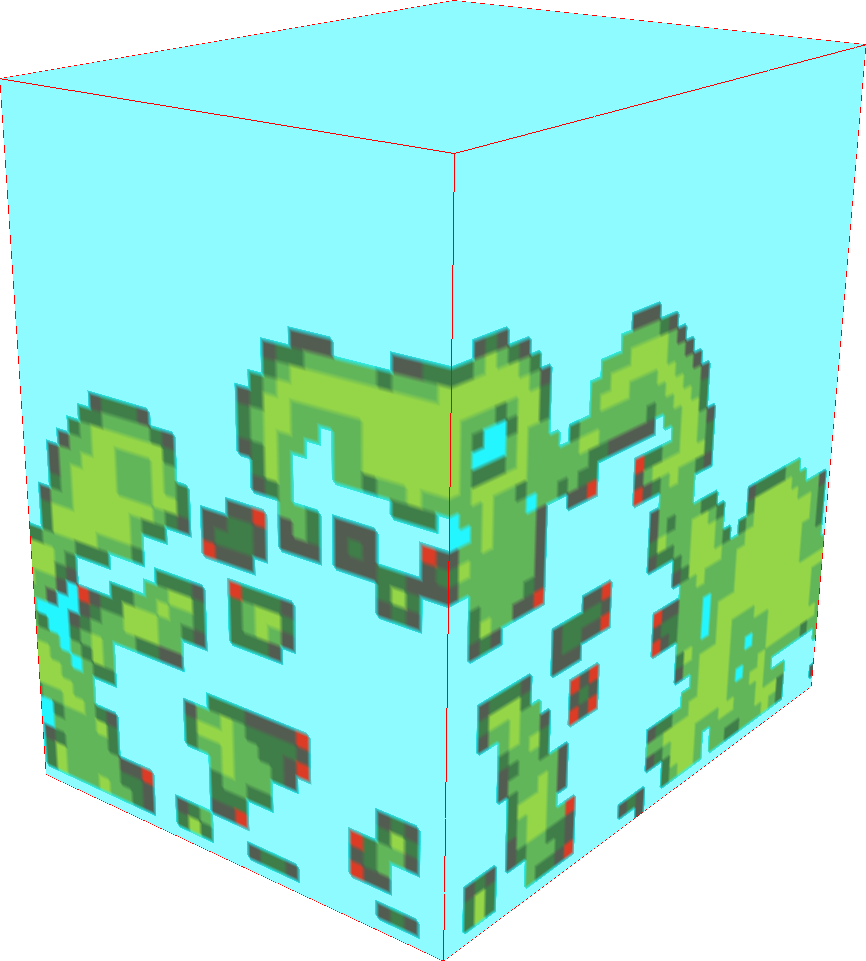
| 21:05, 24 March 2017 | Raster3d example small data.png (file) |  |
147 KB | ⚠️Wenzeslaus | Example of a 3D raster. Small data. Lidar-based presence/absence in 3D. r3.forestfrag. Using slices in 3D view (NVIZ). Modified colors. | 1 |