File list
Jump to navigation
Jump to search
This special page shows all uploaded files.
| Date | Name | Thumbnail | Size | User | Description | Versions |
|---|---|---|---|---|---|---|
| 17:42, 19 July 2017 | Example r.in.lidar command in Bash.png (file) | 23 KB | ⚠️Wenzeslaus | Example r.in.lidar command in Bash with highlighted module name (blue), options and flags (red) and option values (green) | 1 | |
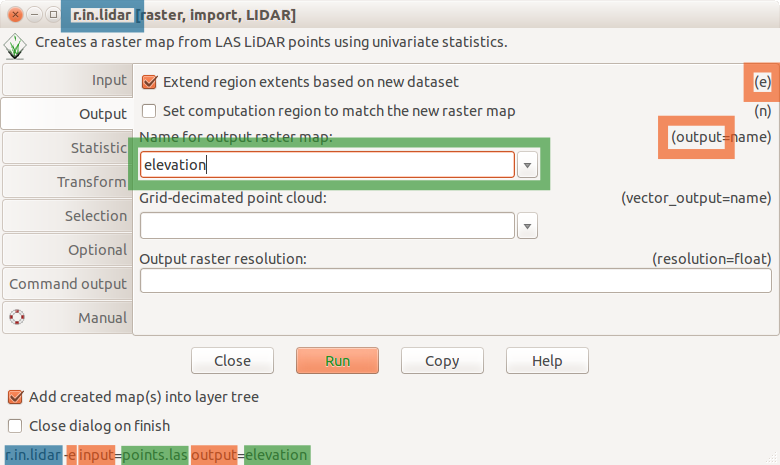
| 17:38, 19 July 2017 | R in lidar dialog.png (file) |  |
58 KB | ⚠️Wenzeslaus | r.in.lidar dialog with Output tab active and highlighted module name (blue), options and flags (red) and option values (green) | 1 |
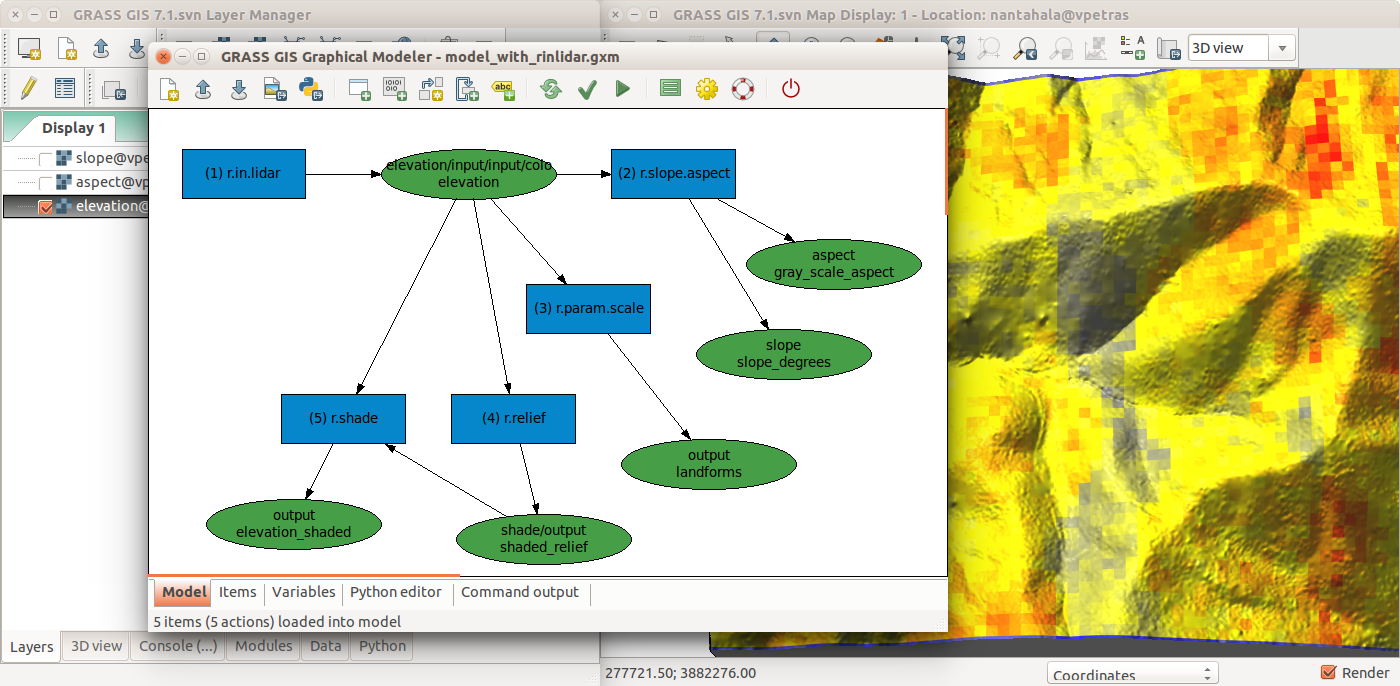
| 17:35, 19 July 2017 | Graphical Modeler with r.in.lidar and terrain analysis.png (file) |  |
457 KB | ⚠️Wenzeslaus | r.in.lidar followed by r.slope.aspect, r.param.scale, r.relief with r.shade in GRASS GIS Graphical Modeler with the main GUI in the background | 1 |
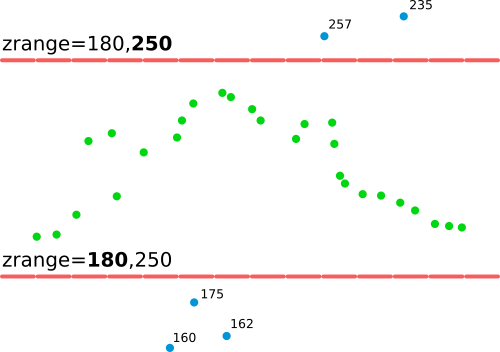
| 15:52, 19 July 2017 | R in lidar explanation of zrange option.png (file) |  |
14 KB | ⚠️Wenzeslaus | Explanation of zrange option applicable to v.in.lidar or r.in.lidar | 1 |
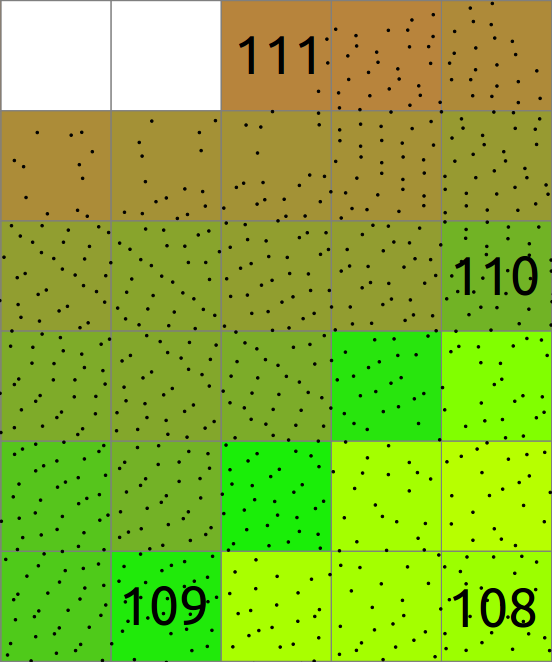
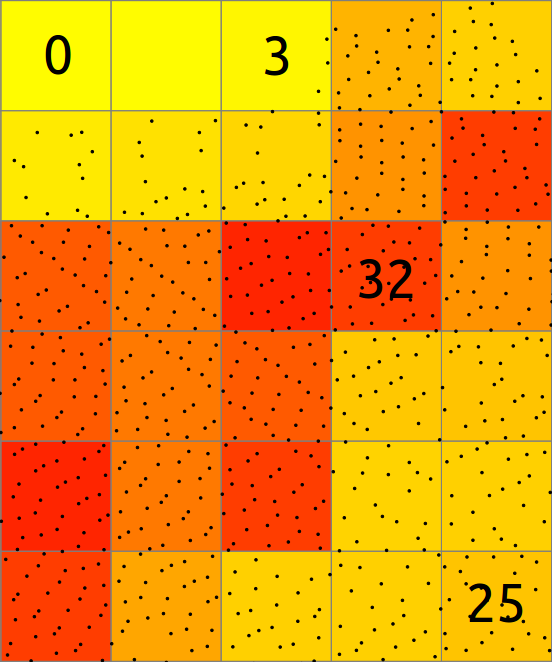
| 15:20, 19 July 2017 | Binning mean explanation.png (file) |  |
61 KB | ⚠️Wenzeslaus | Explanation of binning of points into a 2D raster map where resulting cell value is mean of point values. | 1 |
| 15:19, 19 July 2017 | Binning count explanation.png (file) |  |
54 KB | ⚠️Wenzeslaus | Explanation of binning of points into a 2D raster map. | 1 |
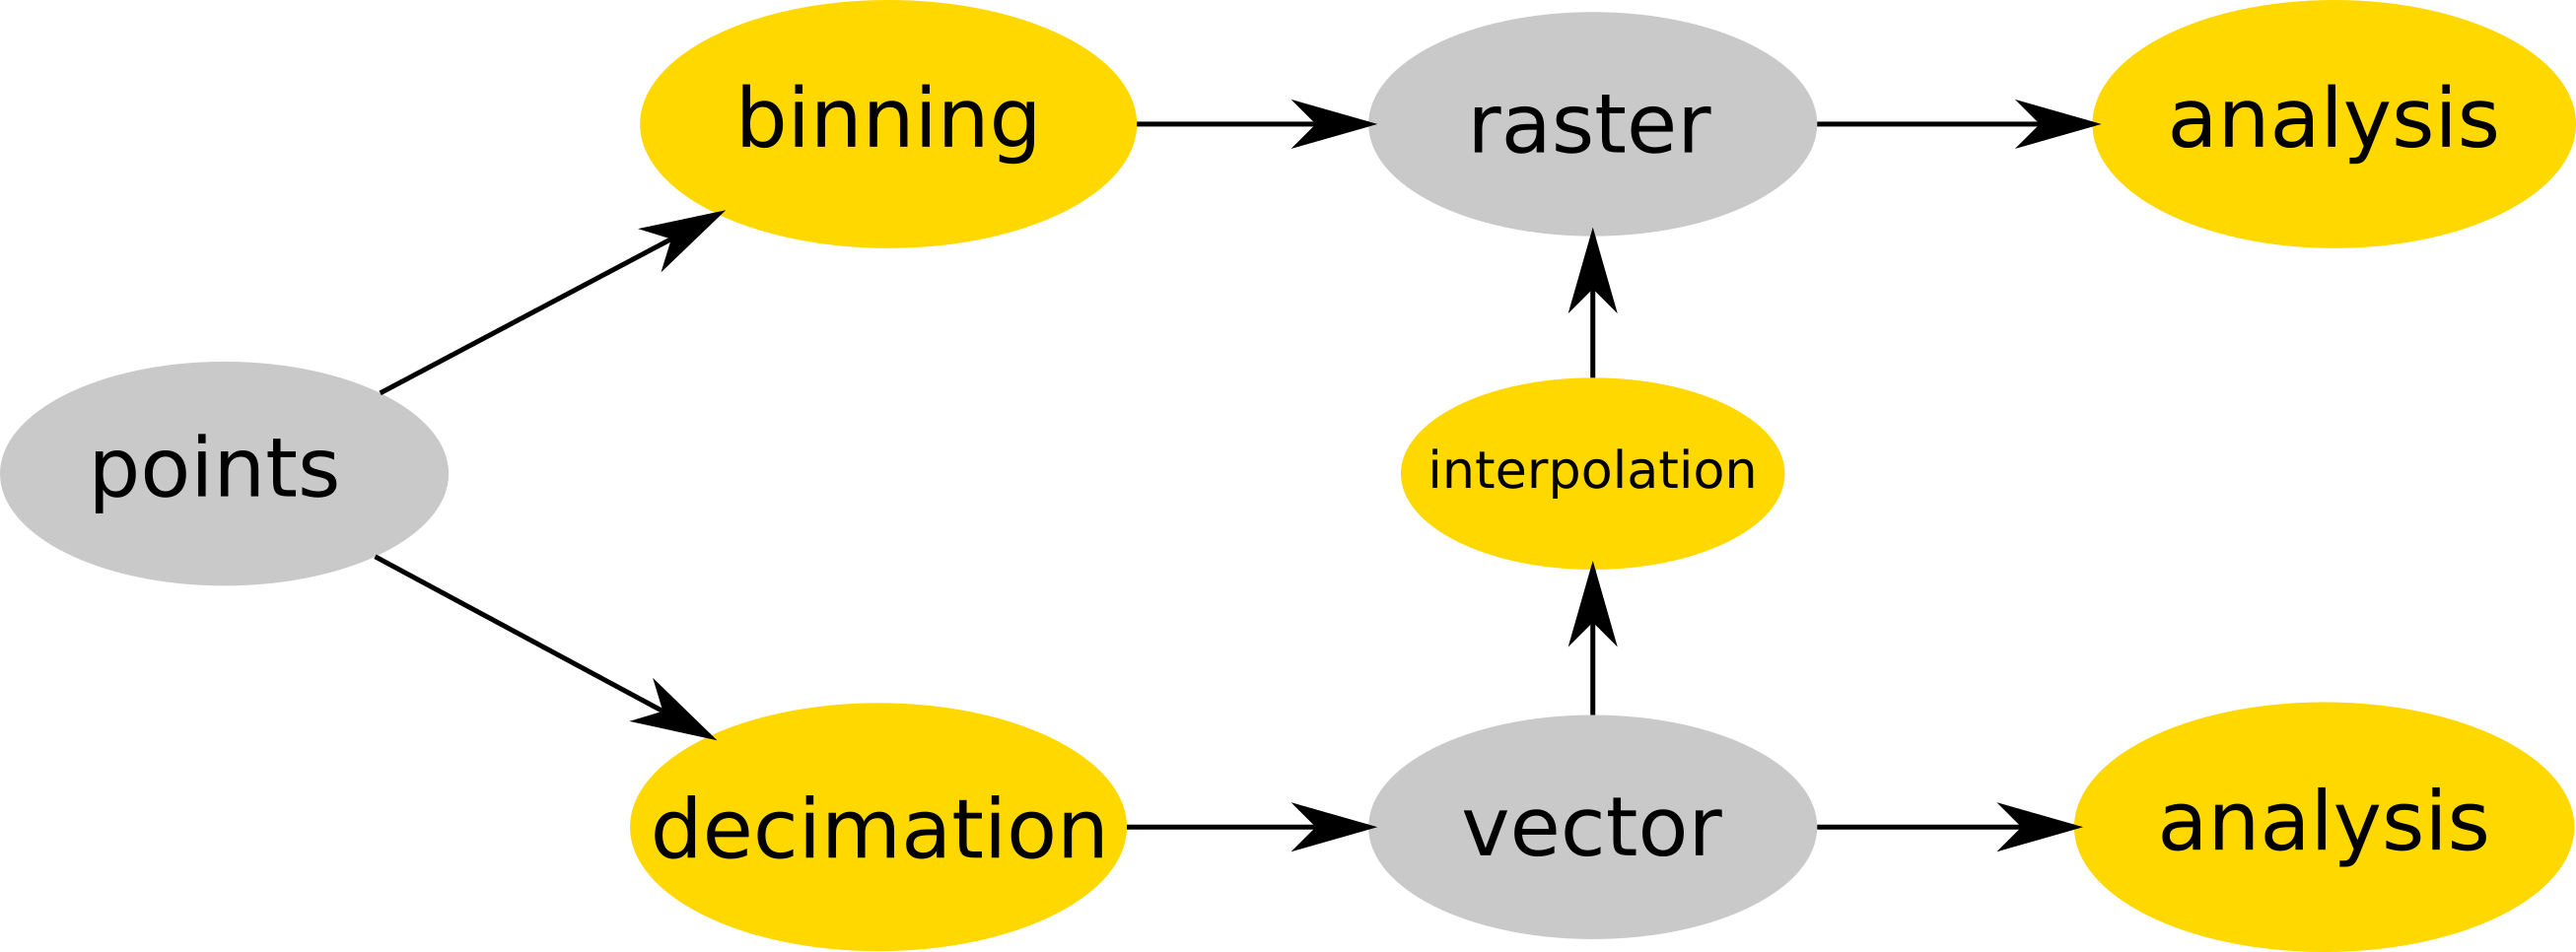
| 15:17, 19 July 2017 | Binning and decimation workflow schema for point clouds.png (file) |  |
127 KB | ⚠️Wenzeslaus | Point cloud is either binned into a raster map (e.g. r.in.lidar) and then analyzed (as raster) or (optionally) decimated (e.g. v.in.lidar), converted to vector map and then interpolated (e.g. v.surf.rst) into raster or analyzed as vector map (e.g. v.ve... | 1 |
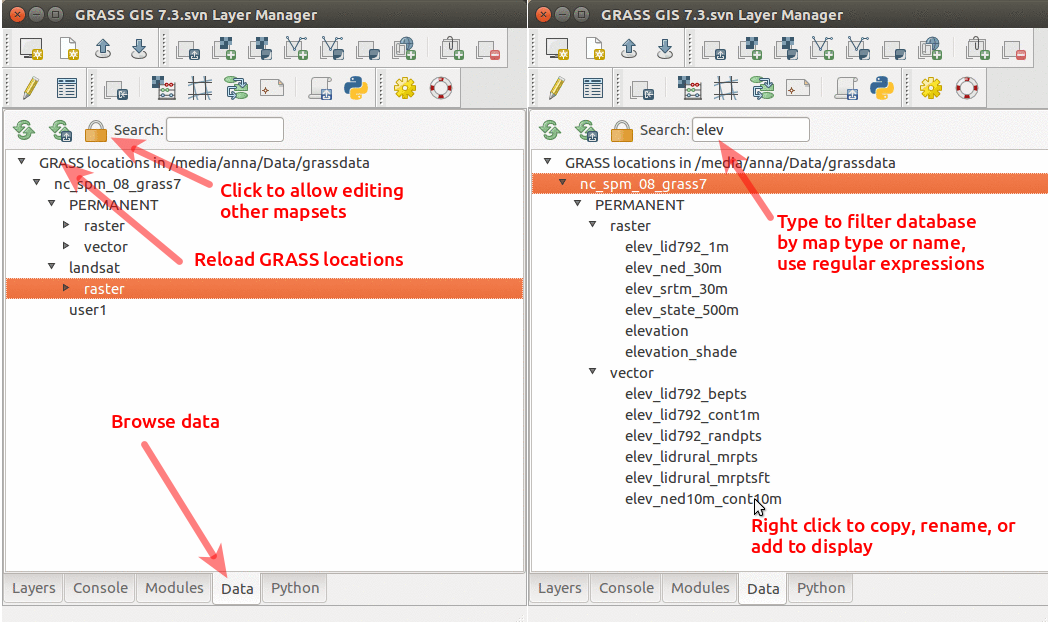
| 01:36, 19 July 2017 | GRASS GIS 7.3 data catalog.png (file) |  |
241 KB | Annakrat | Data catalog in GRASS GIS 7.3 with nc_spm_08_grass7 location | 1 |
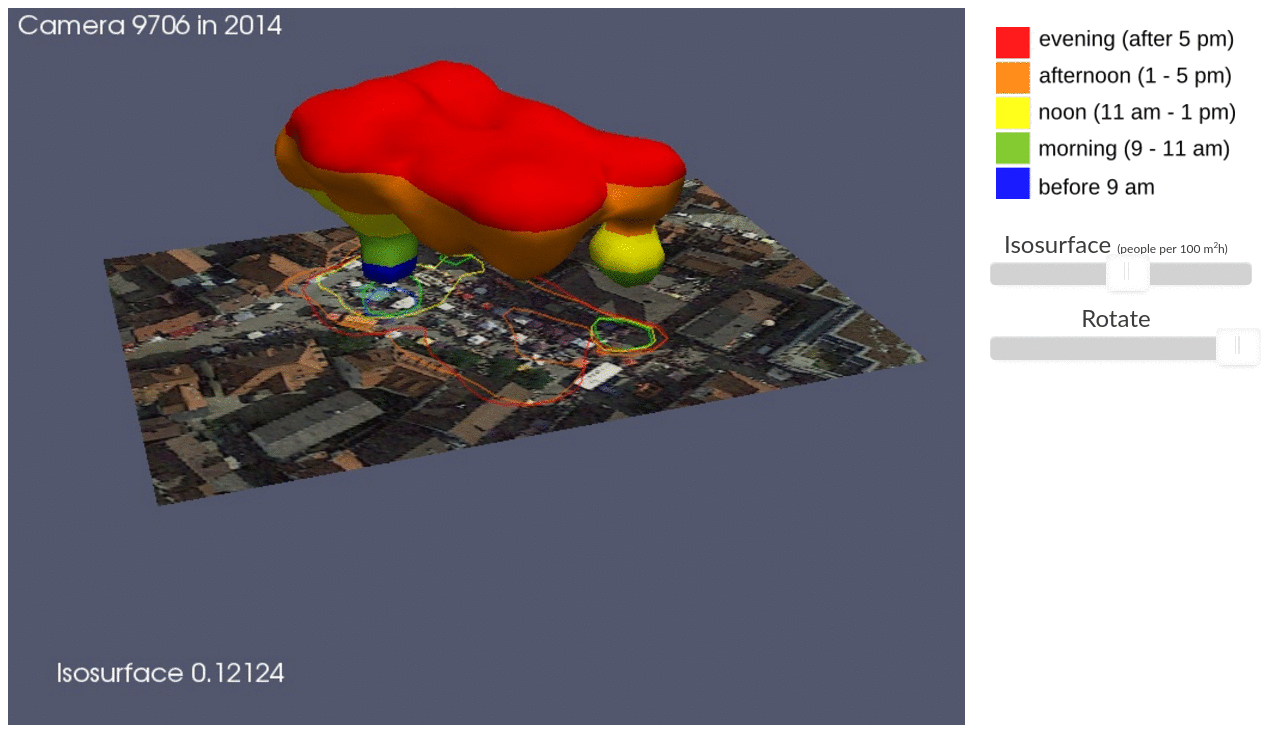
| 01:40, 18 July 2017 | ICC STC illustration.png (file) |  |
468 KB | Annakrat | Presentation on Using space-time cube for visualization and analysis of active transportation patterns derived from public webcams by Anna Petrasova, Aaron Hipp, and Helena Mitasova from North Carolina State University | 1 |
| 21:51, 22 June 2017 | Blender-plain.png (file) |  |
11 KB | Annakrat | Blender logo | 1 |
| 21:00, 22 June 2017 | ICC workshop 3Dview ortho.png (file) |  |
1.45 MB | Annakrat | 3D visulization of digital surface model draped with orthophoto | 1 |
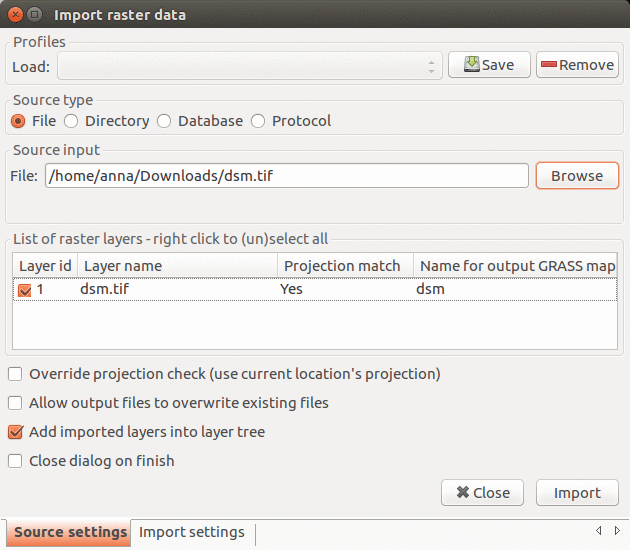
| 14:02, 22 June 2017 | Import raster 7.2.1.png (file) |  |
130 KB | Annakrat | Import raster data dialog in GRASS GIS 7.2.1 | 1 |
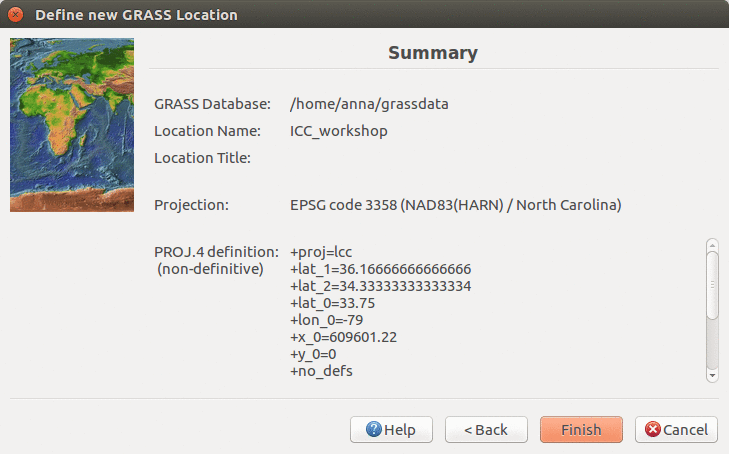
| 03:22, 22 June 2017 | ICC workshop location wizard summary 7.2.png (file) |  |
114 KB | Annakrat | Location Wizard summary page | 1 |
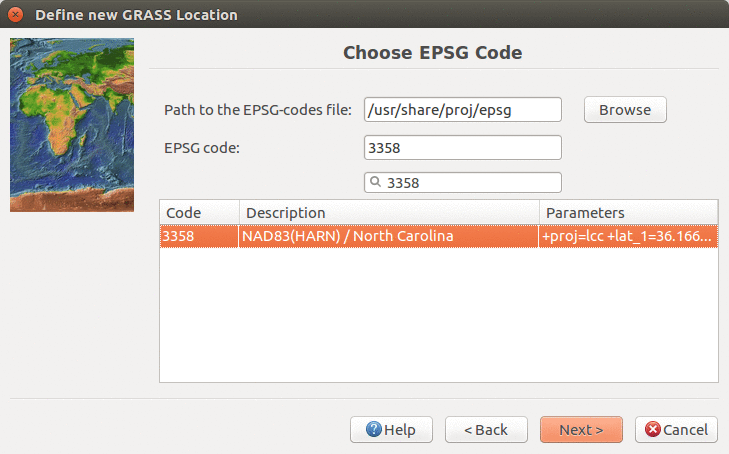
| 03:21, 22 June 2017 | Location wizard EPSG3358 7.2.png (file) |  |
131 KB | Annakrat | Creating new location with EPSG 3358 in Location Wizard | 1 |
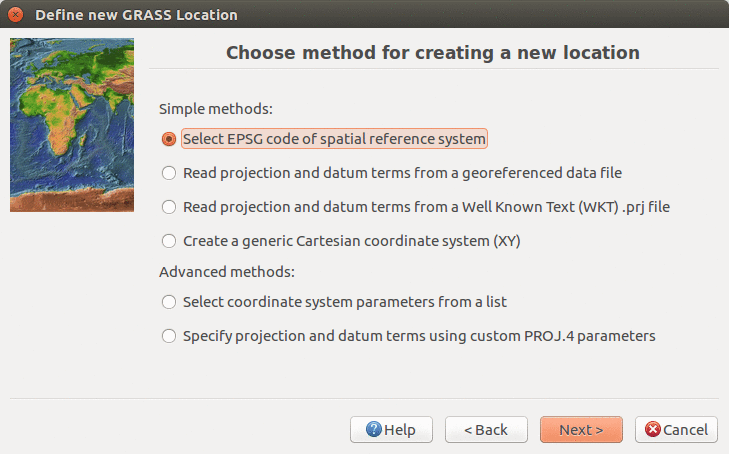
| 03:20, 22 June 2017 | Location wizard method 7.2.png (file) |  |
126 KB | Annakrat | Define CRS in Location Wizard in 7.2. version using EPSG code | 1 |
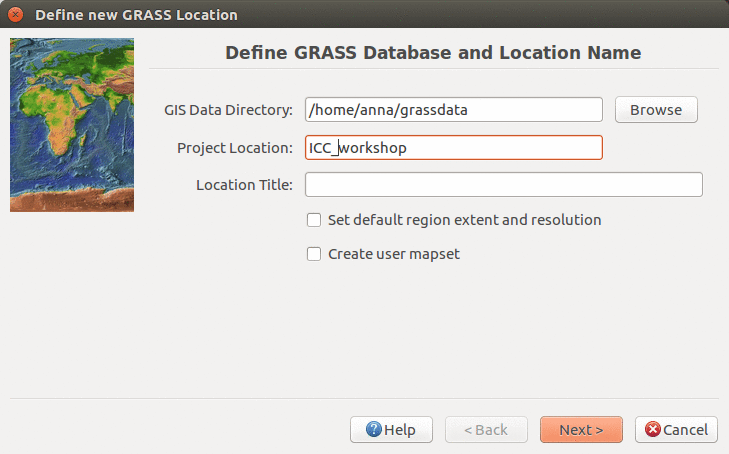
| 03:18, 22 June 2017 | ICC workshop location wizard define 7.2.png (file) |  |
118 KB | Annakrat | Defining new location name in Location Wizard (ICC workshop) | 1 |
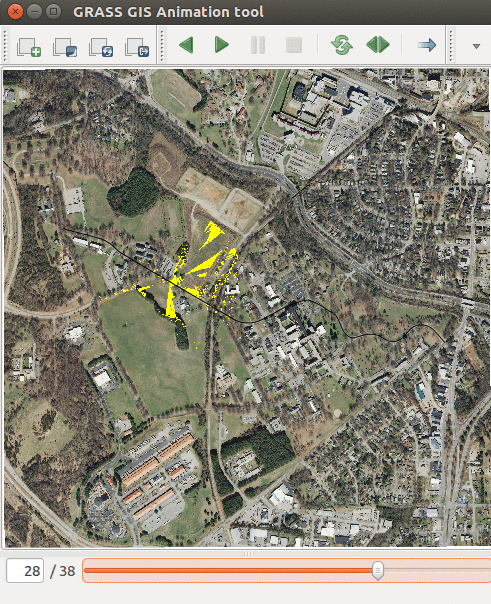
| 21:40, 21 June 2017 | Animation tool viewsheds.png (file) |  |
619 KB | Annakrat | Showing series of viewsheds with Animation Tool | 1 |
| 20:55, 21 June 2017 | Animation tool layers.png (file) |  |
114 KB | Annakrat | How to change order of layers in Animation Tool | 1 |
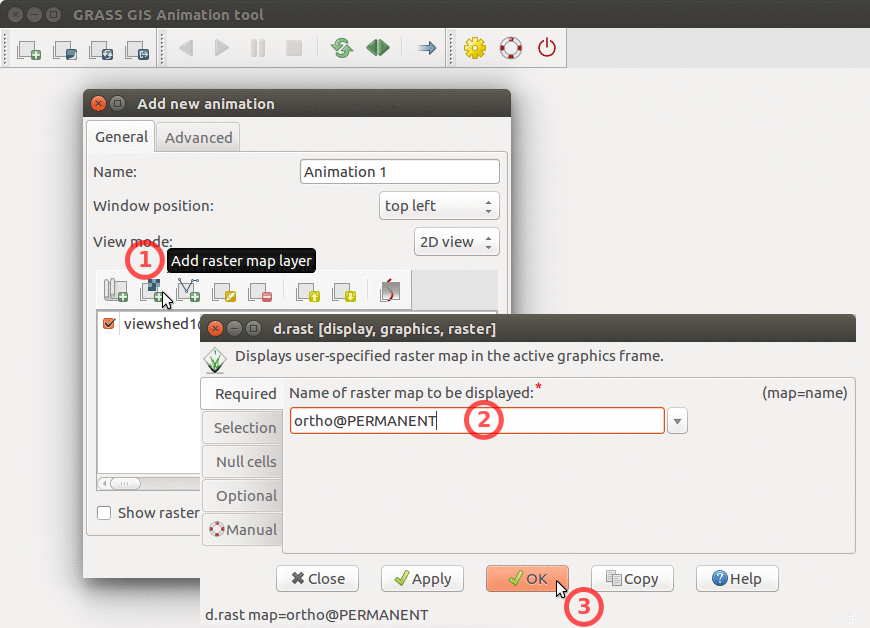
| 20:54, 21 June 2017 | Animation tool add base raster.png (file) |  |
251 KB | Annakrat | How to add base raster to Animation Tool | 1 |
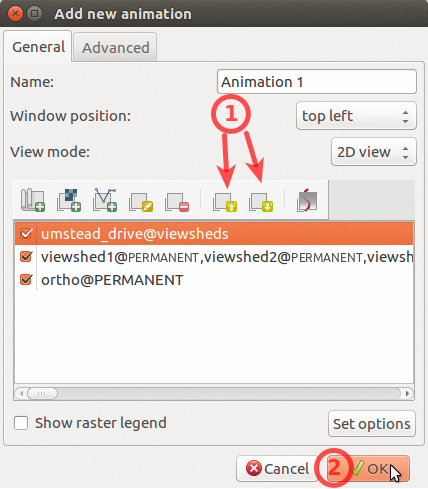
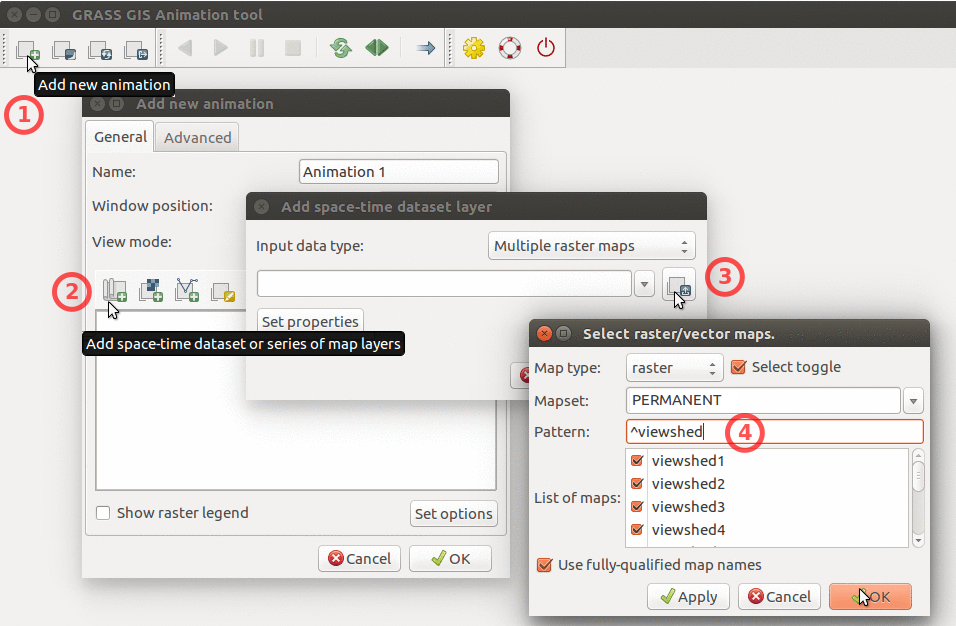
| 20:54, 21 June 2017 | Animation tool add multiple rasters.png (file) |  |
320 KB | Annakrat | How to add multiple raster maps and filter them by name. | 1 |
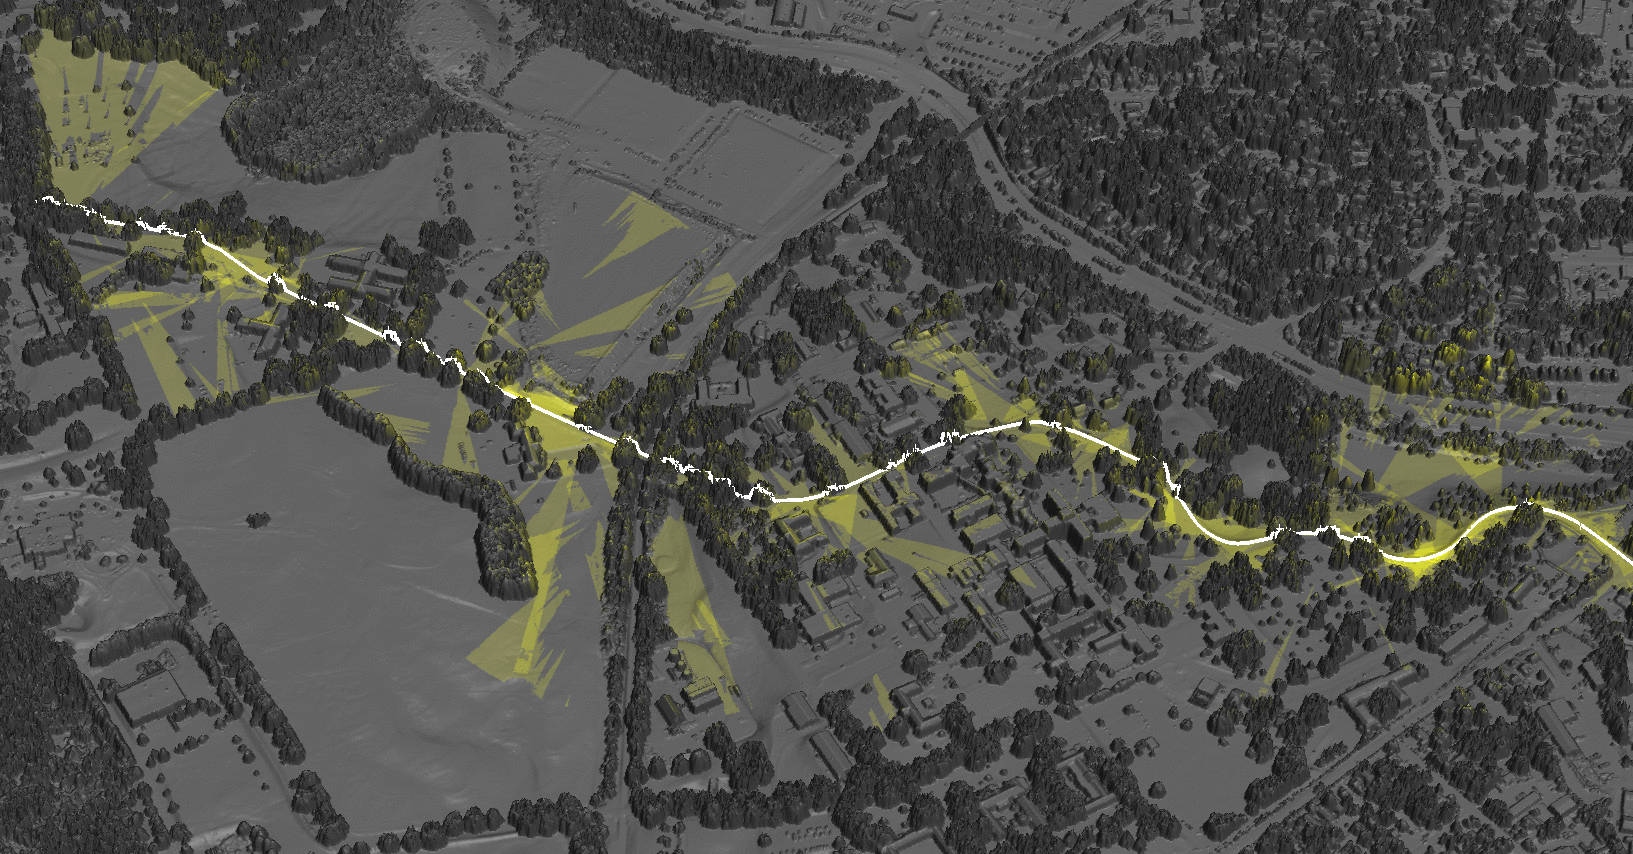
| 19:27, 21 June 2017 | Cumulative viewshed.png (file) |  |
1.34 MB | Annakrat | Cumulative viewshed computed from views along a road. | 1 |
| 09:47, 12 June 2017 | FOSS4G-Europe-2017.png (file) |  |
386 KB | Lucadelu | 1 | |
| 15:14, 2 June 2017 | Icc2017 logo.png (file) | 64 KB | ⚠️Wenzeslaus | Logo of the 28th International Cartographic Conference of the International Cartographic Association, Washington, DC, July 2 to 7, 2017 http://icc2017.org/ http://icc2017.org/wp-content/uploads/2016/08/logo.png | 1 | |
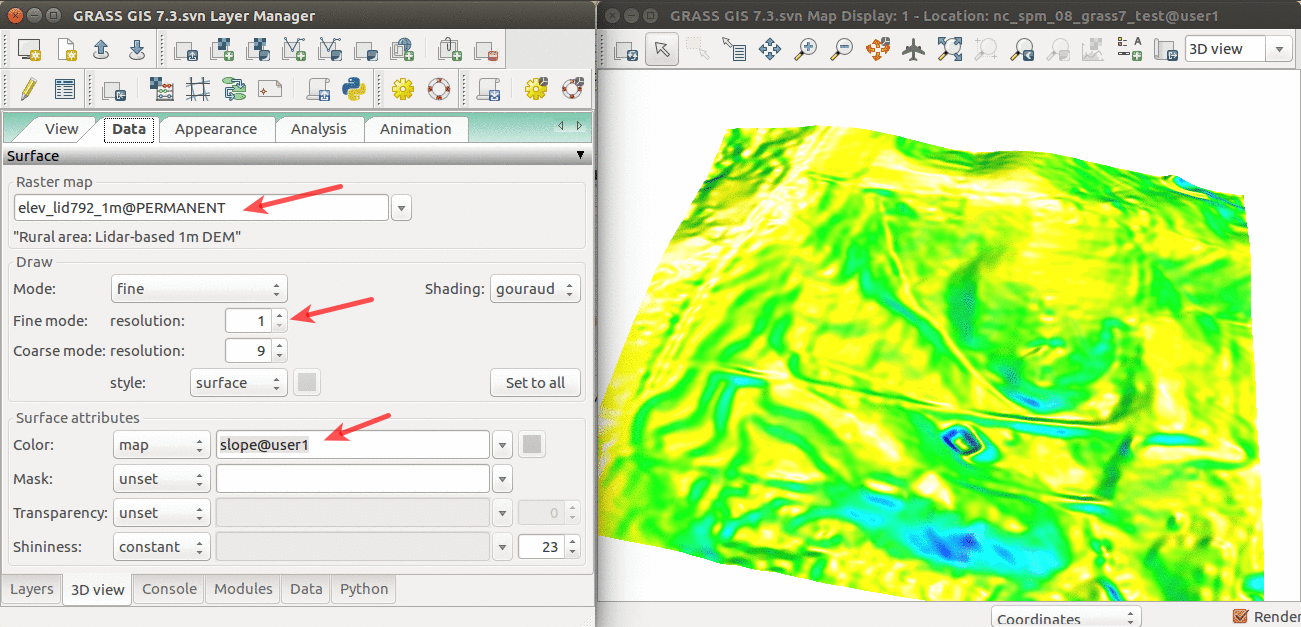
| 14:48, 11 April 2017 | Elevation slope 3D view.png (file) |  |
565 KB | Annakrat | 3D visualization of elev_lid792_1m DEM with slope draped over. | 1 |
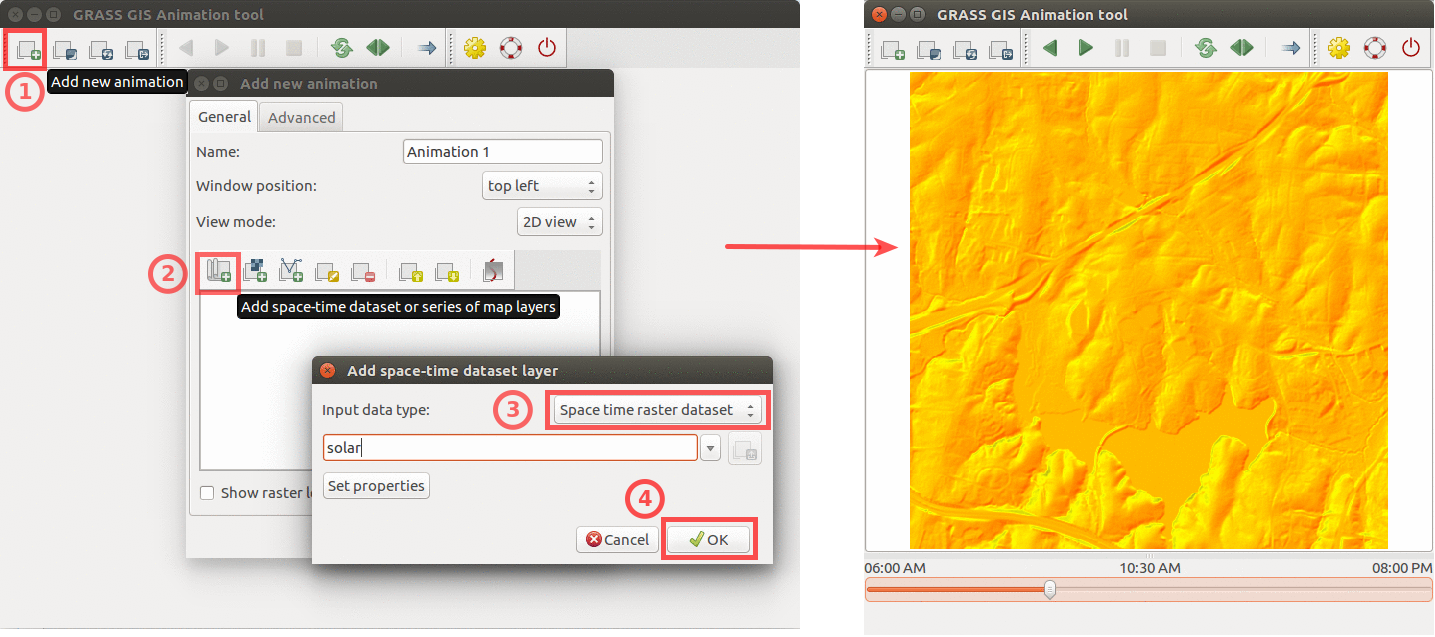
| 22:15, 9 April 2017 | Animation solar example.png (file) |  |
439 KB | Annakrat | Using GRASS GIS animation tool to animate solar irradiance during a day. Computed by {{addonCmd|r.sun.hourly}}. | 1 |
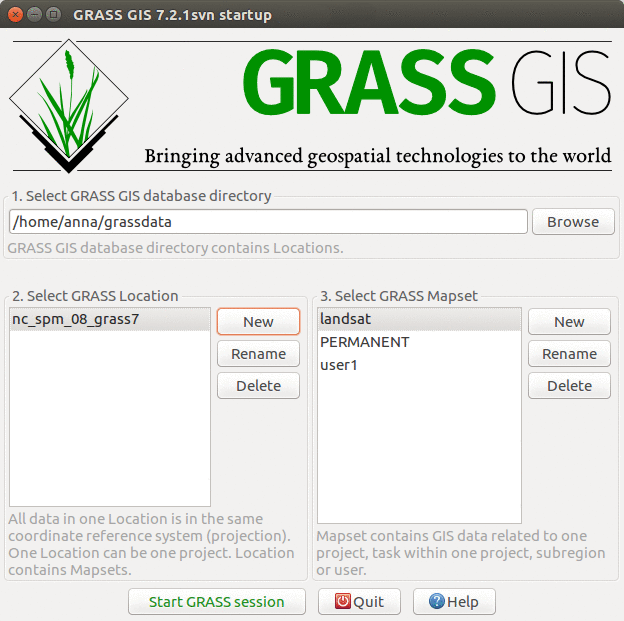
| 15:29, 5 April 2017 | GRASS startup ncspm.png (file) |  |
150 KB | Annakrat | GRASS GIS 7.2 startup screen with North Carolina sample dataset | 1 |
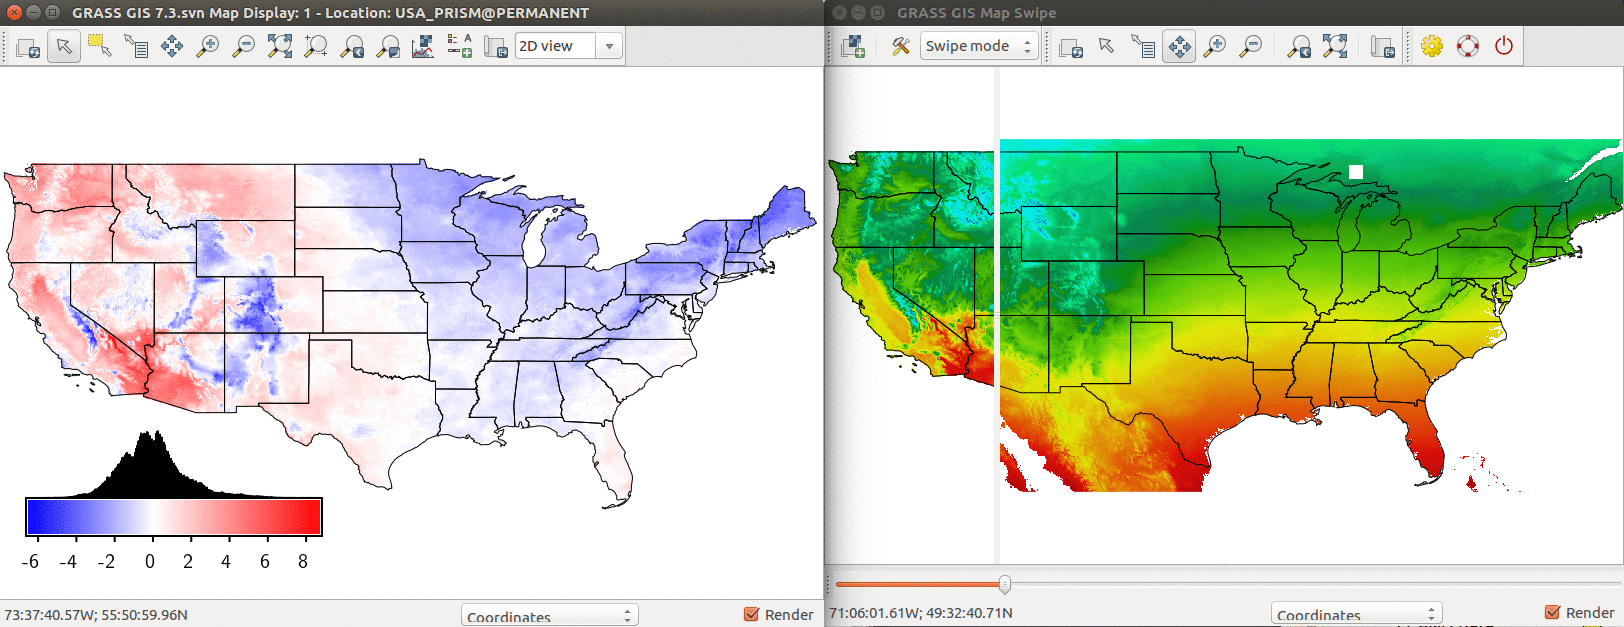
| 20:03, 4 April 2017 | US temp model comparison.png (file) |  |
529 KB | Annakrat | Comparison of PRISM annual mean temperature and modeled temperature based on latitude and elevation. Left: Difference between modeled and real temperature in degree Celsius. Right: Using Map Swipe to visually assess the model (modeled temperature on th... | 1 |
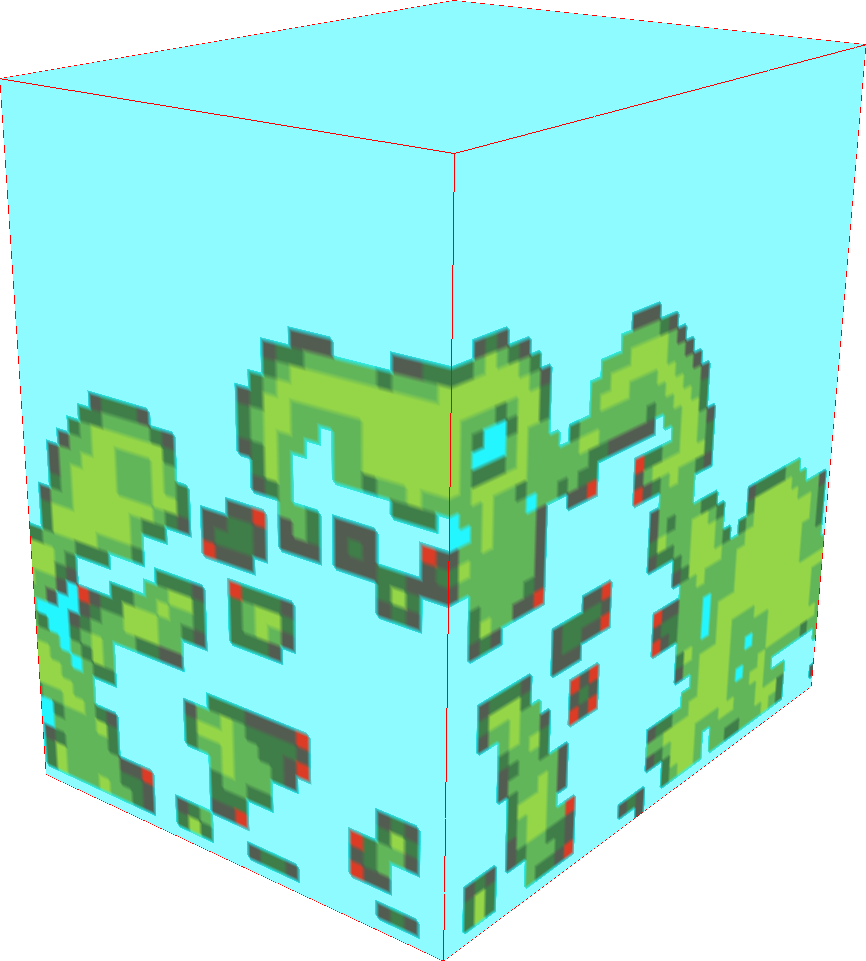
| 21:05, 24 March 2017 | Raster3d example small data.png (file) |  |
147 KB | ⚠️Wenzeslaus | Example of a 3D raster. Small data. Lidar-based presence/absence in 3D. r3.forestfrag. Using slices in 3D view (NVIZ). Modified colors. | 1 |
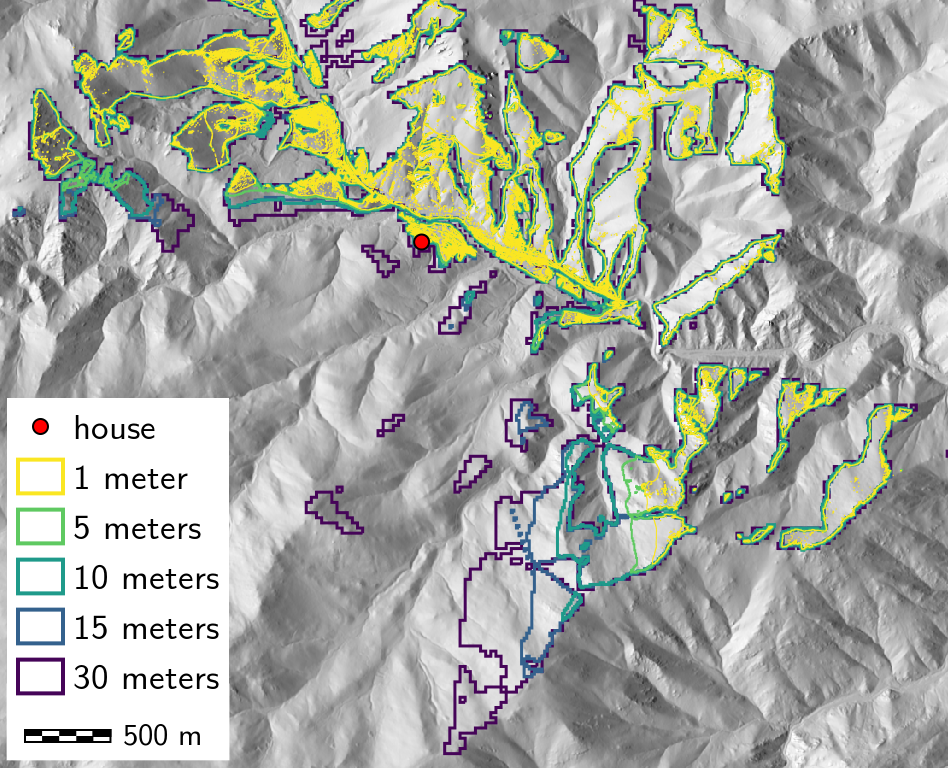
| 20:53, 24 March 2017 | Viewscape modeling with LiDAR.png (file) |  |
783 KB | ⚠️Wenzeslaus | Not seeing the forest for the trees: viewscape modeling with LiDAR by Jelena Vukomanovic (presenter), John B. Vogler, Kunwar K. Singh, and Anna Petrasova from North Carolina State University US-IALE 2017 Annual Meeting | 1 |
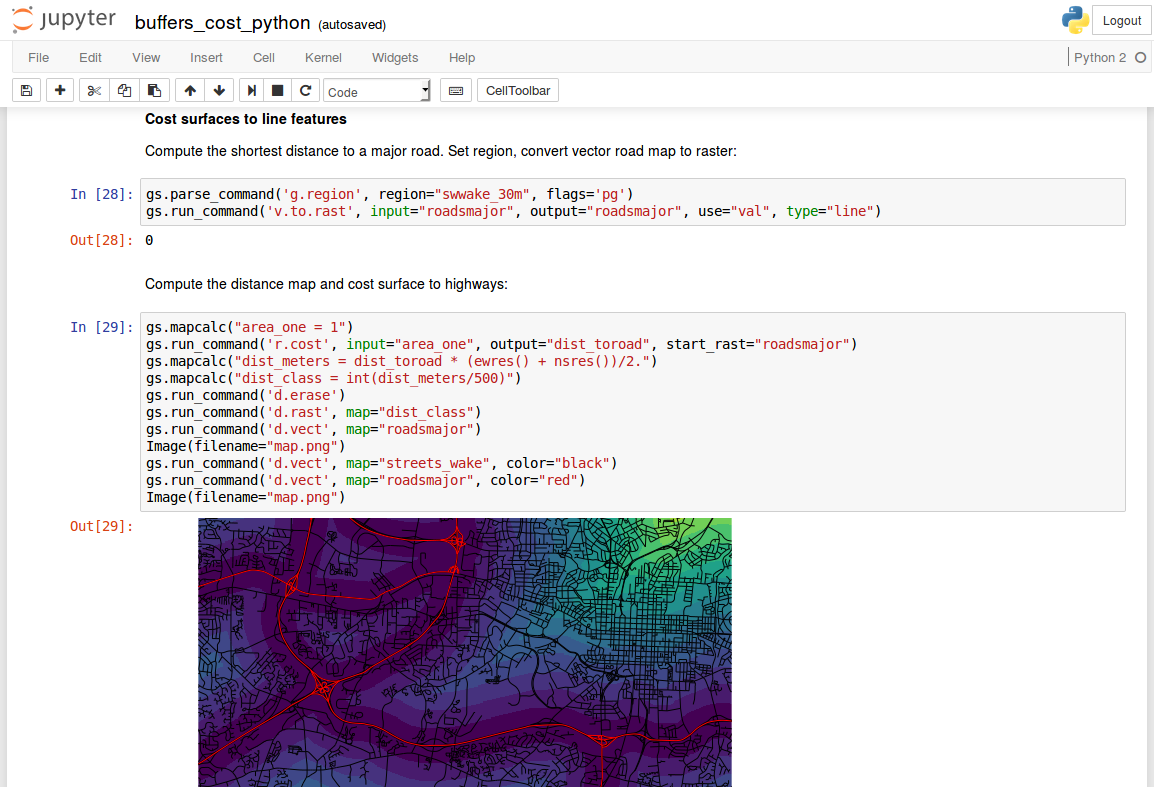
| 20:44, 24 March 2017 | Jupyter notebook with grass gis.png (file) |  |
221 KB | ⚠️Wenzeslaus | Jupyter Notebook with GRASS GIS Python code computing distance (with r.cost) from lines (roads) | 1 |
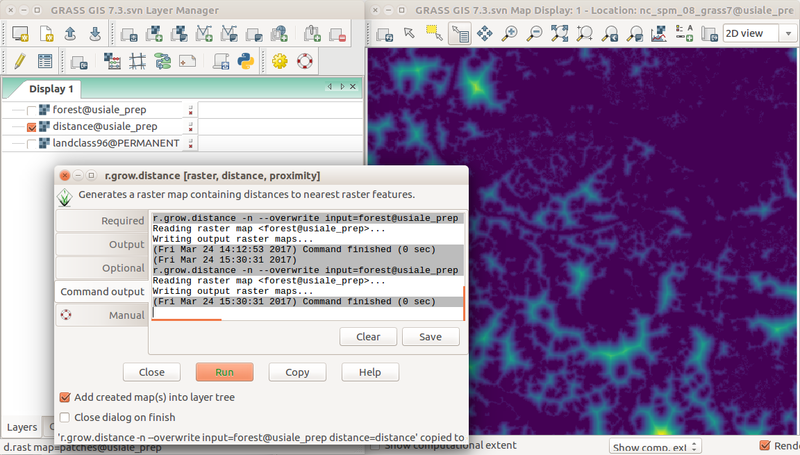
| 19:40, 24 March 2017 | Wxgui r grow distance from forest edge.png (file) |  |
318 KB | ⚠️Wenzeslaus | Screenshot of distance to forest edge computed with r.grow.distance in the wxGUI with Layer Manager, Map Display, and r.grow.distance dialog. r.mapcalc "forest = if(landclass96 == 5, 1, null())" r.grow.distance -n input=forest distance=distance (or... | 1 |
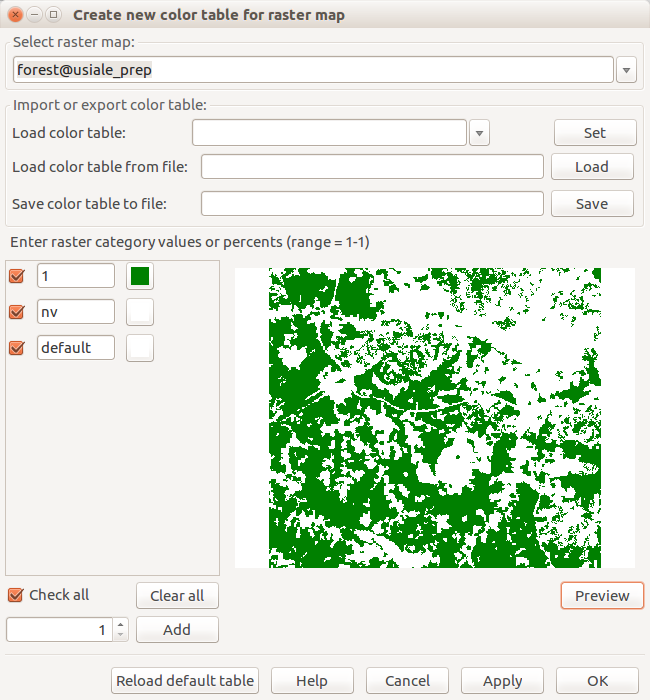
| 19:23, 24 March 2017 | Create new color table for raster map forest.png (file) |  |
53 KB | ⚠️Wenzeslaus | Dialog for interactive change of color table with preview r.mapcalc "forest = if(landclass96 == 5, 1, null())" | 1 |
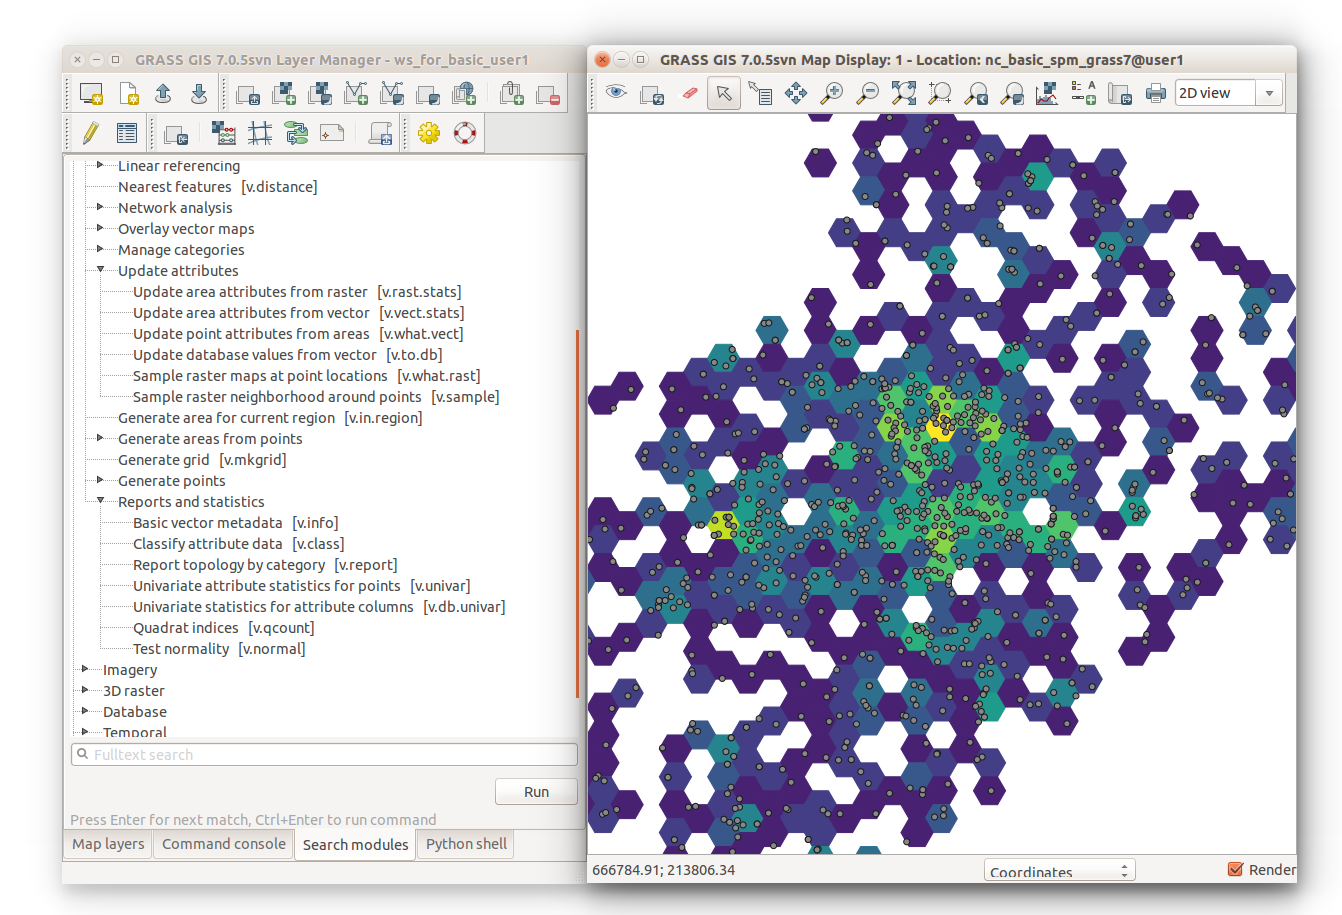
| 16:58, 24 March 2017 | V vect stats hexagons with module tree.png (file) |  |
386 KB | ⚠️Wenzeslaus | v.vect.stats result on v.mkgrid -h polygons showing point density with Layer Manager Modules tab on the left g.region vector=points_of_interest res=2000 -pa v.mkgrid map=hexagons -h v.vect.stats points=points_of_interest areas=hexagons count_column... | 1 |
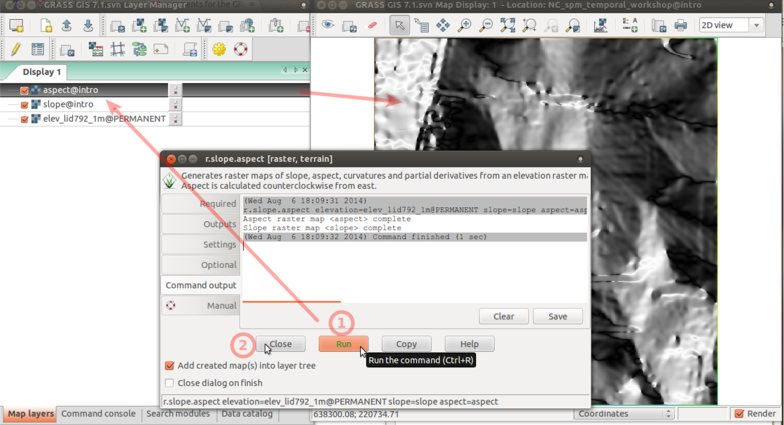
| 15:17, 24 March 2017 | R slope aspect 4 run.png (file) |  |
211 KB | ⚠️Wenzeslaus | r.slope.aspect Command output tab with Run, Close, and resulting raster map layer in the background | 1 |
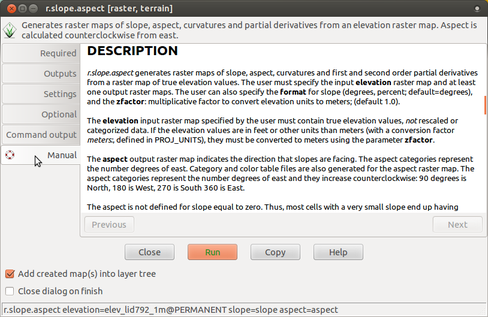
| 15:16, 24 March 2017 | R slope aspect 3 manual.png (file) |  |
130 KB | ⚠️Wenzeslaus | r.slope.aspect Manual tab | 1 |
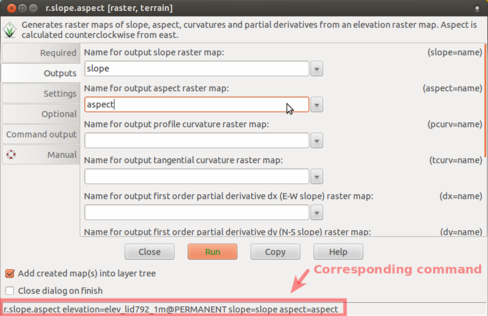
| 15:14, 24 March 2017 | R slope aspect 2 outputs.png (file) |  |
77 KB | ⚠️Wenzeslaus | r.slope.aspect Outputs tab (slope and aspect outputs) with corresponding command highlighted | 1 |
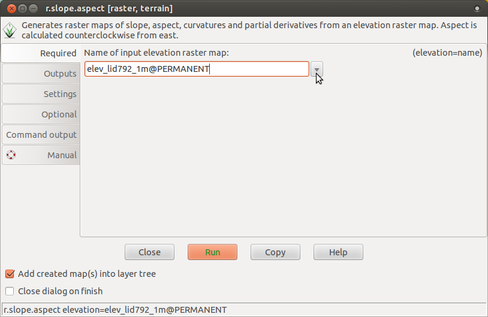
| 15:13, 24 March 2017 | R slope aspect 1 required.png (file) |  |
57 KB | ⚠️Wenzeslaus | r.slope.aspect Required tab (input elevation) | 1 |
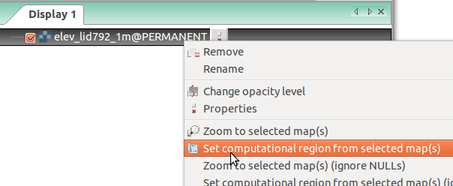
| 13:53, 24 March 2017 | Wxgui computational region set from raster.png (file) |  |
39 KB | ⚠️Wenzeslaus | Setting computational region (extent and resolution) based on a raster in Layer Manager in wxGUI (GRASS GIS 7.0) | 1 |
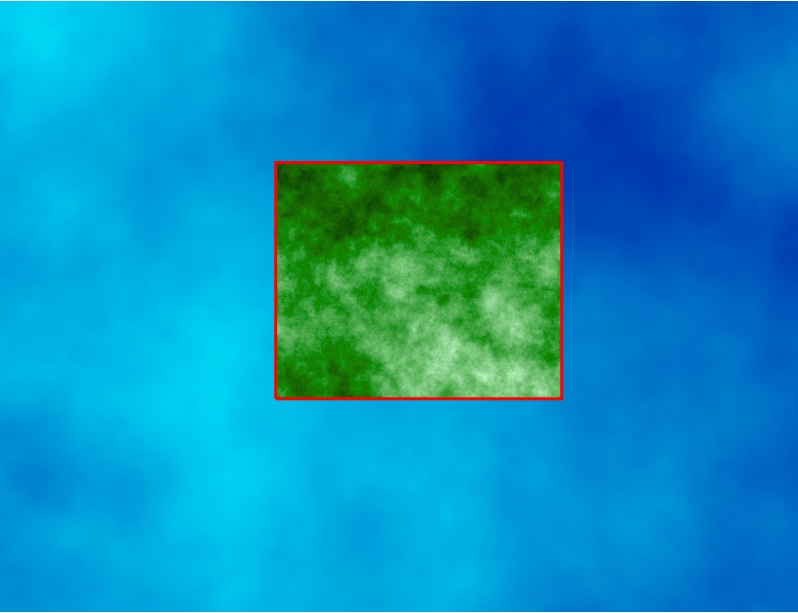
| 13:40, 24 March 2017 | Computational region two rasters.png (file) |  |
250 KB | ⚠️Wenzeslaus | Computational region concept showing one large raster (blue) and one other raster with smaller extent (green) which matches the current computational region (red). # larger region g.region raster=elevation # larger raster r.surf.fractal output=fra... | 1 |
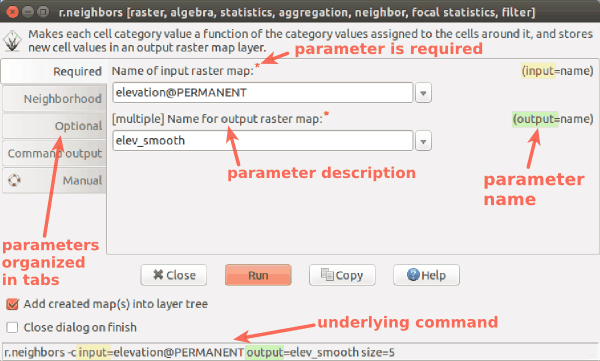
| 03:46, 24 March 2017 | Wxgui module parameters r neighbors.png (file) |  |
25 KB | ⚠️Wenzeslaus | wxGUI dialog/form for r.neighbors with descriptions and highlights | 1 |
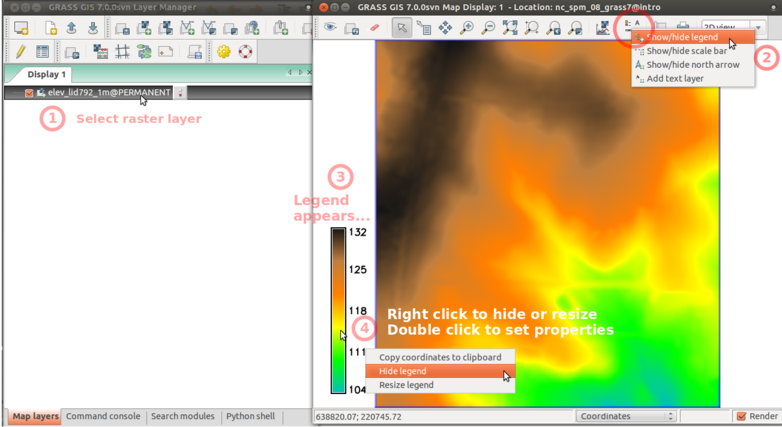
| 02:36, 24 March 2017 | Wxgui add legend elev lid.png (file) |  |
174 KB | ⚠️Wenzeslaus | Add raster legend in wxGUI screenshot with numbers and descriptions | 1 |
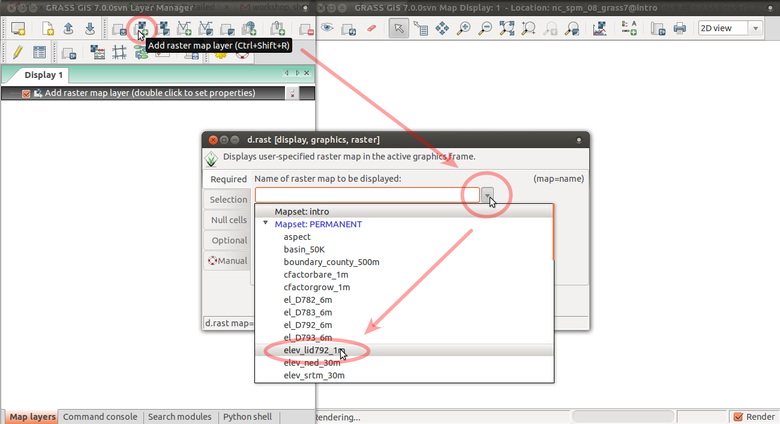
| 02:12, 24 March 2017 | Wxgui add elev lid.png (file) |  |
125 KB | ⚠️Wenzeslaus | Add elev_lid792_1m raster map layer using d.rast dialog from toolbar with arrows | 1 |
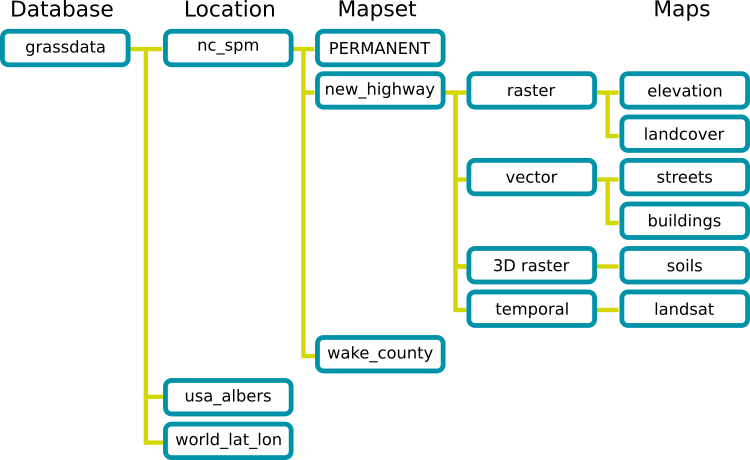
| 01:22, 24 March 2017 | Grass database.png (file) |  |
36 KB | ⚠️Wenzeslaus | GRASS GIS Spatial Database structure trunk/doc/grass_database.png r70793 | 1 |
| 01:59, 23 March 2017 | Grassgis logo colorlogo text whitebg.png (file) | 48 KB | ⚠️Wenzeslaus | GRASS GIS logo from https://grass.osgeo.org/download/logos/ Green color, white background, with text | 1 | |
| 01:06, 8 March 2017 | Ncgis logo 2017.png (file) | 4 KB | ⚠️Wenzeslaus | NCGIS conference 2017 logo http://ncgisconference.com/ | 1 | |
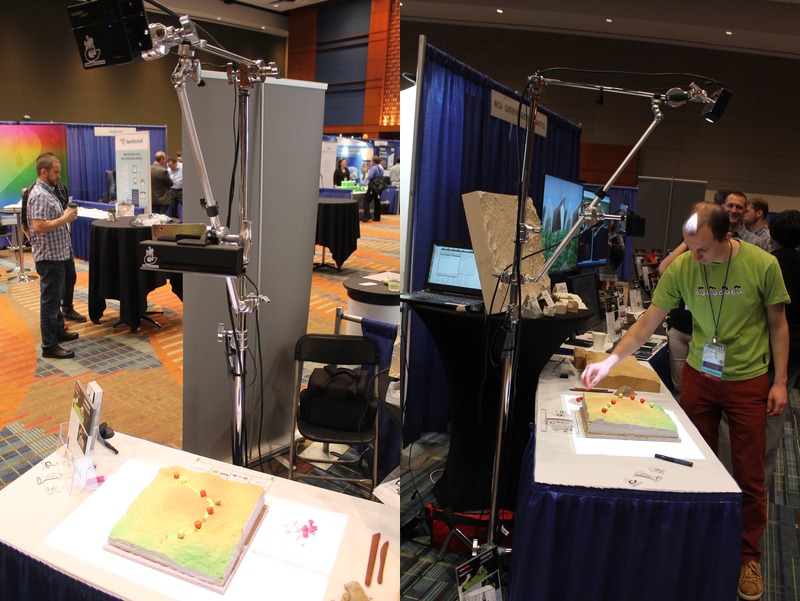
| 01:04, 8 March 2017 | Ncgis2017 ncsu booth tangible landscape.jpg (file) |  |
136 KB | ⚠️Wenzeslaus | North Carolina State University booth at NCGIS2017: Tangible Landscape (powered by GRASS GIS) Thanks to Anna Klevtcova for providing the photographs. | 1 |
| 21:22, 7 March 2017 | Us-iale logo.jpg (file) | 30 KB | ⚠️Wenzeslaus | http://baltimore2017.usiale.org/ https://usiale.org/ | 1 | |
| 20:49, 7 March 2017 | Foss4g boston 2017 logo.png (file) | 25 KB | ⚠️Wenzeslaus | http://2017.foss4g.org/ | 1 | |
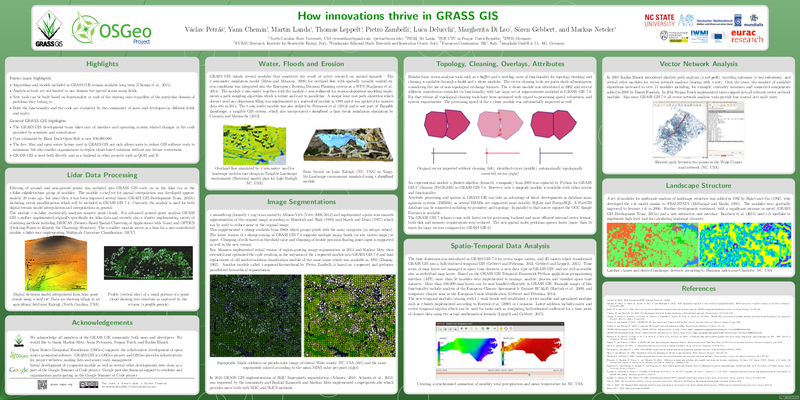
| 01:25, 26 February 2017 | How innovations thrive in GRASS GIS.png (file) |  |
331 KB | ⚠️Wenzeslaus | Capture from https://trac.osgeo.org/grass/browser/grass-promo/grassposter/2017_NCGIS_How_innovations_thrive/How_innovations_thrive_in_GRASS_GIS.pdf (provided by the author) | 1 |
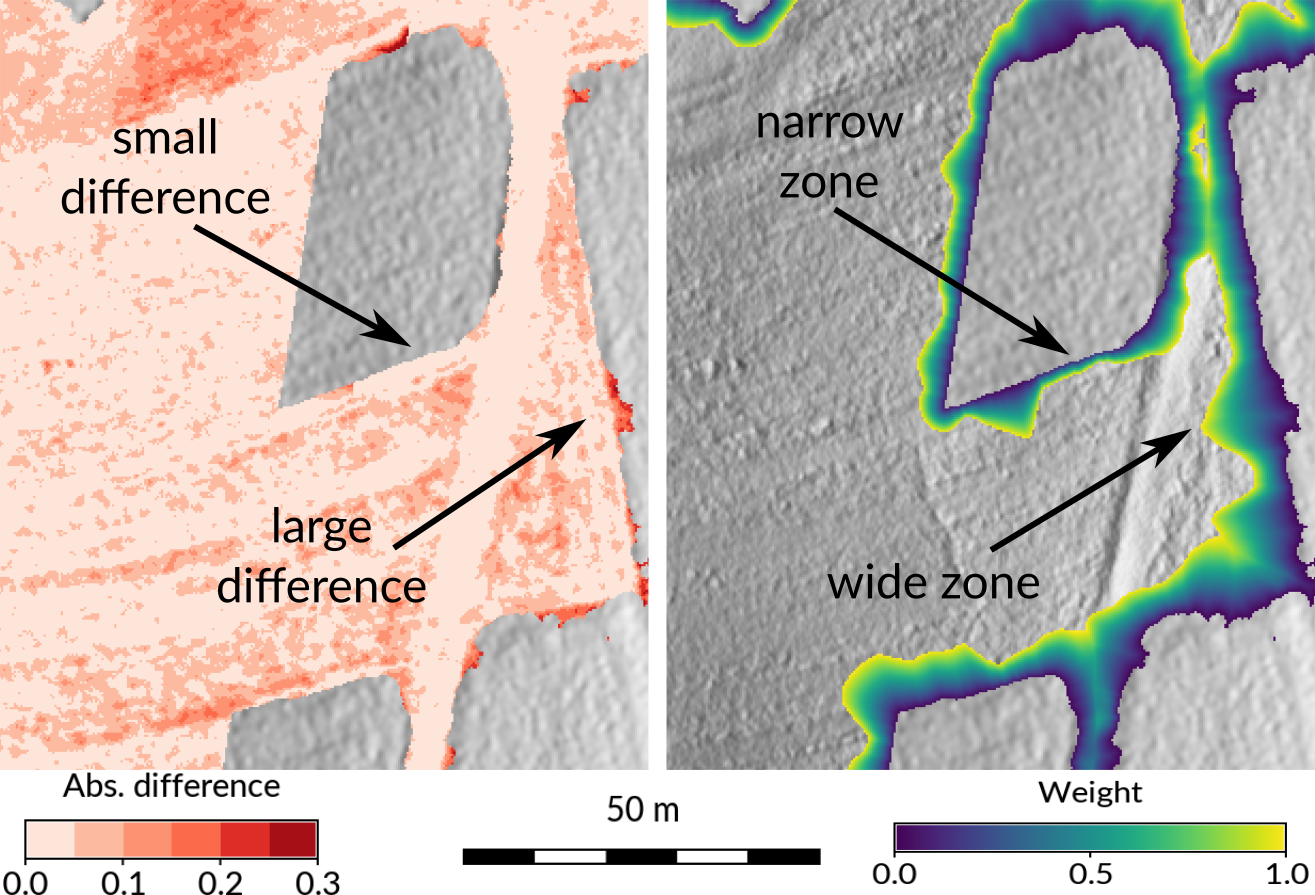
| 00:06, 26 February 2017 | Seamless fusion of high-resolution DEMs from multiple sources.png (file) |  |
718 KB | ⚠️Wenzeslaus | Taken from https://petrasovaa.github.io/dem-fusion-talk/#/17 (provided by the author) | 1 |