GRASS 6 Tutorial/Displaying spatial data: Difference between revisions
| Line 22: | Line 22: | ||
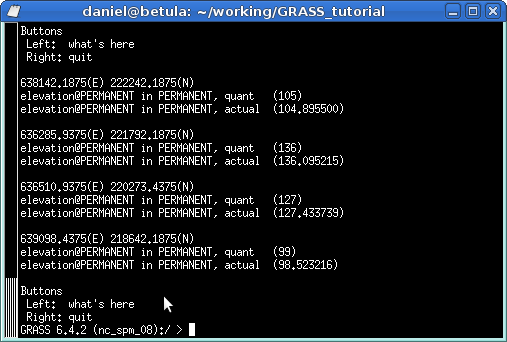
If you want to retrieve the pixel values at a certain x,y location, you should use the <code>d.what.rast</code> command, which will change the pointer in the display window to a cross-hair. With the mouse, you click on the location(s) of interest and the raster values are printed in the terminal window. | If you want to retrieve the pixel values at a certain x,y location, you should use the <code>d.what.rast</code> command, which will change the pointer in the display window to a cross-hair. With the mouse, you click on the location(s) of interest and the raster values are printed in the terminal window. | ||
[[File:Dmon_elevation.png|center|300px]][[File:Dwhatrast.png| | [[File:Dmon_elevation.png|center|300px]][[File:Dwhatrast.png|right|300px]] | ||
===Plotting an elevation profile=== | ===Plotting an elevation profile=== | ||
Revision as of 21:42, 31 July 2013
Displaying spatial data with GRASS
This section of the tutorial explains how to display raster and vector data using GRASS GIS. We focus on two approaches: one approach uses the CLI and the d.mon display monitors, while the other shows you how to use the GRASS wxGUI. This reader is redirected to the Quick wxGUI tutorial for more information on this topic.
Displaying from the wxGUI
Displaying raster data from the CLI
In some situations, you might find the CLI a quick alternative to display your vector data. You need to start a display monitor as follows:
d.mon start=x0
Depending on your region settings, you may want to set the region to the full extent of your raster map:
g.region rast=elevation
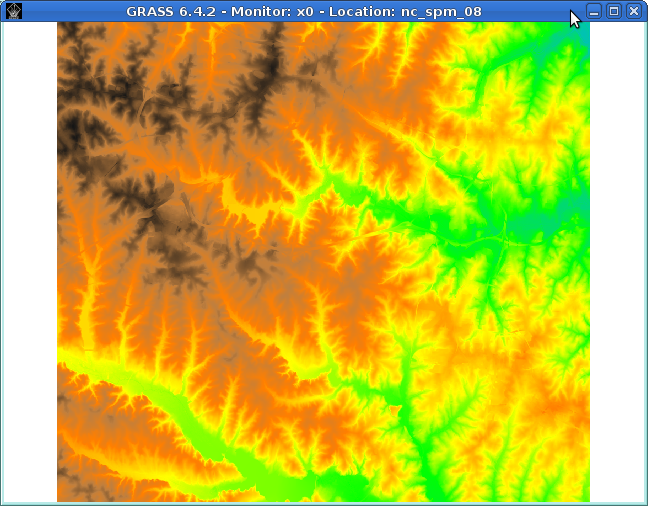
Then you simply launch the d.rast command to display the map.
d.rast elevation
To have more control over the display settings for the raster, check the additional options by d.rast --help. You can navigate within the display monitor using a combination of d.pan and d.zoom in conjunction with the mouse buttons.
If you want to retrieve the pixel values at a certain x,y location, you should use the d.what.rast command, which will change the pointer in the display window to a cross-hair. With the mouse, you click on the location(s) of interest and the raster values are printed in the terminal window.


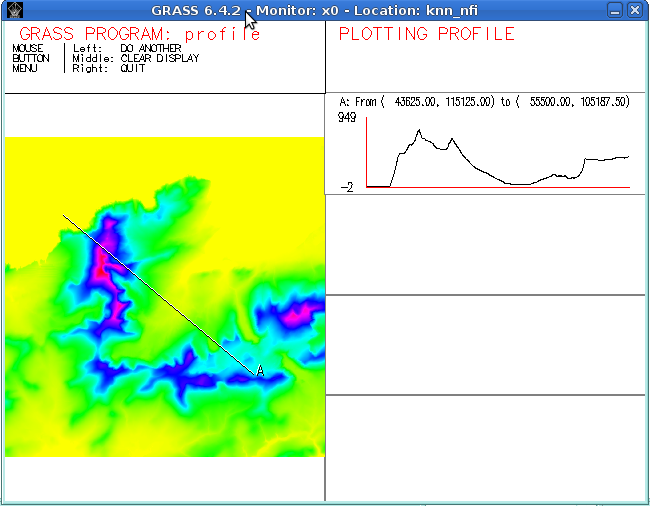
Plotting an elevation profile
Plotting an elevation profile between two points is done by running d.profile:
