Introduction to GRASS GIS with terrain analysis examples
This exercise was initially created as a session in the Advanced GIS training for the U. S. Fish and Wildlife Service (CSP7300) in June, 2015 by Doug Newcomb and updated September 2015 with input from Paul Lang for dune extraction.
Session Objectives
At the conclusion of this session, you will be able to:
- Open GRASS GIS and Create a Location from an existing file
- Link external raster elevation data to the Location
- Install r.geomorphon addon
- Create geomorphon layer from dem layer
- Export raster data layer from GRASS to GeoTiff
Material Created By: Doug Newcomb (June 2015)
Revision: Doug Newcomb (March 2016)
Software: GRASS 7.0
Directory Path: D:\CSP7300_Terrain (assumed at some places, use any directory you want)
Imagery: pen_1m_elevation.tif, island_mask.tif
Data can be accessed online here
Elevation data is commonly used in landscape analysis. The geomorphon addon in GRASS GIS can analyse an elevation raster and classify the surface into common landforms. All data are located in D:\CSP7300_Terrain, unless otherwise noted.
Step 1: Creating GRASS Location
The first thing to do when starting to work in GRASS is to create a Location. GRASS Locations are single projection areas with a defined resolution and extent. The initial location can be easily created from an existing data set.
- In Windows, Click on Start-->All Programs-->GRASS GIS 7.0--> GRASS GIS 7.0 GUI
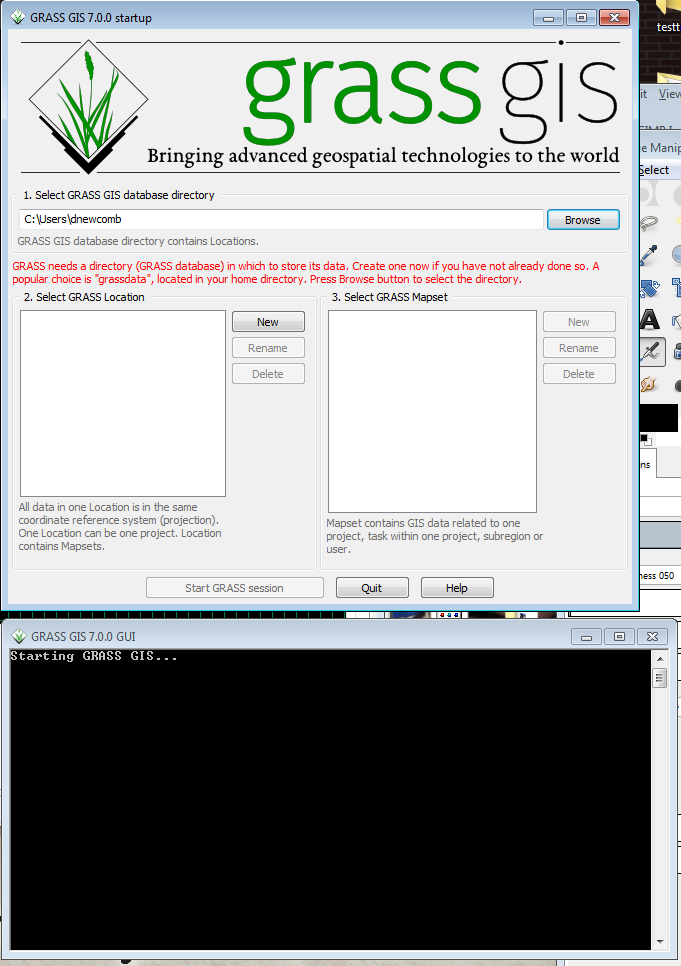
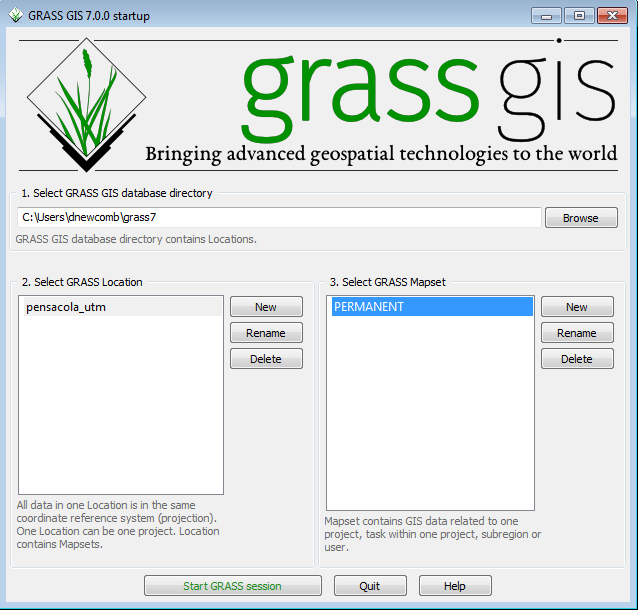
Two windows will open, the GRASS startup window (to select or create a workspace) and the GRASS command prompt.
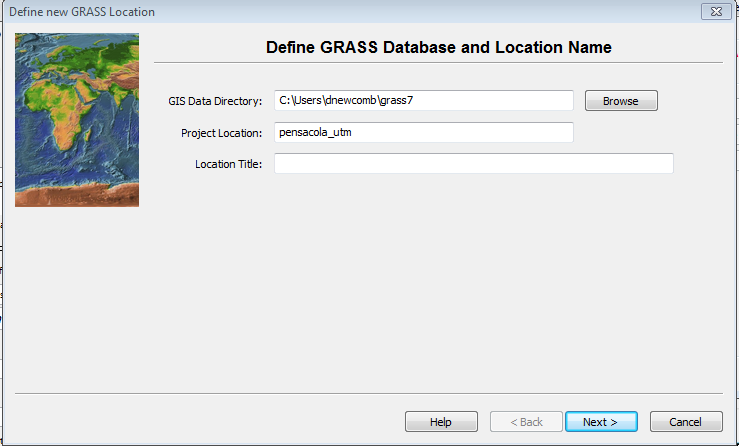
- Click on the New button between the Location and Mapset windows. This will bring up the menu to define a new Location.
The GIS Data Directory is where all of your GRASS Locations will reside. Creating a new directory with a unique name for GRASS data is recommended. This directory can be created anywhere that the user has write access. Project location is a subdirectory name for this particular project. Like with ArcGIS, it is best to aviod spaces in Directory names to avoid problems down the road. The data is from the Pensacola,FL and is in a UTM projection, so call it pensacola_utm
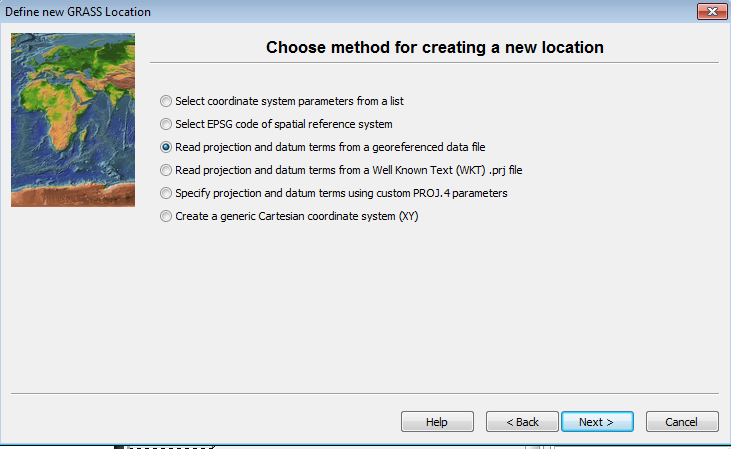
- Enter the Data Directory and Project Location and click Next – this brings up the location creation method menu.
- Click on the radio button for Read projection and datum terms from a georeferenced file.
- Click Next
This brings up the georeferenced file dialog.
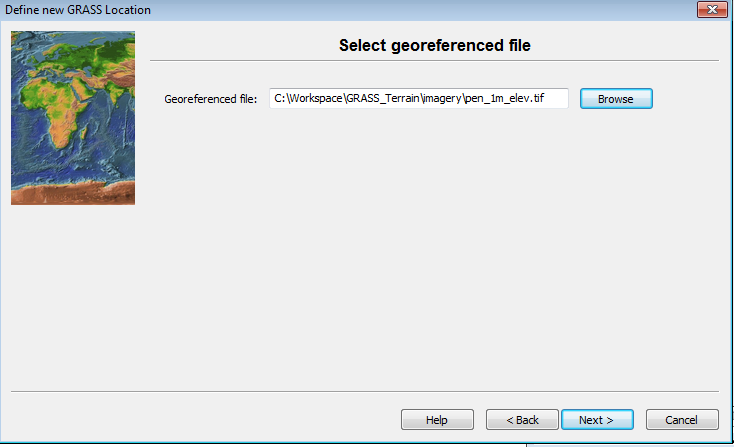
- Browse and select to the D:\CSP7300\GRASS_Terrain \imagery\pen_1m_elev.tif as the georeferenced file.
- Click Next.
GRASS reads the projection and datum information from the elevation file and displays the projection data.
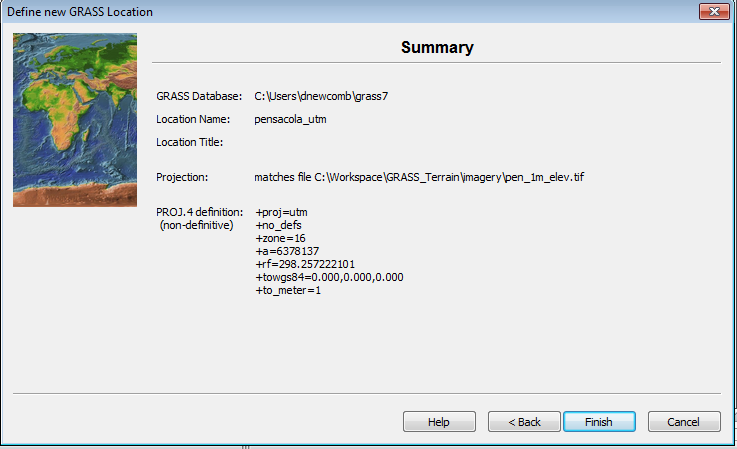
- Click Finish
The next message relates to setting a default path for GRASS startup.
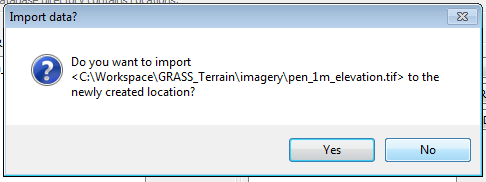
In the following message, you have the option if importing the data set you used for georeferencing the workspace.
- Click No
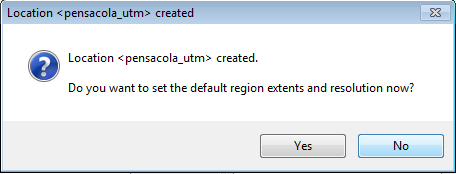
The location has been created. You are prompted to set the default region extents and resolution.
- Click No
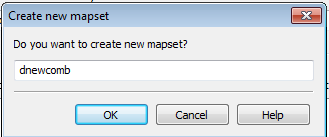
You are then prompted to create a new mapset.
- Click Cancel
You have finished creating a Location with the default PERMANENT mapset. The nest time GRASS is started, you can either select an existing Location and Mapset, Create a new mapset within the Location, or Create a new Location.
- Click on the PERMANENT Mapset
- Click Start GRASS session
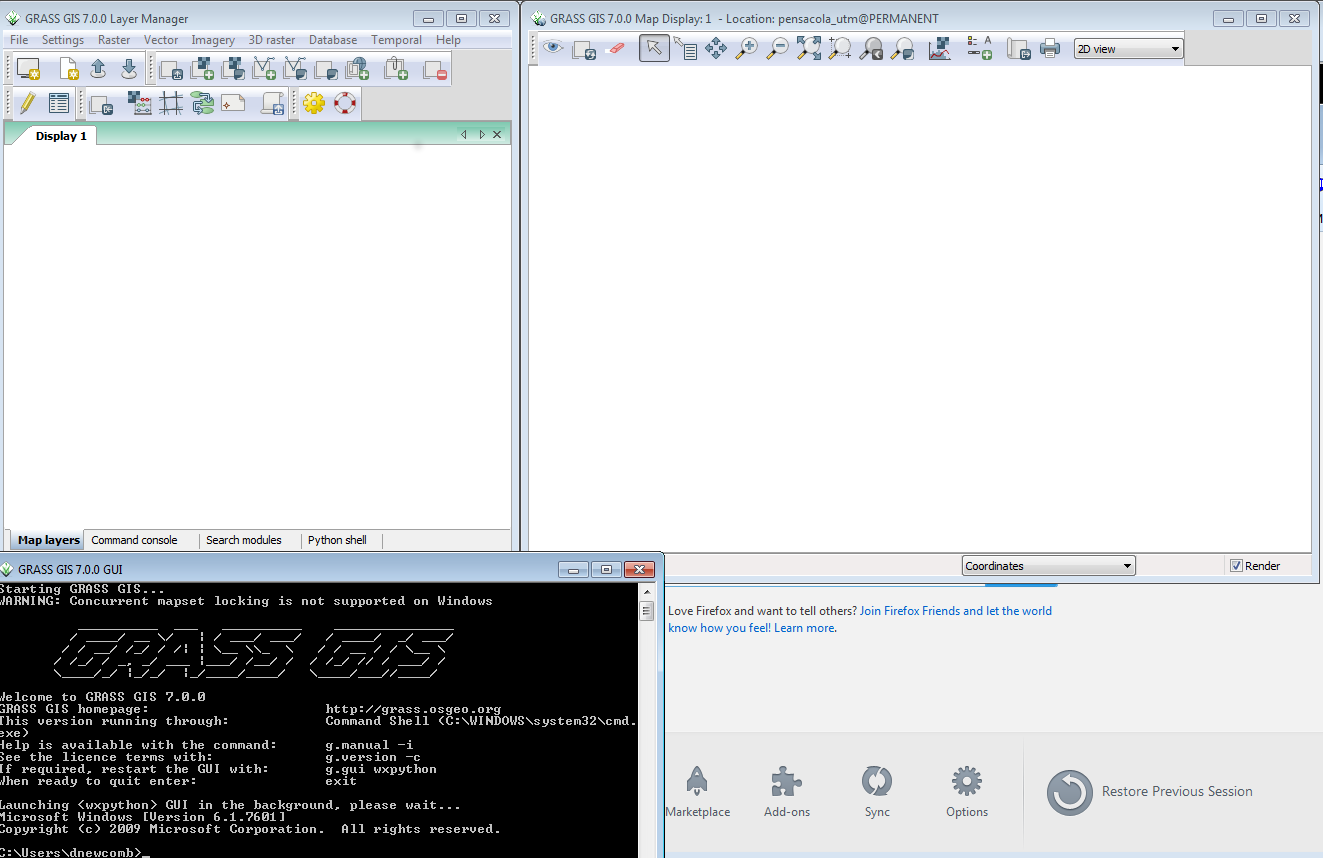
You will then see the Layer Manager Window, the Map Display Window for Display 1.
Step 2: Adding a data layer
We are now ready to add data to the Mapset. We can either import Raster and Vector data using the GDAL translation library, or we can link to existing external data sets read only to reduce data duplication. In this case, we will link to the 1m elevation data we used to create the Location using the r.external command.
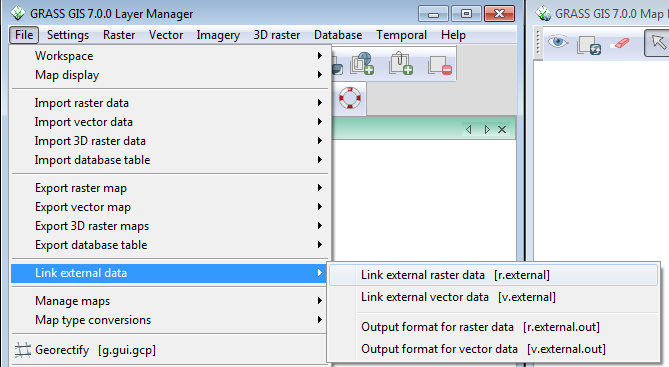
- In the Layer Manager window, click File-->Link external data-->Link external raster data.
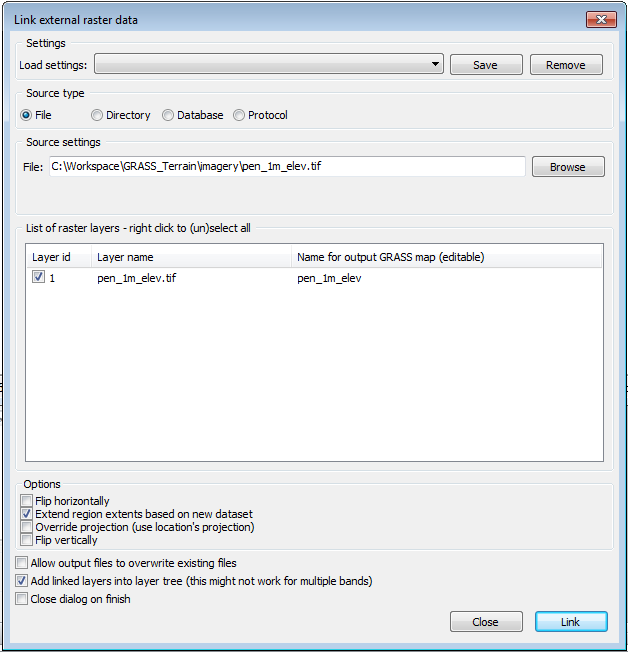
This brings up the r.external dialog.
- Browse to D:\CSP7300\GRASS_Terrain \imagery\pen_1m_elev.tif
- Click on the box for Extend region extents based on new dataset. Note that Add layers into layer tree is checked. For large data sets, leave this unchecked.
- Click Link.
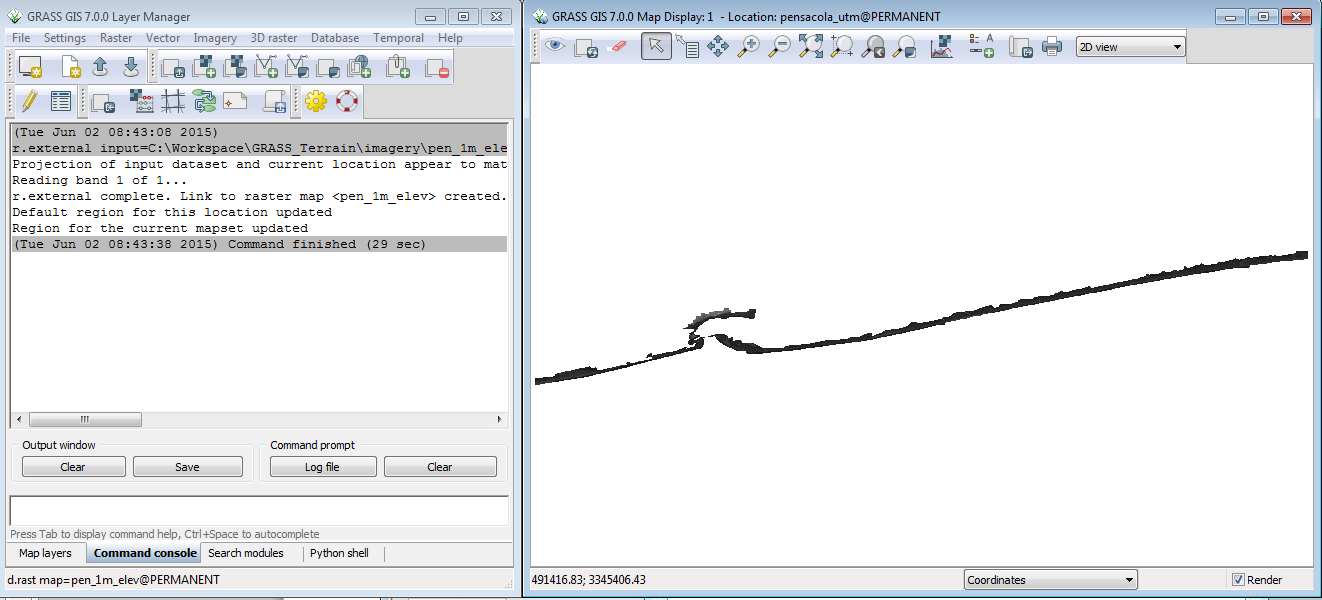
The Layer Manager window will switch to the Command console tab and display the results of the r.external command.
The raster is also displayed in the Map Display window. The image is 945 million pixels. It takes much less time to link to it than import it.
Step 3: Setting up the region
The region in a GRASS mapset defines the extent and resolution of the results of any raster actions. To make sure that all of a raster layer is affected by a command, it is customary to set the region’s extent and resolution to match the raster layer. To set the region to match the elevation raster that we just linked to:
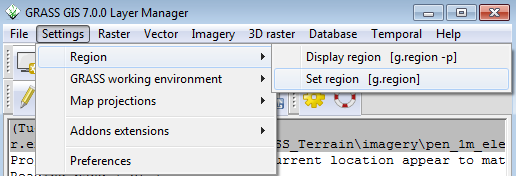
- From the Layer Manager window drop down options, click the Settings-->Region-->Set region
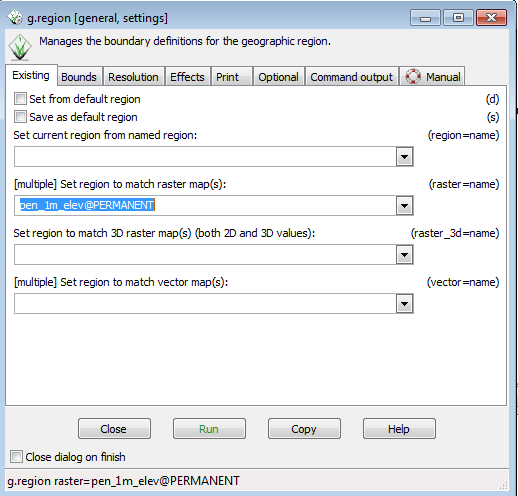
- In the g.region menu, in the Set region to match raster map section, use the drop down to select pen_1m_elev@Permanent.
- Click Run
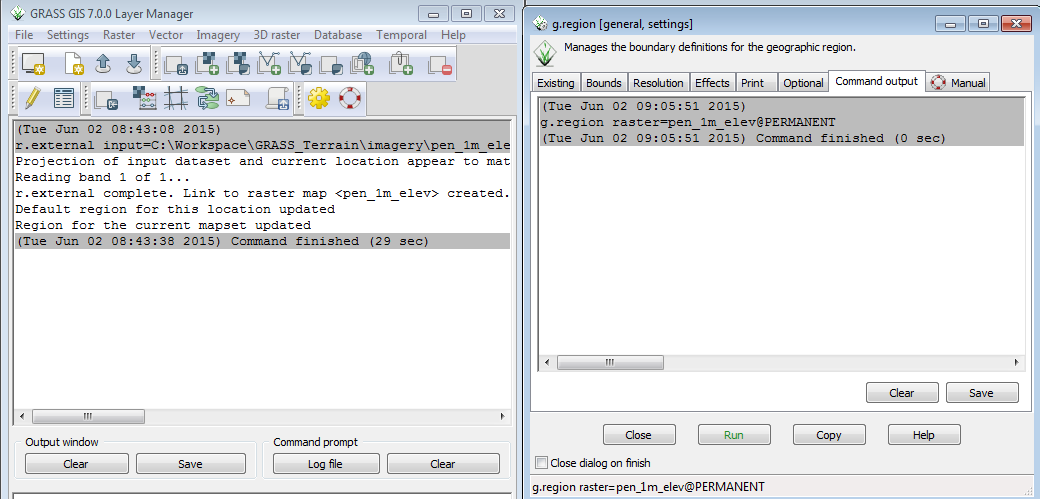
When the command finishes, your will see output in the g.region window and in the layer manager window.
- Click Close in the g.region window
- Click Settings-->Region-->Display region
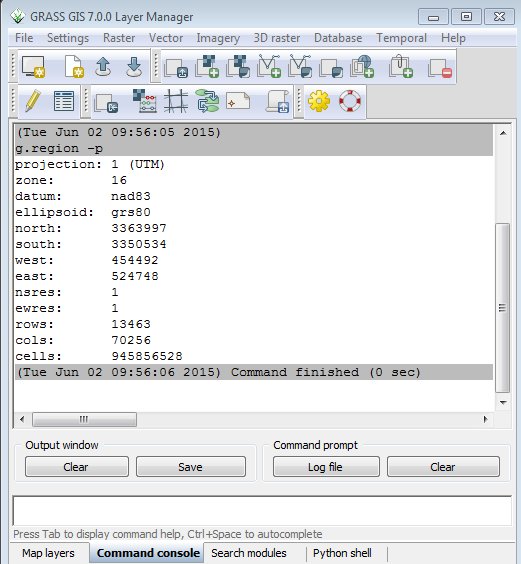
In the command console tab of the Layer Manager window, you see the current region definition: resolution, bounds, rows and columns.
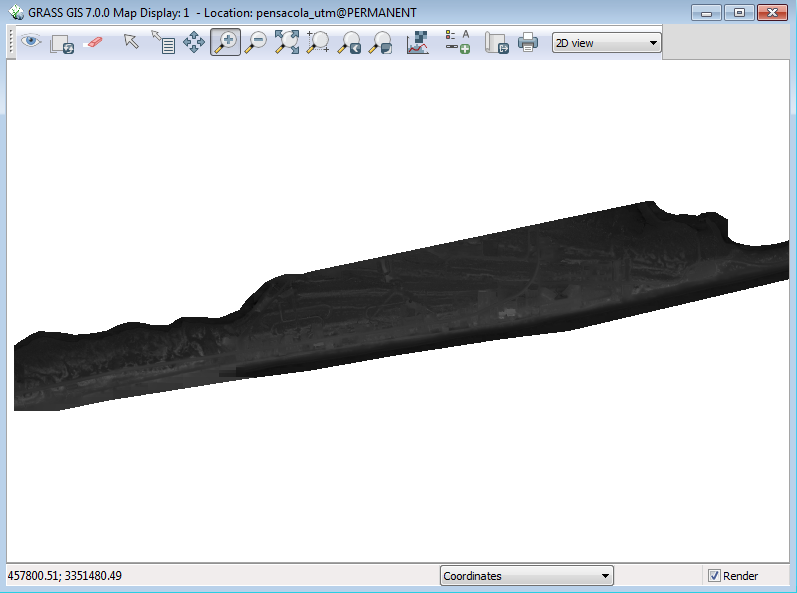
However, we are not really interested in the entire area, just a small section of the Western island. Let’s zoom into the area of interest with the Zoom tool on the Display window.

- Click on the Zoom tool at the top of the Display window.
- Click and drag to form a box around the fat portion of the western island.
Your Display window should look like this:
Since we are only working with this area, we can change the region values so that processing is only done in this area. The easiest way to do this is to:
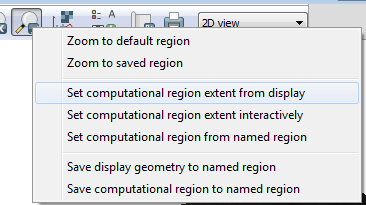
- Click on the Various zoom options button on the Display window
- Select Set computational region extent from display
- In the Layer Manager window, Click on Settings-->Region-->Display region
The new extents of the region are now displayed. Scroll up to compare to the old extents. You should see that the computational region is now about 23 million cells instead of 945 million. This means that any computations will be much faster and will only work with the portion of the elevation layer that is within the new extents.
Step 4: Changing Raster Colors
There is very little topographical relief on this barrier island and it is difficult to see the differences in the features with the default color scheme. To modify the colors,
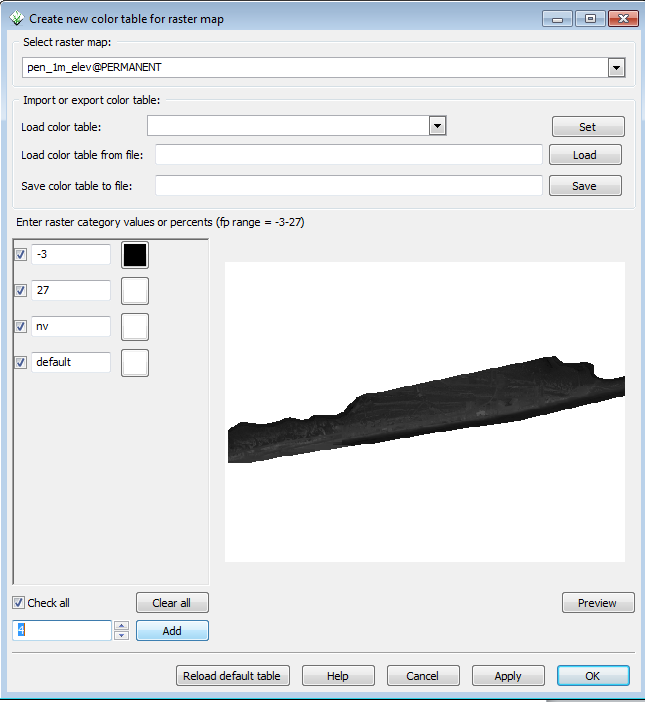
- In the Layer Manager window, Click Raster-->Manage colors-->Manage color rules interactively.
- In the color table window, set enter 4 in the box next to the Add button in the lower left.
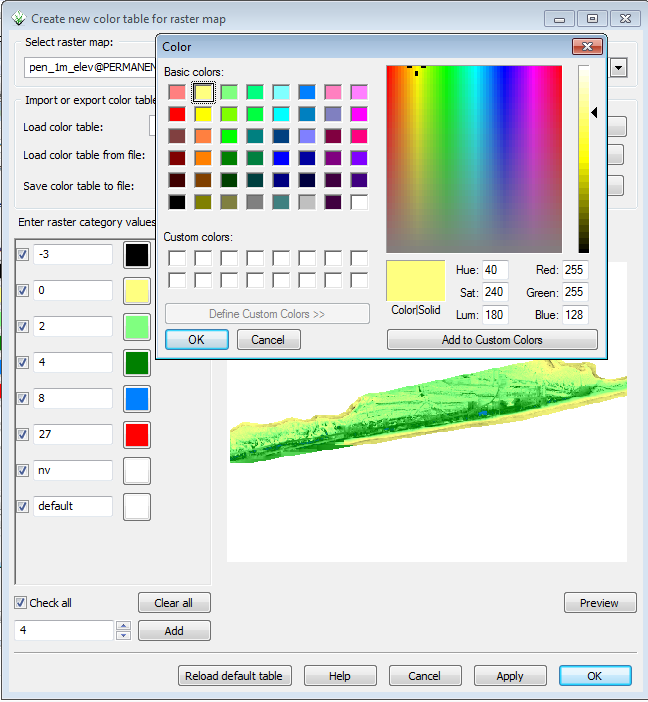
You can then manually set the colors and the intervals. The colors will ramp between the intervals you set. Make sure to keep nv and default in white and at the end for this exercise.
- Try different color settings and click the preview button.
- When satisfied with your colors, click OK
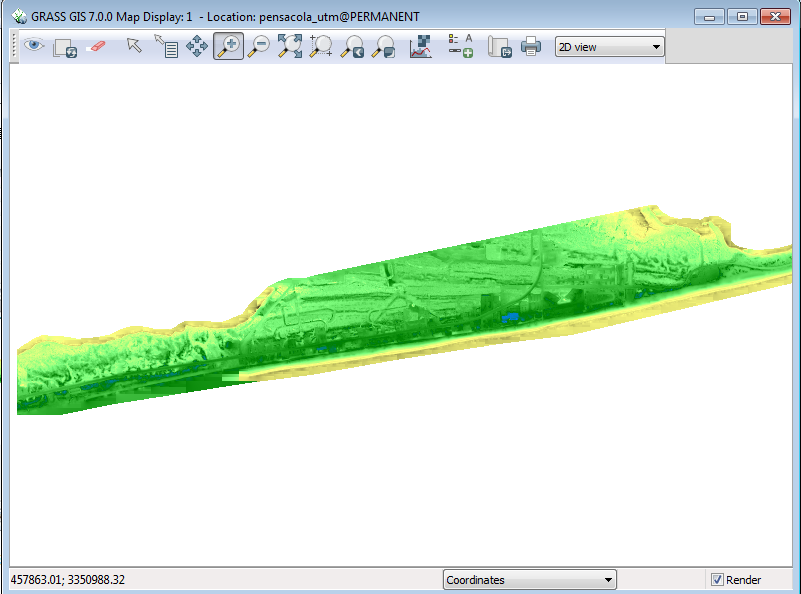
Your display window should now look like this:
Step 5: Adding the r.geomorphon Addon
To do our terrain classification, we will need to load the r.geomorphon addon to GRASS.
GRASS has an online repository of Addons much like QGIS has for plugins. Most addons do not require administrative access to install.
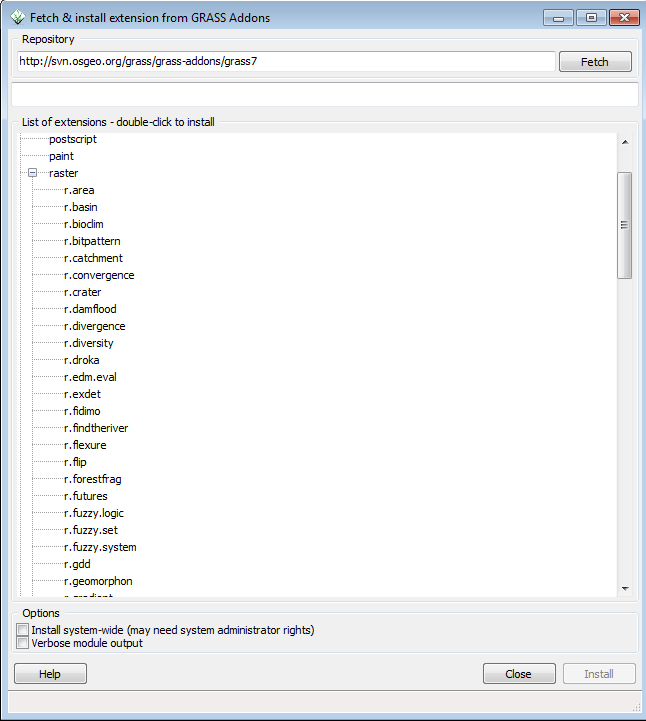
- In the Layer Manager window, click on Settings-->Addons extensions-->Install extension from addons
This will open the Fetch and install extension window. GRASS commands are named by their function: r.* commands are raster commands, v.* commands are vector commands, i.* commands are image analysis commands.
- Click on the + next to raster to expand the view on all raster commands
- Select r.geomorphon
- Click install
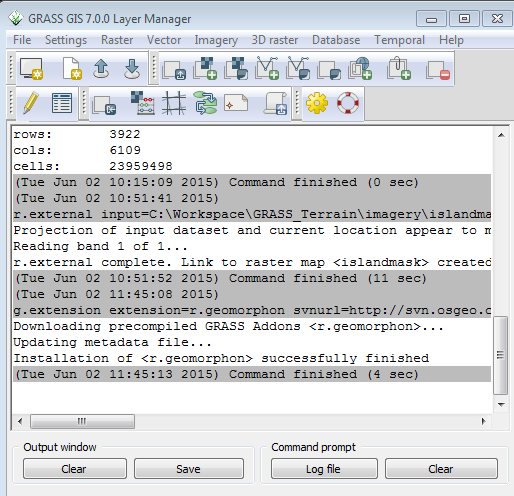
In the Layer Manager window you can follow the progress of the installation.
In this case, downloading and installing the addon took 4 seconds on a 2010 vintage Windows 7 laptop.
Step 6: Running r.geomorphon
The r.geomorphon command documentation is at http://grass.osgeo.org/grass70/manuals/addons/r.geomorphon.html and the publications for the technique can be found at http://geomorphometry.org/system/files/StepinskiJasiewicz2011geomorphometry.pdf and , http://www.sciencedirect.com/science/article/pii/S0169555X12005028
The technique uses a line of sight metric for terrain form calculation. There are options for a simple 10 class representation, a 498 class numeric coding, or positive and negative encoding per cell on line of sight.
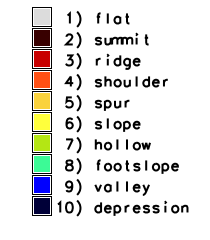
For this activity, we will use the simple 10 class calculation. Outputs will be cells with the following classes: Flat, peak, ridge, shoulder, spur, slope hollow, footslope, valley, and pit.
To start r.geomorphon,
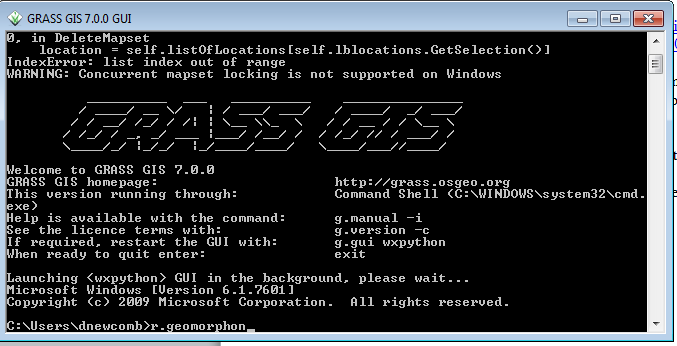
- In the GRASS Command window, type r.geomorphon and press Enter.
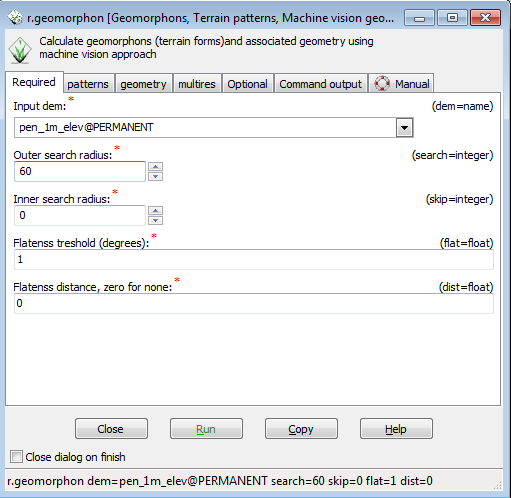
Entering the command without arguments brings up the r.geomorphon menu. You will notice that there are tabs across the top. The first tab is the Required Tab, with required data inputs to run the command.
- From the dropdown for Input DEM, select pen_1m_elev@PERMANENT
- In the Outer search radius, enter 60 ( number of cells around each cell to analyze) This is a very flat area, so the number may need to be higher to extract some features.
You will note that as the command arguments are entered, they are echoed across the bottom.
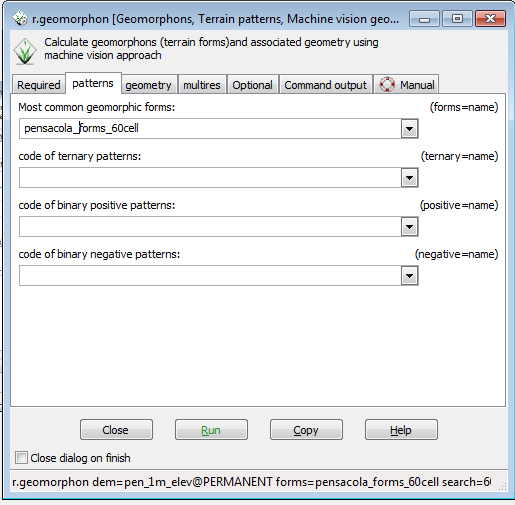
- Click on the patterns tab.
- Type pensacola_form_60cell in the box under Most common geomorphic forms.
- Click Run
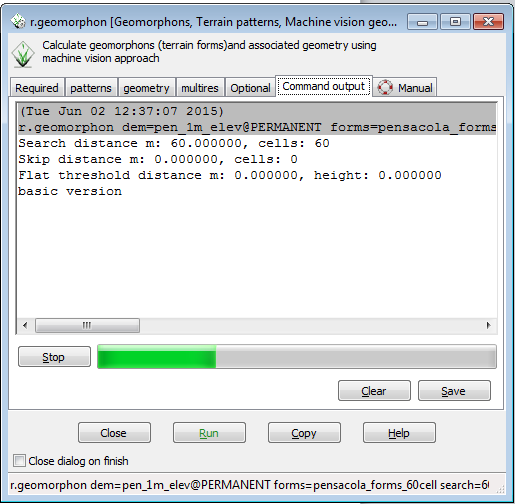
The tab will immediately switch to the Command Output tab, the command options will be echoed, and a progress bar will show the progress of the command.
A check of the Windows Task Manager shows that the r.geomorphon command is only using 60 MB of RAM to process the area. This process will take 7.5 minutes on a 2010 vintage i7 laptop.
Larger areas and larger cell radius extents will require more memory. This process scales fairly well. It has been used on the Statewide 20ft elevation grid for North Carolina (6.6 billion cells) with a radius of 30 cells, but it required more than 4GB of RAM and took overnight to run on a Linux workstation. GRASS 7.0 on Windows is currently a 32-bit applcation and cannot address more than 2GB RAM on Windows 7 64 bit.
You will need to manually add the result to the Display.
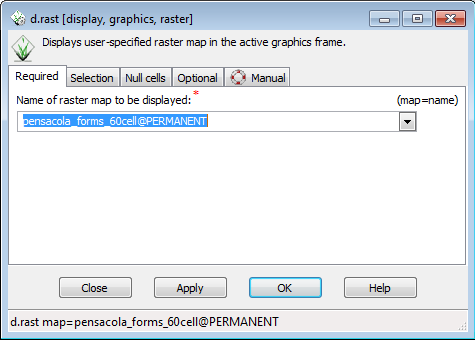
- At the top of the Layer Manager window, Click Add raster map layer button
- In the d.rast menu that pops up, select pensacola_forms_60cell
- Click OK
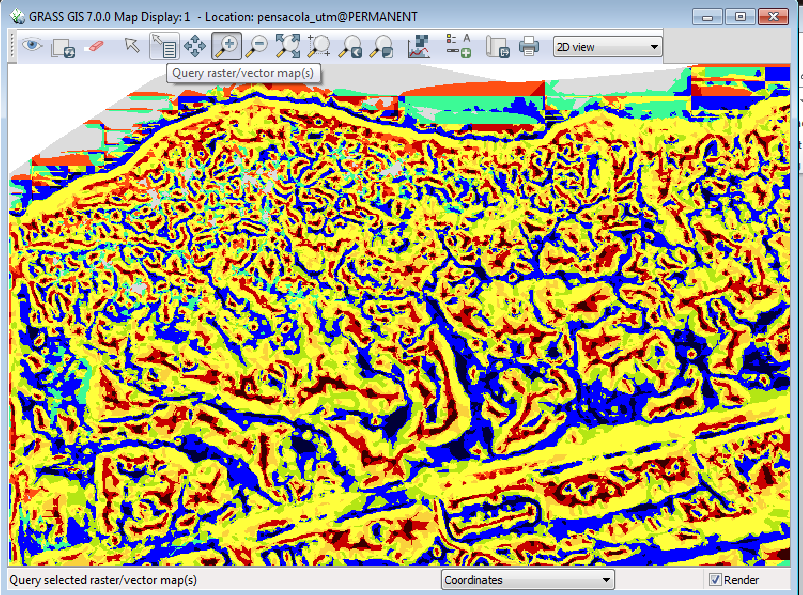
Your overview map should look like this:
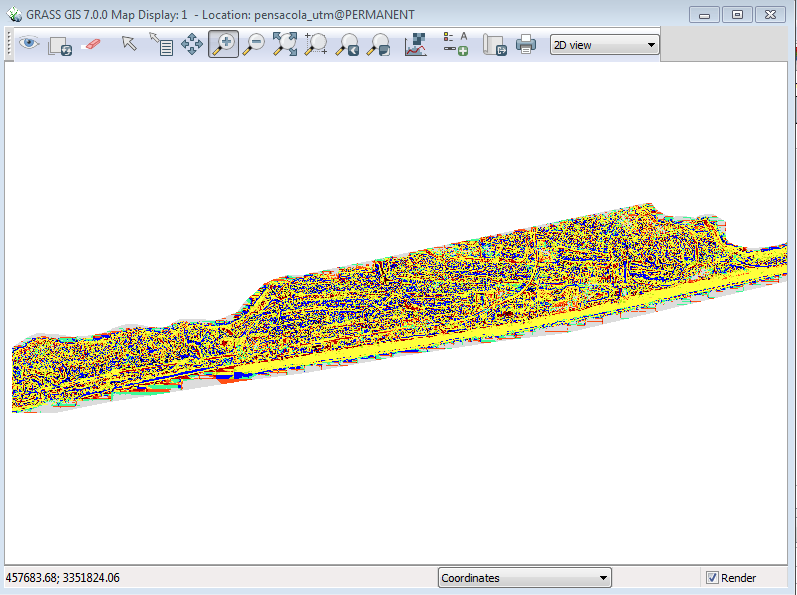
Use the zoom tool in the Display window to zoom into the section on the extreme lower left.
You can see a lot of different patterns, but what do they mean?
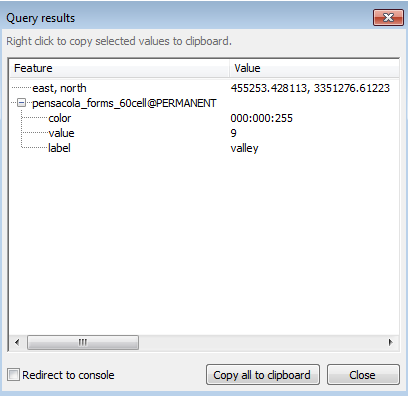
- Click on the Query raster / vector maps tool and you can click individual cells to extract the value.
For example, a blue pixel represents integer value 9 or valley.
Alternatively, you can
- Click on the Add map elements Button
- Select Show/Hide legend
You should then see the following legend with the integer values and classes.
Step 7: Extracting Dune Footprints
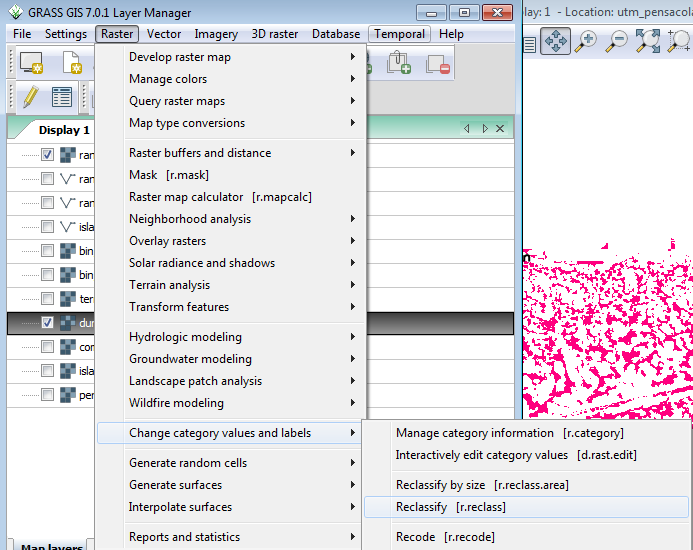
In order to simplify the output to areas just representing dunes, we can perform a simple reclassification of the categories by running r.reclass ( Raster-->Change category values and labels-->Reclassify)
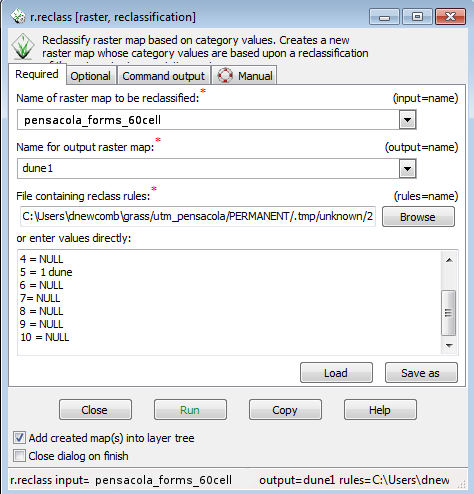
This will open the r.reclass menu.
- Select pensacola_forms_60cell as your input layer.
- Enter dune 1 as the output layer
- We will be keeping Classes 2,3, and 5 (summit, ridge , and spur) as part of dunes and removing the rest of the classes. The easy way to do this is to copy and paste the following text into the box where it says enter the text directly (as shown in the graphic below).
1 = NULL
2 = 1 dune
3 = 1 dune
4 = NULL
5 = 1 dune
6 = NULL
7= NULL
8 = NULL
9 = NULL
10 = NULL
- Click Run
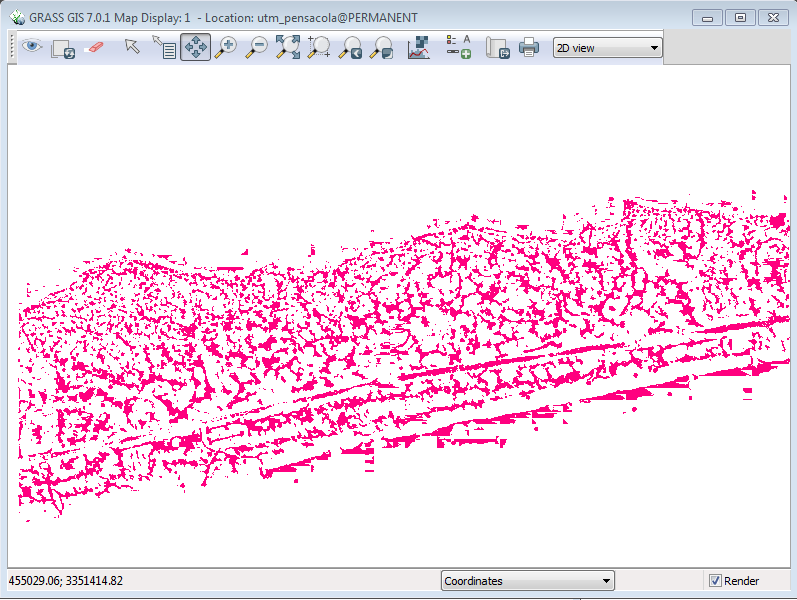
Uncheck every layer in the layer manager window except the dunes layer. Your Map Display window should now look like this:
You now have a separate layer representing the dunes for this section of beach.
While it seems like you have created a new layer, r.reclass actually just displays the old layer with different symbology. This is very fast and takes up much less hard drive space. GRASS GIS will treat the result of r.class like a distinct layer for raster calculation and masking functions
Step 8: Exporting to GeoTiff
While GRASS is a rich environment for analysis, the GRASS 7.0 datasets are not easily accessible by other applications. Exporting to a common file format such as geotiff would make the data more generally available.
To export the final geomorphon layer:
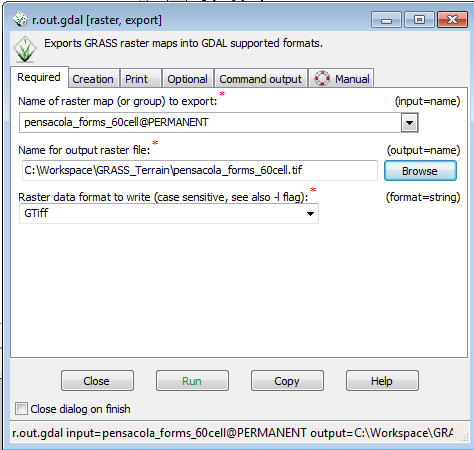
- From the Layer Manager window select File-->Export Raster map-->Common export formats
This will open the r.out.gdal menu, which uses the gdal library give you the option to write to many different raster formats.
- Select pensacola_forms_60cell from the Name of raster map drop down
- In the Name for output raster file option, Browse to the directory ( GRASS_Terrain) and enter the name of the output file as pensacola_forms_60cell.tif
- Keep the Raster data format as GTiff
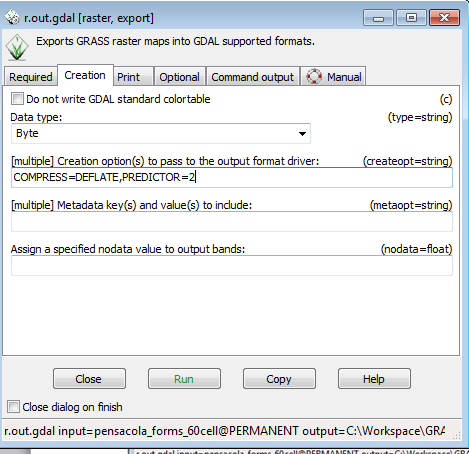
- Click on the Creation tab
- Set the data type to byte ( 0-255 integer range)
- In the Creation options window, type COMPRESS=DEFLATE,PREDICTOR=2
The compression options in the creation options will cause the output geotiff to be losslessly compressed using the deflate method. Predictor= 2 makes the compression more efficient (Predictor=2 is for Integer rasters, Predictor=3 is for floating point rasters). The export process finishes in about 2 seconds.
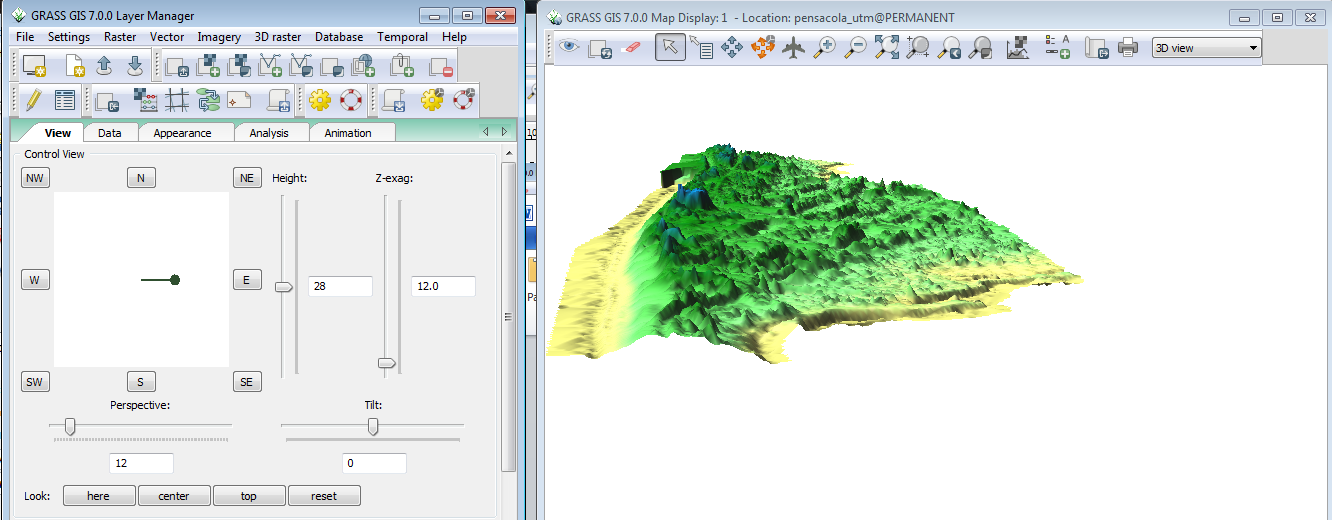
If you have any time left,
- In the Layer Manager window, click to highlight pen_1m_elev
- Uncheck the box next to pensacola_forms_60cell
- In the Display window, Select 3D View from the drop down in the upper right.
This activates the 3D visualization mode for GRASS GIS. There are several options for 3D display of the different raster and vector layers. Consult with your instructor for demonstration.
