GRASS 6 Tutorial/Displaying spatial data
Jump to navigation
Jump to search
Displaying spatial data with GRASS
This section of the tutorial explains how to display raster and vector data using GRASS GIS. We focus on two approaches: one approach uses the CLI and the d.mon display monitors, while the other shows you how to use the GRASS wxGUI. This reader is redirected to the Quick wxGUI tutorial for more information on this topic.
Displaying from the wxGUI
Displaying from the CLI
d.mon start=x0
g.region rast=elevation
d.rast elevation
You can navigate within the display monitor using a combination of d.pan and d.zoom in conjunction with the mouse buttons.
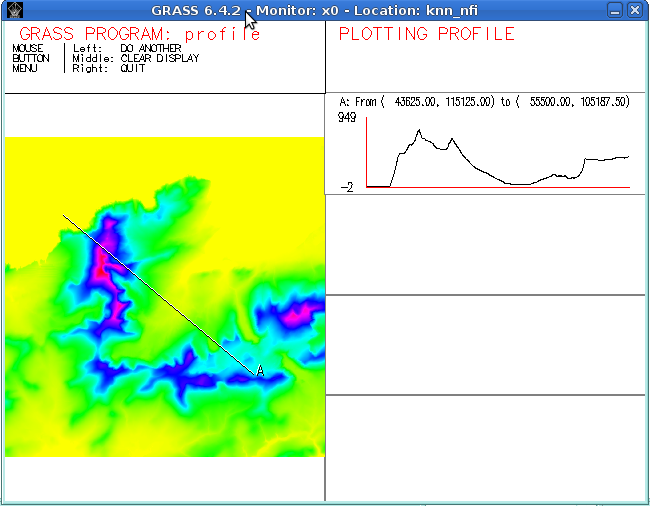
Plotting an elevation profile
Plotting an elevation profile between two points is done by running d.profile:
