Uploads by Annakrat
Jump to navigation
Jump to search
This special page shows all uploaded files.
| Date | Name | Thumbnail | Size | Description | Versions |
|---|---|---|---|---|---|
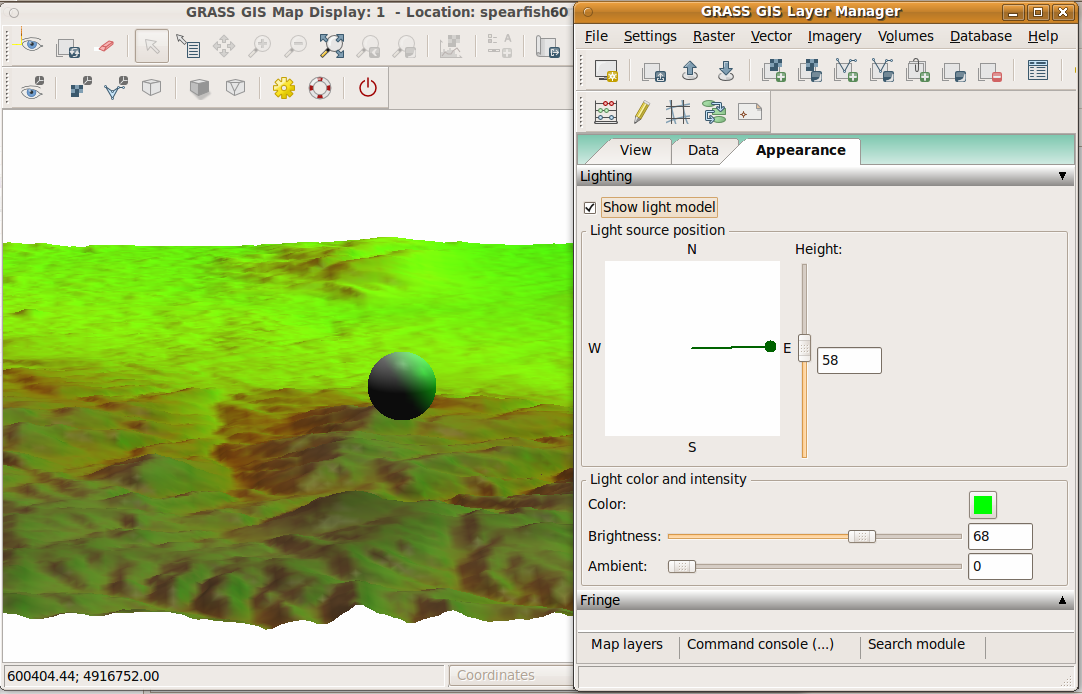
| 08:15, 2 June 2011 | WxNviz lighting.png (file) |  |
300 KB | 1 | |
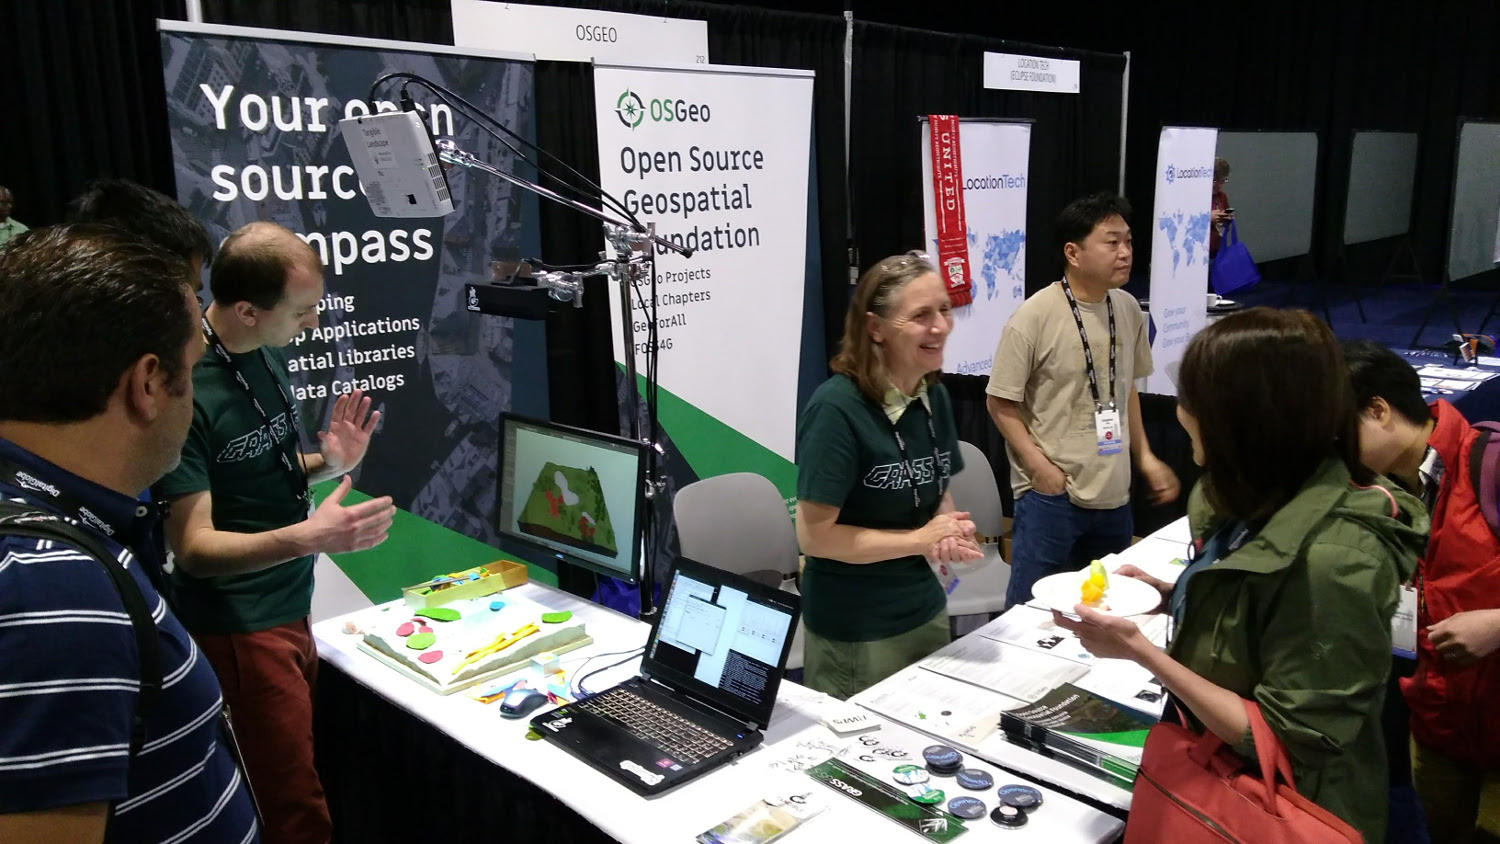
| 20:14, 20 August 2017 | OSGeo booth Boston 2017.jpg (file) |  |
311 KB | OSGeo booth at FOSS4G 2017 in Boston. Tangible Landscape demo, stickers, flyers. | 1 |
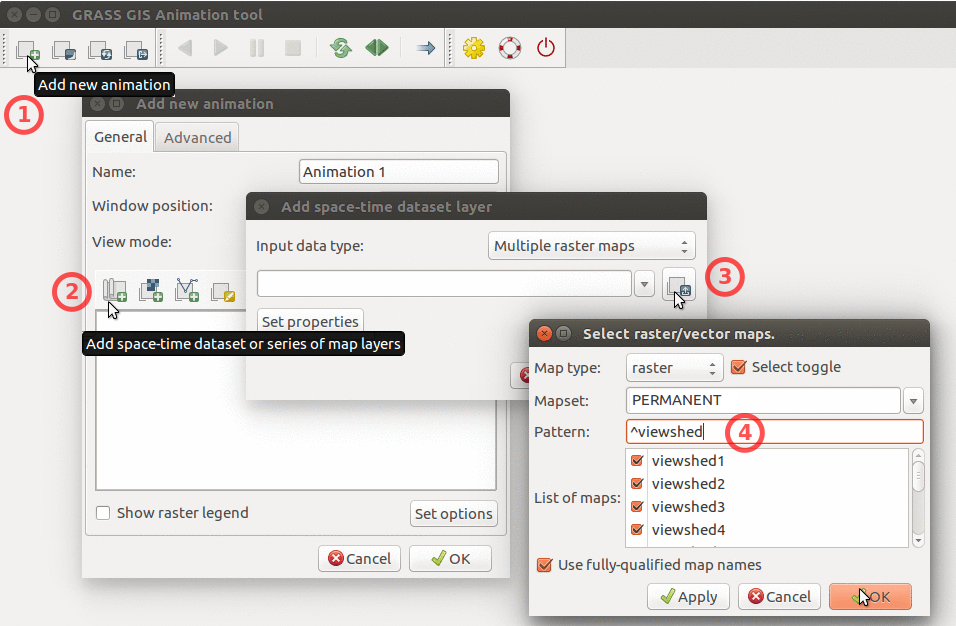
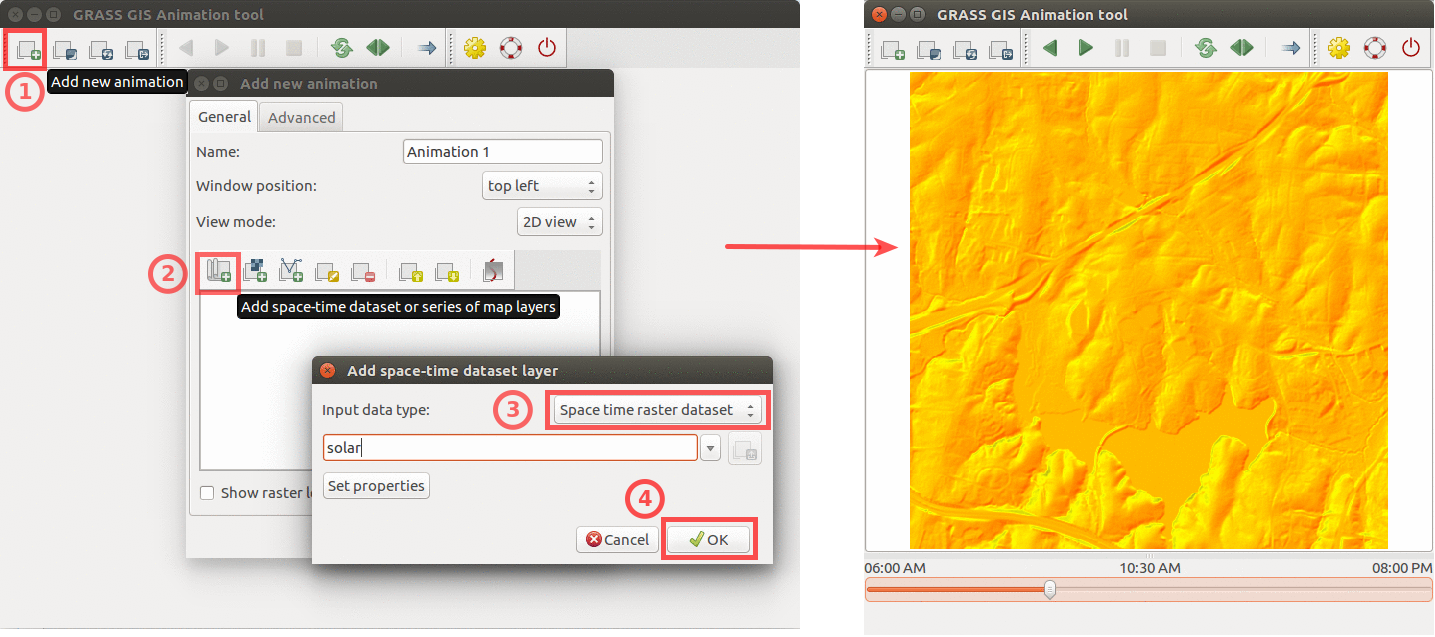
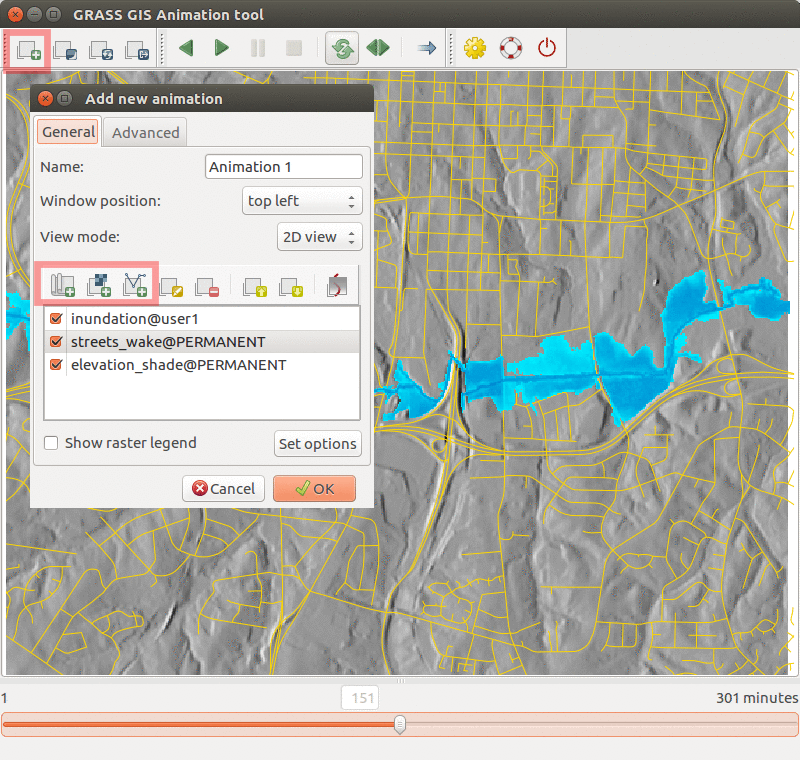
| 20:54, 21 June 2017 | Animation tool add multiple rasters.png (file) |  |
320 KB | How to add multiple raster maps and filter them by name. | 1 |
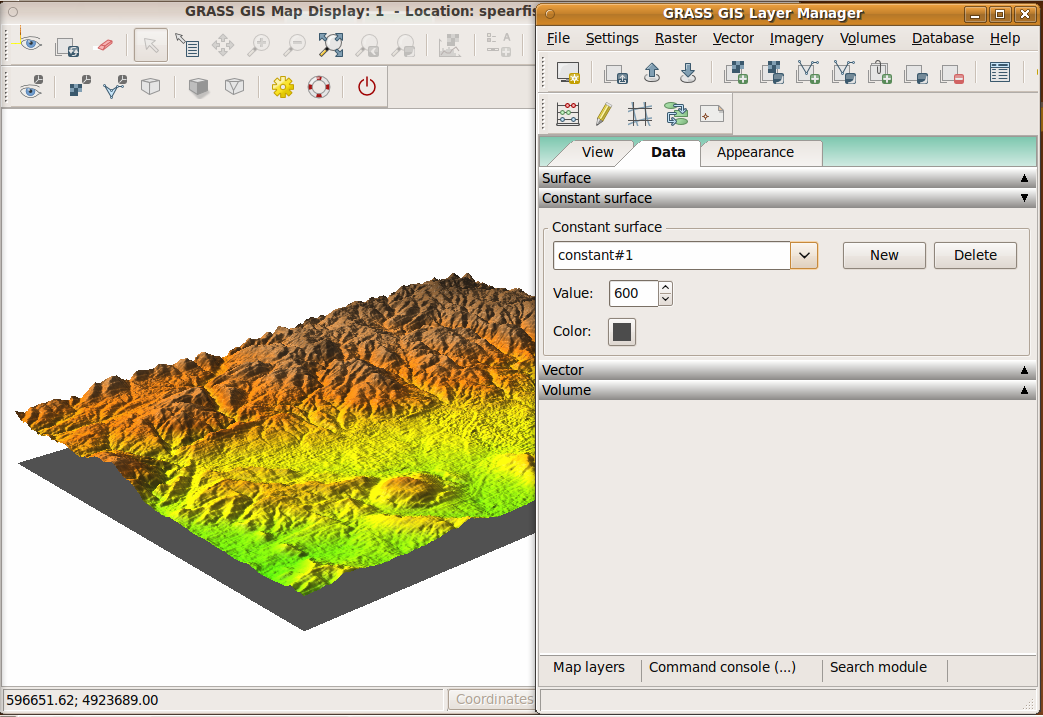
| 08:05, 2 June 2011 | WxNviz constant surface page.png (file) |  |
336 KB | 1 | |
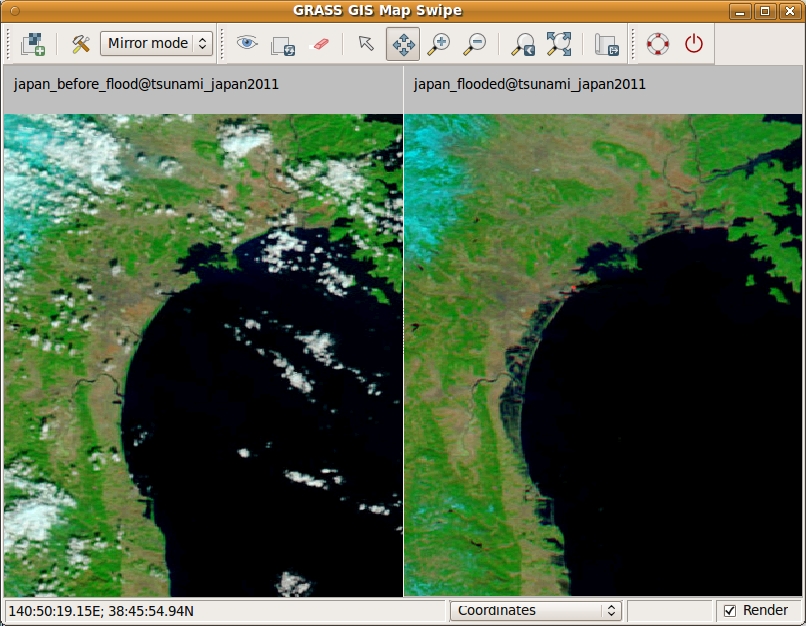
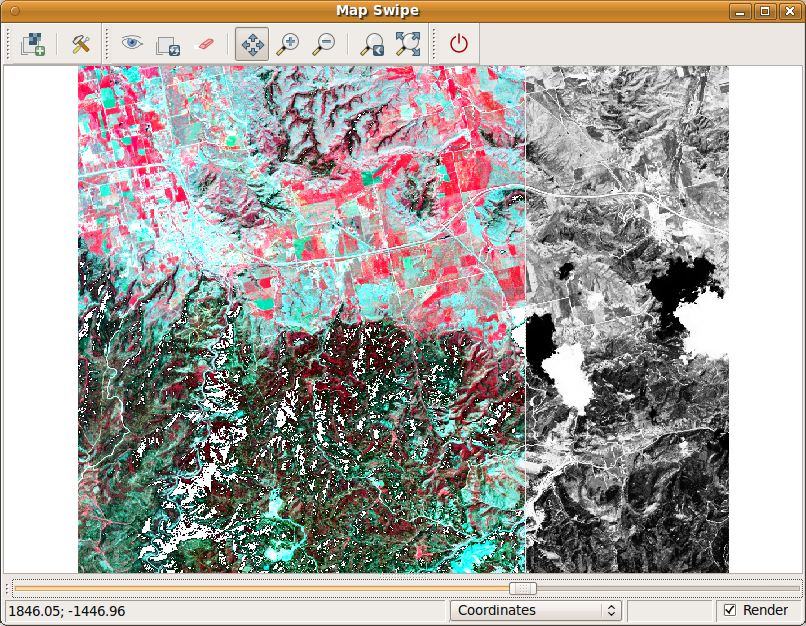
| 14:26, 10 December 2012 | Mapswipe tsunami mirror.jpeg (file) |  |
342 KB | Map Swipe mirror mode: pre and post disaster images of the tsunami in Japan in 2011. Source: http://earthobservatory.nasa.gov/NaturalHazards/view.php?id=49634 | 1 |
| 22:15, 9 April 2017 | Animation solar example.png (file) |  |
439 KB | Using GRASS GIS animation tool to animate solar irradiance during a day. Computed by {{addonCmd|r.sun.hourly}}. | 1 |
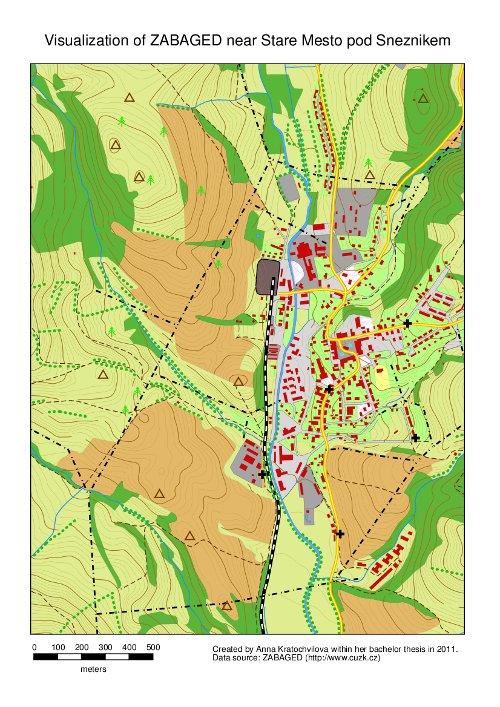
| 20:06, 30 September 2011 | StareMesto.png (file) |  |
460 KB | An example of hardcopy map output created by Cartographic Composer. | 1 |
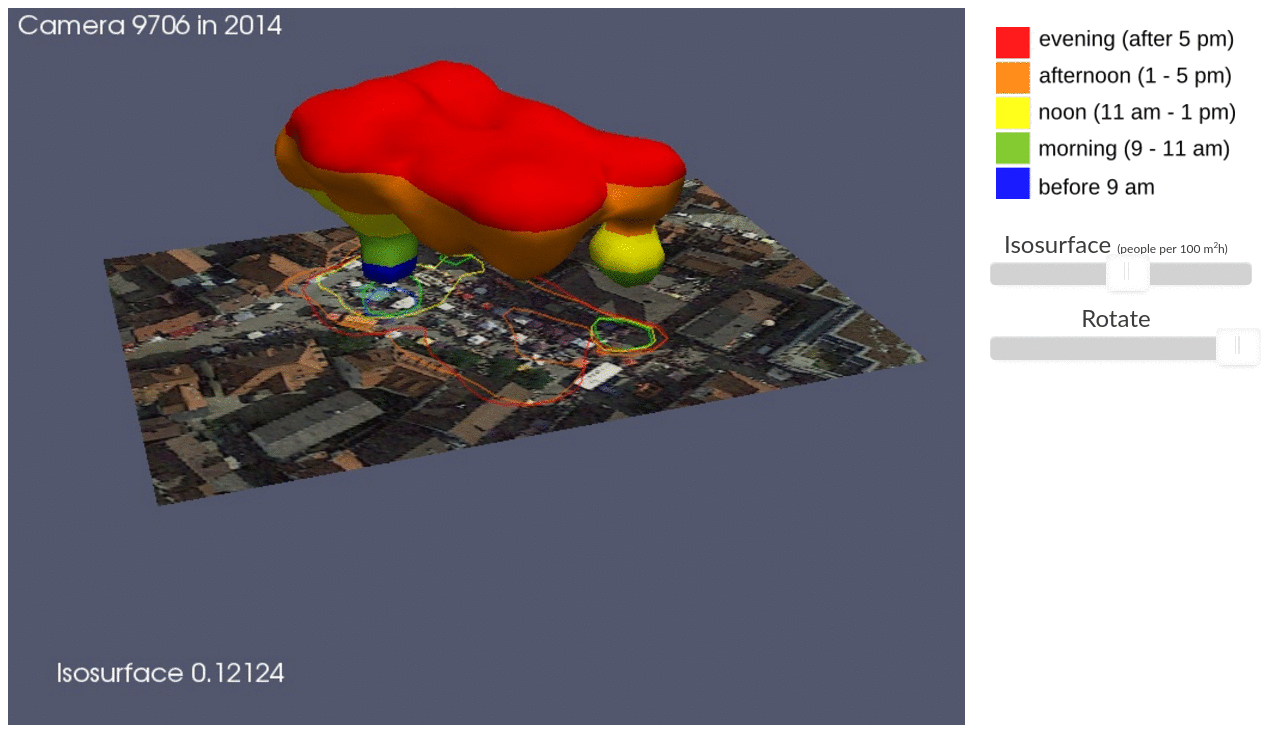
| 01:40, 18 July 2017 | ICC STC illustration.png (file) |  |
468 KB | Presentation on Using space-time cube for visualization and analysis of active transportation patterns derived from public webcams by Anna Petrasova, Aaron Hipp, and Helena Mitasova from North Carolina State University | 1 |
| 04:38, 21 July 2017 | Animation tool inundation.png (file) |  |
468 KB | Inundation computed with {{addonCmd|r.stream.distance}} and {{addonCmd|r.lake.series}} and visualized in Animation Tool. | 1 |
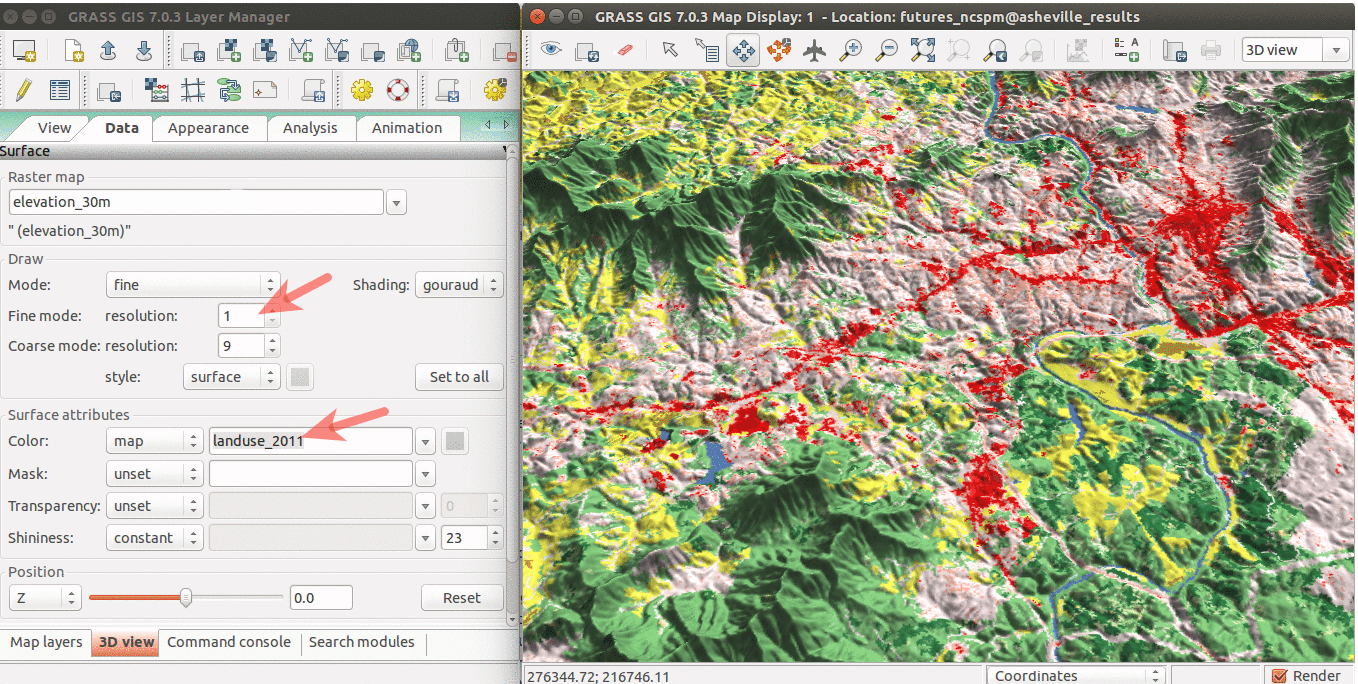
| 15:55, 28 March 2016 | WxGUI 3Dview.png (file) |  |
482 KB | Draped NLCD 2011 over NED elevation raster. | 1 |
| 03:17, 30 March 2016 | FUTURES animation tool.gif (file) |  |
504 KB | FUTURES results animated using GRASS GIS Animation tool | 1 |
| 07:36, 10 August 2012 | MapSwipe1.png (file) |  |
513 KB | 1 | |
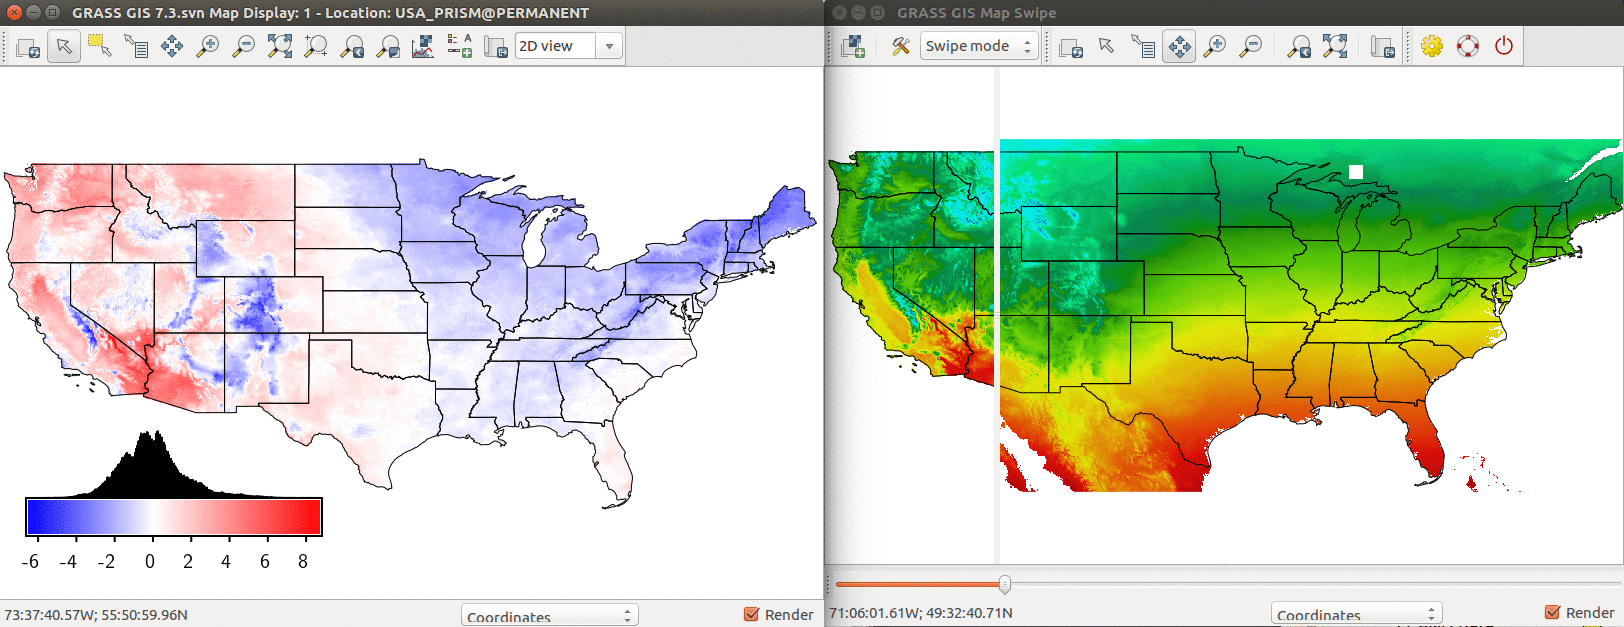
| 20:03, 4 April 2017 | US temp model comparison.png (file) |  |
529 KB | Comparison of PRISM annual mean temperature and modeled temperature based on latitude and elevation. Left: Difference between modeled and real temperature in degree Celsius. Right: Using Map Swipe to visually assess the model (modeled temperature on th... | 1 |
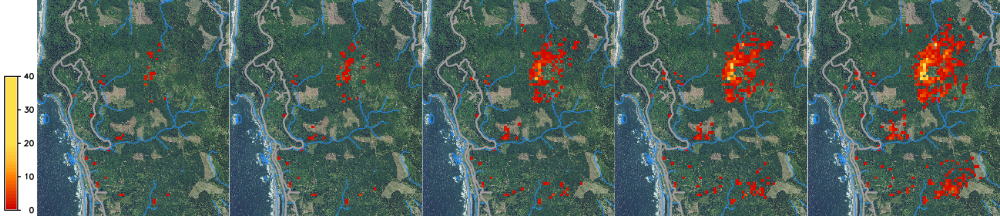
| 19:09, 31 March 2020 | SOD spread example.png (file) | 535 KB | Spread of SOD from 2019 to 2023, one stochastic realization. | 1 | |
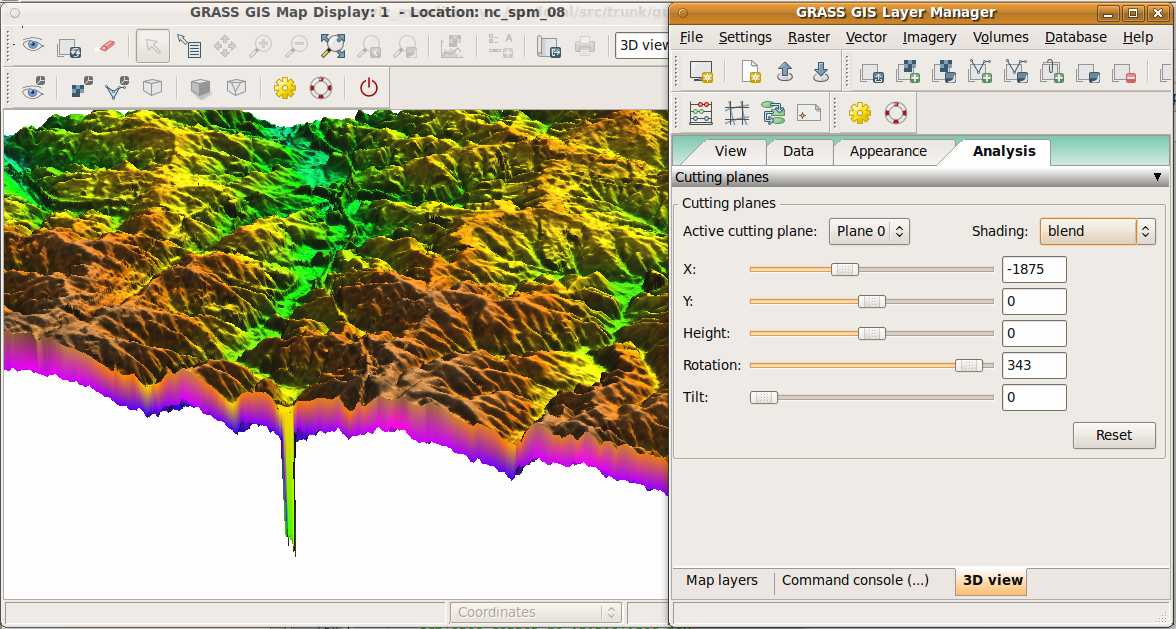
| 11:29, 10 June 2011 | WxNviz cutting planes 1.png (file) |  |
545 KB | Cutting planes | 1 |
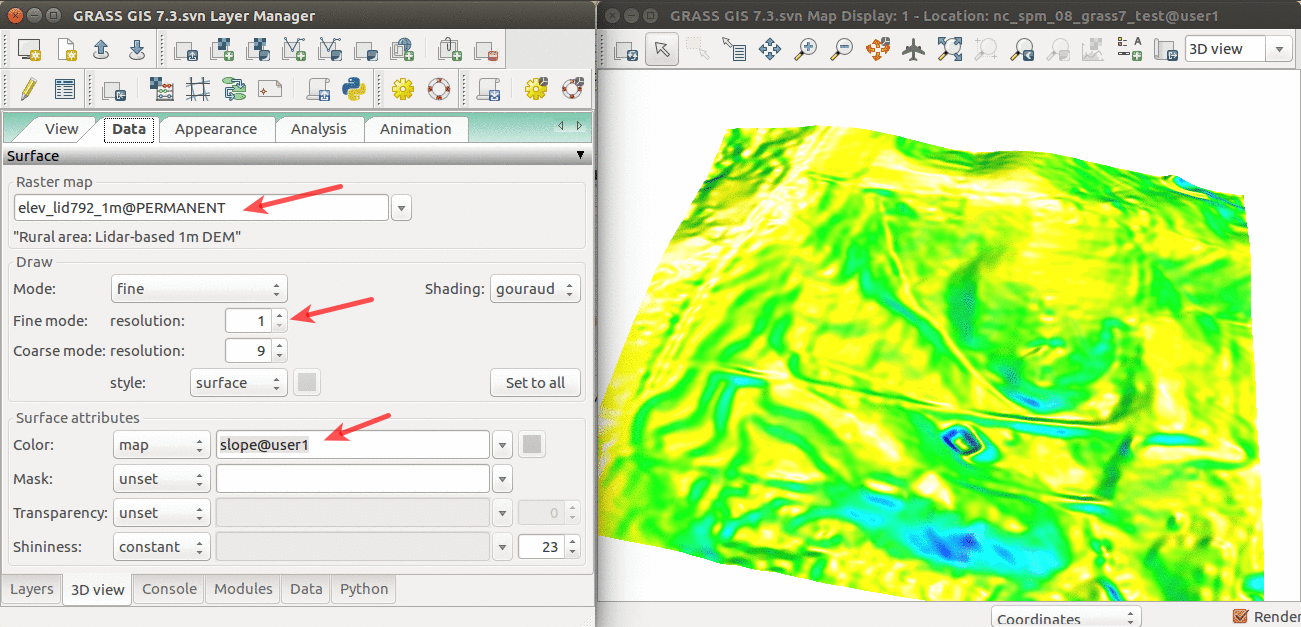
| 14:48, 11 April 2017 | Elevation slope 3D view.png (file) |  |
565 KB | 3D visualization of elev_lid792_1m DEM with slope draped over. | 1 |
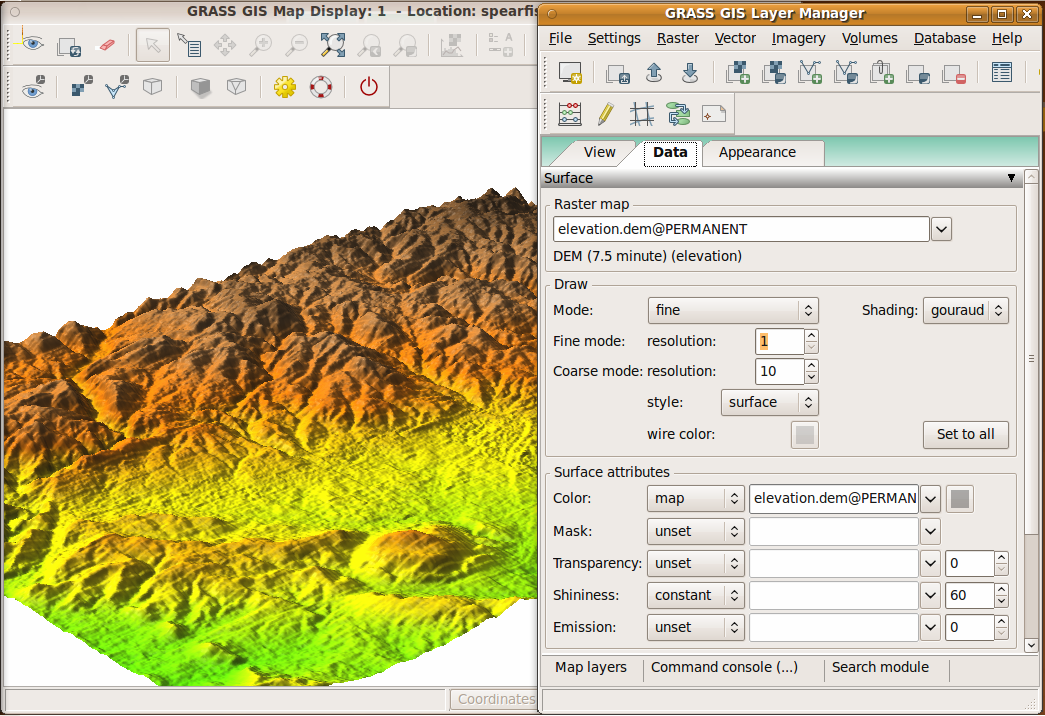
| 08:03, 2 June 2011 | WxNviz surface page.png (file) |  |
601 KB | modified surface page in WxNviz | 1 |
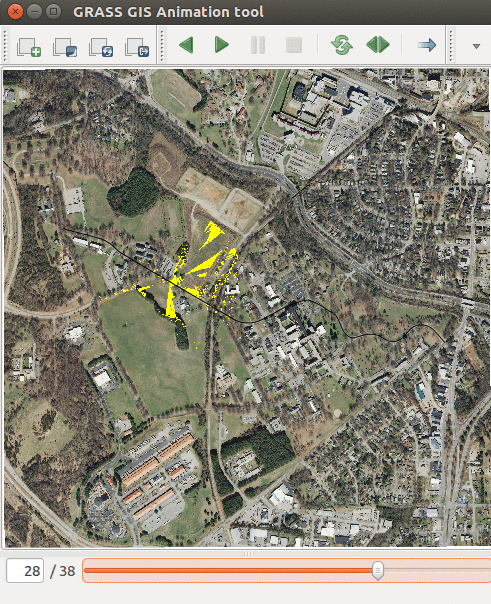
| 21:40, 21 June 2017 | Animation tool viewsheds.png (file) |  |
619 KB | Showing series of viewsheds with Animation Tool | 1 |
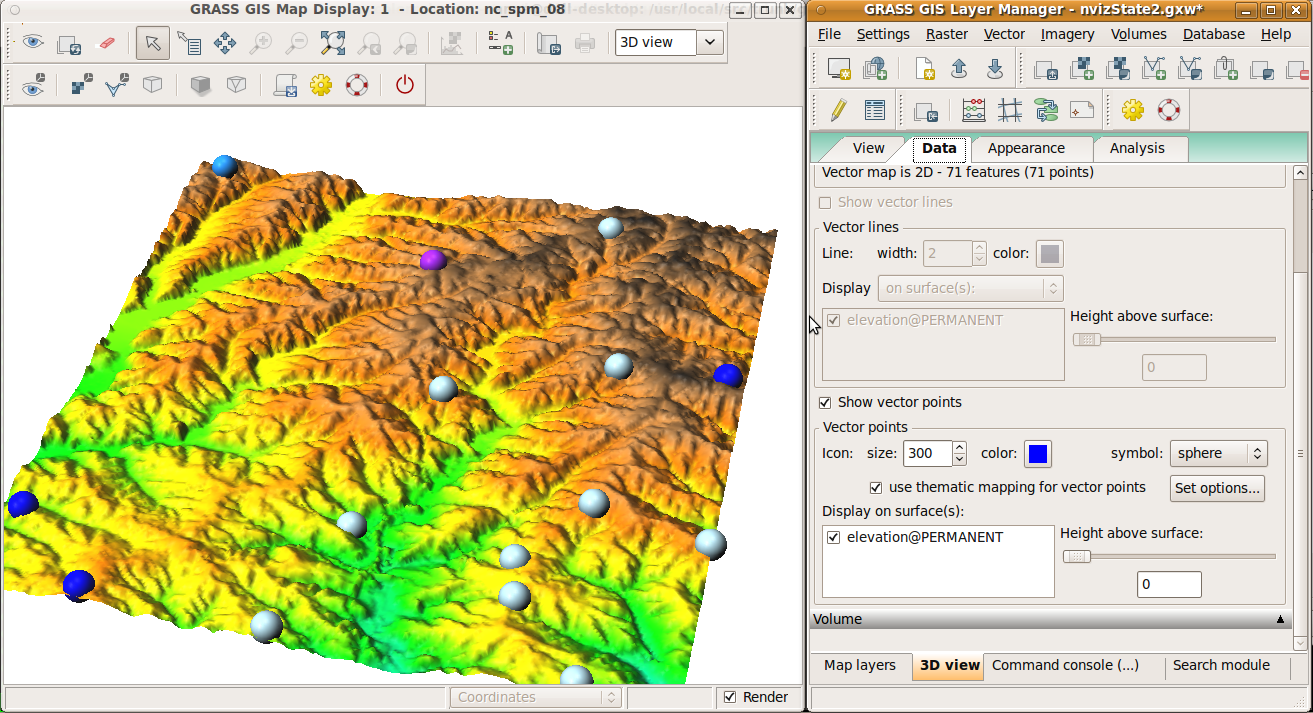
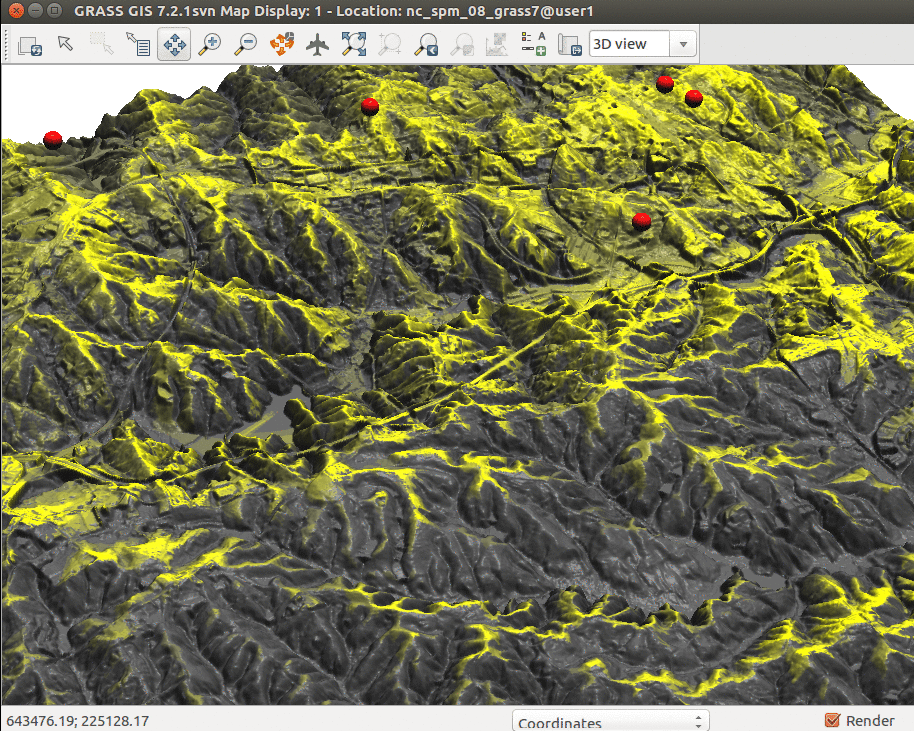
| 18:50, 5 August 2011 | WxNviz thematic points colors.png (file) |  |
666 KB | 1 | |
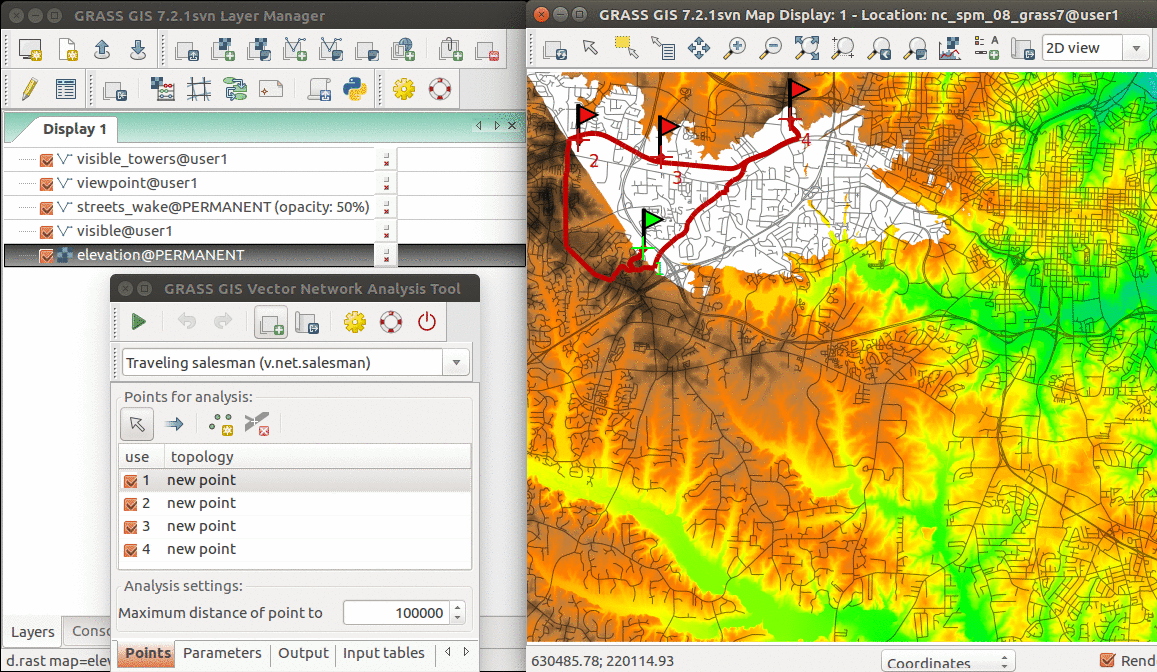
| 19:33, 19 July 2017 | Vector network GUI GRASS 72.png (file) |  |
727 KB | Example of using Vector Network Analysis Tool for Traveling Salesman problem | 1 |
| 20:28, 19 July 2017 | Cumulative viewshed elevation.png (file) |  |
1.08 MB | Cumulative viewshed draped over elevation raster (Boston 2017 workshop) | 1 |
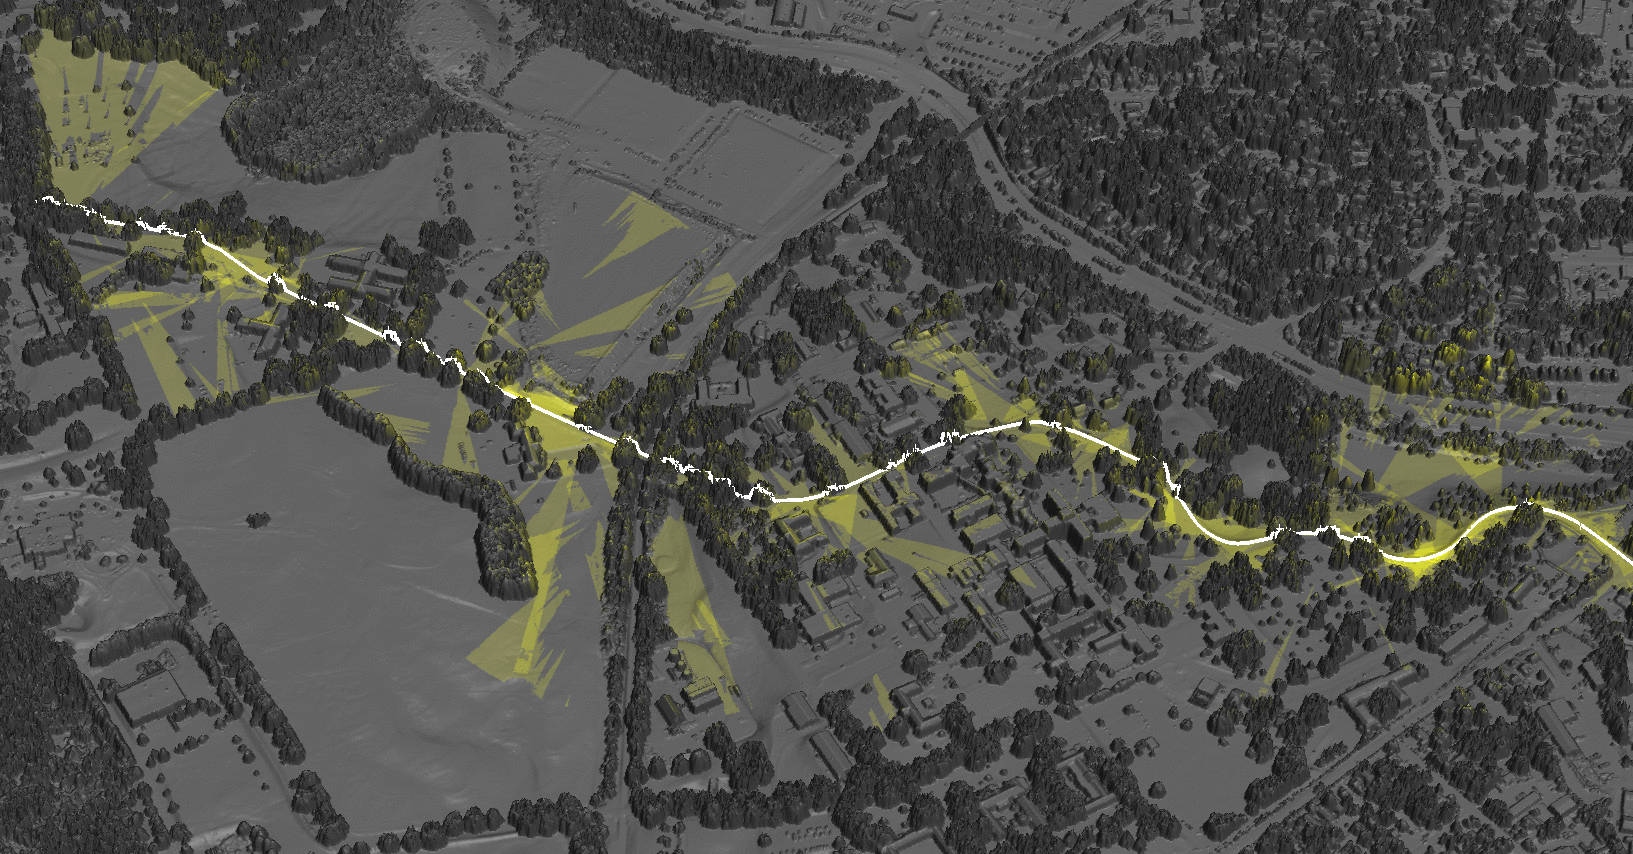
| 19:27, 21 June 2017 | Cumulative viewshed.png (file) |  |
1.34 MB | Cumulative viewshed computed from views along a road. | 1 |
| 21:00, 22 June 2017 | ICC workshop 3Dview ortho.png (file) |  |
1.45 MB | 3D visulization of digital surface model draped with orthophoto | 1 |