WxNviz: Difference between revisions
(article created + new template 'ToModify') |
m (remove hardcoded version specific urls, use latest version) |
||
| (119 intermediate revisions by 7 users not shown) | |||
| Line 1: | Line 1: | ||
''(Back to [[WxPython-based GUI for GRASS|wxGUI]] page.)'' | |||
[[ | '''wxNviz''' is a [[wxGUI]] extension which allows users to realistically render multiple surfaces (raster data) in a 3D space, optionally using thematic coloring, draping 2D vector data over the surfaces, displaying 3D vector data in the space, and visualization of volume data (3D raster data). | ||
[[Category: | |||
[[Category: | For usage instructions, see also the {{cmd|wxGUI.nviz|desc=manual page}}. | ||
__TOC__ | |||
== Screenshots == | |||
<center> | |||
<gallery perrow=3 widths=200> | |||
Image:Wxnviz-alpha-0.png|2008-06-27: Display raster map from layer tree in 2.5D (surface) | |||
Image:Wxnviz-alpha-1.png|2008-07-05: Support for vector data (2D lines) added | |||
Image:Wxnviz-alpha-2.png|2008-07-26: Support for vector point data | |||
Image:Wxnviz-alpha-3.png|2008-08-02: 3D vector data support | |||
Image:Wxnviz-alpha-4.png|2008-08-09: Initial support for volumetric data | |||
Image:Wxnviz-lmgr.png|2010-05-31: 3D view tools window integrated into Layer Manager | |||
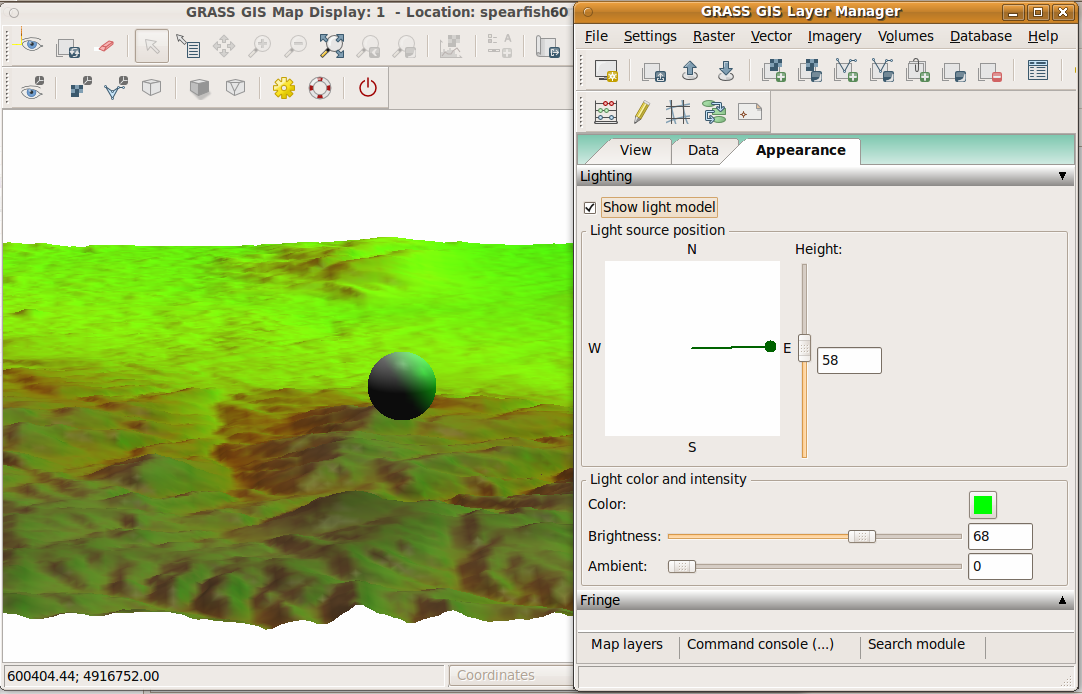
Image:Wxnviz-light.png|Lighting control panel in Layer Manager (2010-06-17) | |||
Image:Wxnviz-fringe.png|Fringe control panel in Layer Manager (2010-06-23) | |||
Image:Wxnviz-redirect.png|Redirect messages to wxGUI (2010-08-08) | |||
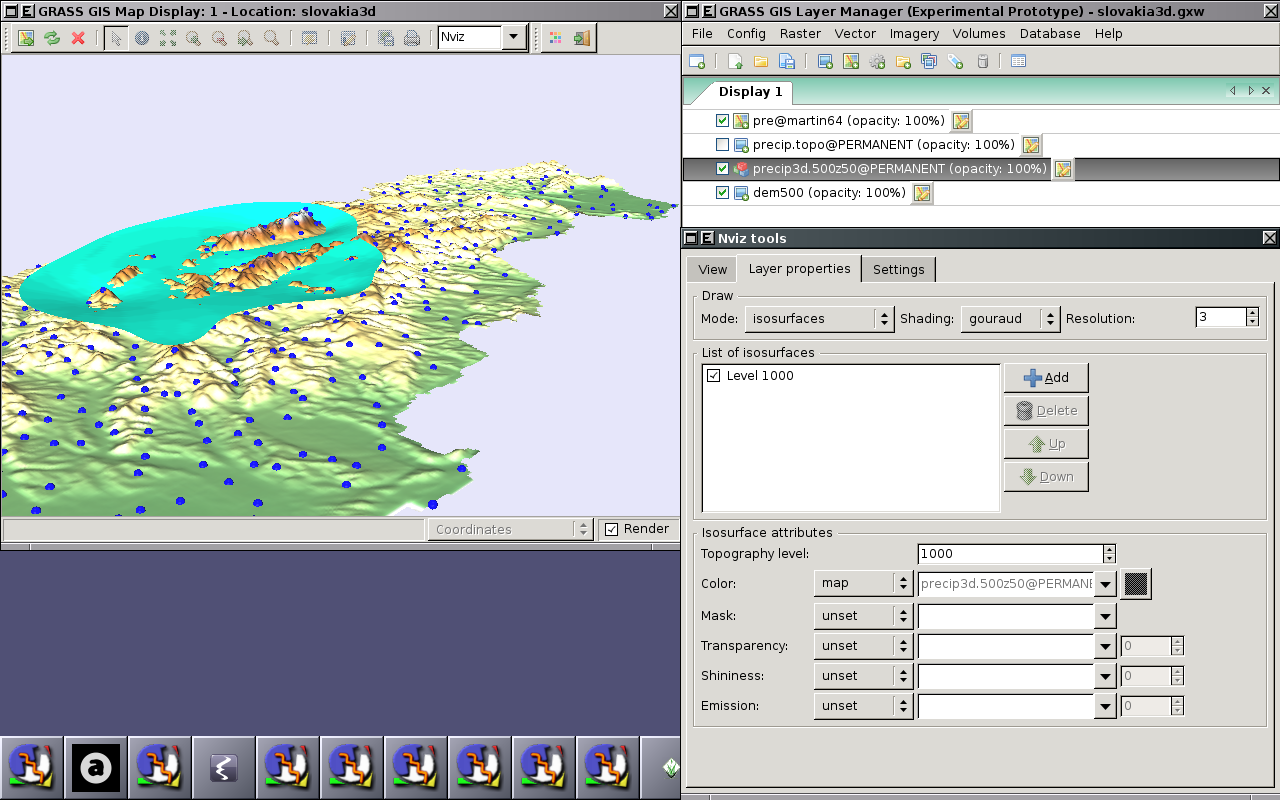
Image:Wxnviz-volumes.png|Displaying raster (surface), 2D vector and 3D raster (volume) in the 3D space (2010-08-16) | |||
Image:WxNviz surface page.png|Surface page of WxNviz modified (2011-06-02) | |||
Image:WxNviz_constant_surface_page.png|Constant surface page added (2011-06-02) | |||
Image:WxNviz_lighting.png|Lighting fixed (2011-05-02) | |||
Image:WxNviz_cutting_planes_1.png|Cutting planes (shading blend) (2011-06-10) | |||
Image:WxNviz_cutting_planes_2.png|Cutting planes (shading top color) (2011-06-10) | |||
Image:WxNviz_view_page.png|View page modified (2011-06-10) | |||
Image:Nviz_cmd_cutting_planes.png|Picture of surfaces cut by two planes (generated by nviz_cmd) (2011-06-30) | |||
Image:WxNviz_generate_command.png|Command for nviz_cmd generated by wxNviz (2011-07-01) | |||
Image:WxNviz_north_arrow.png|North Arrow implemented (2011-07-08) | |||
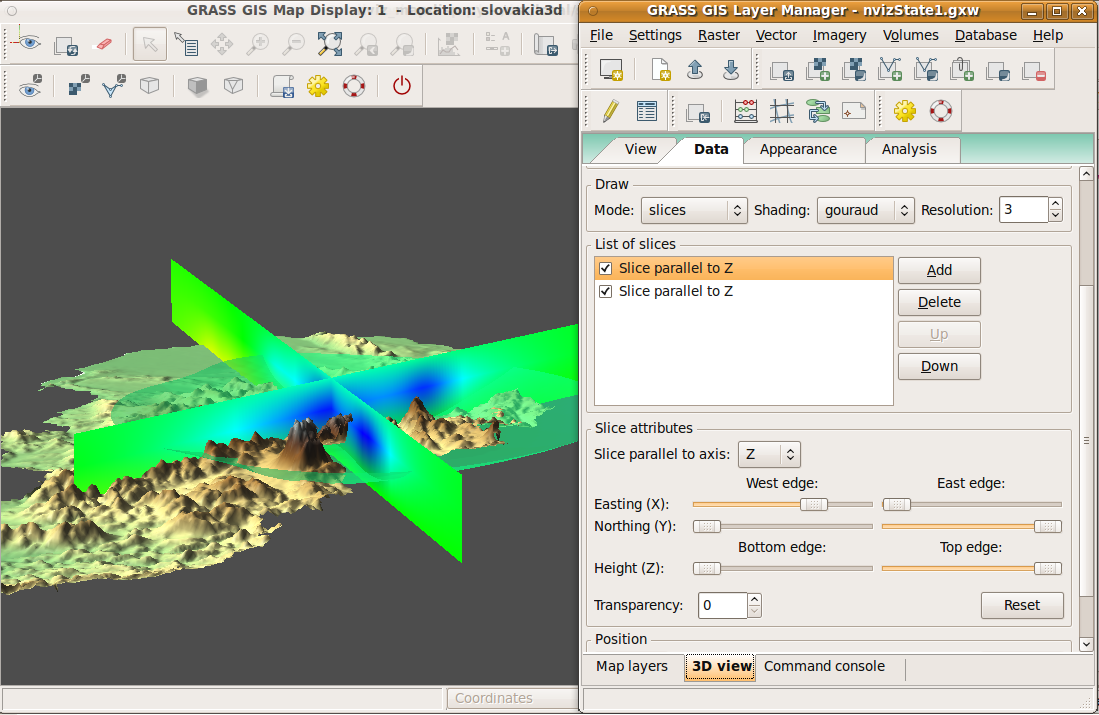
Image:WxNviz_volumes.png|Colored isosurfaces with transparency (2011-07-08) | |||
Image:WxNviz_volume_slices_1.png|Partially transparent slice (2011-07-14) | |||
Image:WxNviz_volume_slices_2.png|Combination of slices and isosurface (2011-07-14) | |||
Image:WxNviz_overlays.png|Raster legend, text label and north arrow (2011-07-22) | |||
Image:WxNviz_thematic_points_colors.png|Thematic mapping (colors) for points (2011-08-05) | |||
Image:WxNviz_colorrules_dialog.png|Dialog for {{cmd|v.colors}} opened from 3D view (2011-08-05) | |||
</gallery> | |||
</center> | |||
== Animations == | |||
{{YouTube|AByFPKHvgu4|desc=Using fly-through mode for creating animation}} | |||
== Video tutorials == | |||
{{YouTube|ib1-mBbWkv4|desc=Loading data, settings layer properties}} | |||
{{YouTube|ZLDstyumxv0|desc=Visualizing fringes and north arrow}} | |||
{{YouTube|CmK-fEyf2SY|desc=3D raster maps (volumes) in the space (isosurface and slice mode)}} | |||
{{YouTube|13wj5KWEweE|desc=Color thematic mapping}} | |||
=== Older tutorials (2010) === | |||
{{YouTube|Ej_rBc9sgvE|desc=Loading data, settings layer properties}} | |||
{{YouTube|iWyaBL2Krto|desc=Visualizing fringes}} | |||
{{YouTube|ioE_hHMHqKg|desc=3D raster maps (volumes) in the space}} | |||
== Ideas == | |||
* Fog support (see [http://gpwiki.org/index.php/OpenGL:Tutorials:Tutorial_Framework:Light_and_Fog], [http://www.swiftless.com/tutorials/opengl/fog.html], [http://nehe.gamedev.net/data/lessons/lesson.asp?lesson=16]) | |||
* Vertical labels (take from geonames.org point data): like in http://tev.fbk.eu/marmota/blog/?p=82 | |||
* Second interactive light source for isosurface visualization | |||
* Tick marks and coordinate values to x,y,z axis when drawing fringe | |||
<strike></strike> | |||
== Troubleshooting == | |||
* Nothing is rendered at all: | |||
: Please note that with wxGTK port of wxPython (Linux systems), a problem might appear during wxNviz initialization (nothing is rendered at all) or when rendering vectors (bad order of rendering surfaces and vectors). If you encounter such problems, try to change a depth buffer number in wxGUI Menu > Settings > Preferences > Map Display > Advanced (possible numbers are 0, 16, 24, 32). It is currently not possible to automatically find out the right number which is working for your computer. | |||
== Known issues == | |||
#List of [http://trac.osgeo.org/grass/query?status=assigned&status=new&status=reopened&order=priority&col=id&col=summary&col=status&col=owner&col=type&col=priority&col=milestone&keywords=~wxNviz open] and [http://trac.osgeo.org/grass/query?status=assigned&status=closed&order=priority&col=id&col=summary&col=status&col=owner&col=type&col=priority&col=milestone&keywords=~wxNviz closed] tickets | |||
#<strike>Adding vector data crashes wxGUI on Mac</strike> | |||
#<strike>Viewing height sometimes sets to 1 after switching to 2D and back to 3D View (or with the simultaneous 2D view - very nice feature) and even after View is reset, it keeps getting back at 1 each time the slider is touched</strike> | |||
#:Fixed in {{rev|46208}} | |||
#Adding draw, draw current and clear button may be useful | |||
#Thematic mapping is available in GRASS 7 only | |||
#Display region in 3D does not change accordingly to display region in 2D in version <= 6.5 | |||
#Appearance: | |||
## I <strike>need to click View tab to get the arrow draw, same for the scale bar </strike> | |||
##add legend > OK: nothing gets drawn in 3D but the legend shows up when I switch to 2D but when I clicked delete scalebar (which was not drawn), my surface disapeared but the legend showed up along with white and black background (which I assume was supposed to be transparent, because when I moved the legend the surface was under it - we already discussed this, it may be my problem, because it works for Michael). | |||
#General | |||
##<strike>when I go from 3D view to 2D and then back to 3D I lose most of my settings </strike> | |||
##<strike>similarly, when I add volume to Map layers I lose my view settings and the 3D view goes back to default </strike> | |||
#Volumes: | |||
##change of region by g.region seems to be ignored (or I missed something), I had to restart GRASS with the new region to get the 3D region for volumes right. Given that the default top, botom is 1,0, if GRASS starts with the default 3D region settings volumes do not work because there is just one level. | |||
##<strike>isosurfaces work with my terrestrial lidar data but the slices don't, it seems that it is due my resolution being 0.3m, when I change it to 1m I get at least some limited slicing | |||
###this may be in ogsf becuase slices in nviz do not work with this data either </strike> | |||
#<strike>changing color to constant did not change the color of the isosurface</strike> | |||
== Comparison of Tcl/Tk nviz and wxNviz functionality == | |||
What is missing in wxNviz: | |||
* scaled difference | |||
* lighting - follow surface viewpoint | |||
* keyframe animation | |||
* text rendering (in OpenGl) | |||
What is working only partially: | |||
* legend, labels | |||
* thematic mapping - nviz allows to choose also icon and multiple classification | |||
* basic support of animations | |||
What is new in wxNviz: | |||
* it is possible to change view more interactively using mouse | |||
Notes: | |||
* Scripting functionality is replaced by m.nviz.image module | |||
* wxNviz state is saved in workspace | |||
== Google Summer of Code == | |||
=== [[wxNviz GSoC 2008|2008]] === | |||
* [http://trac.osgeo.org/grass/wiki/SoCProjects#wxNvizdevelopmentforenhanced34Dvisualizationandanalysis Accepted Google Summer of Code 2008 project] | |||
=== [[wxNviz GSoC 2010|2010]] === | |||
* [http://trac.osgeo.org/grass/wiki/SoCProjects#wxNvizdevelopmentforenhanced34Dvisualizationandanalysis Accepted Google Summer of Code 2010 project] | |||
=== [[wxNviz GSoC 2011|2011]] === | |||
* [http://trac.osgeo.org/grass/wiki/SoCProjects#CompletionofwxGUINvizextensionfor3DdatavisualizationinGRASSGIS Accepted Google Summer of Code 2011 project] | |||
== See also == | |||
* http://lists.osgeo.org/pipermail/grass-dev/2008-February/035792.html | |||
{{WxGUI}} | |||
[[Category:NVIZ]] | |||
[[Category:Visualization]] | |||
Latest revision as of 10:56, 4 December 2018
(Back to wxGUI page.)
wxNviz is a wxGUI extension which allows users to realistically render multiple surfaces (raster data) in a 3D space, optionally using thematic coloring, draping 2D vector data over the surfaces, displaying 3D vector data in the space, and visualization of volume data (3D raster data).
For usage instructions, see also the manual page.
Screenshots
-
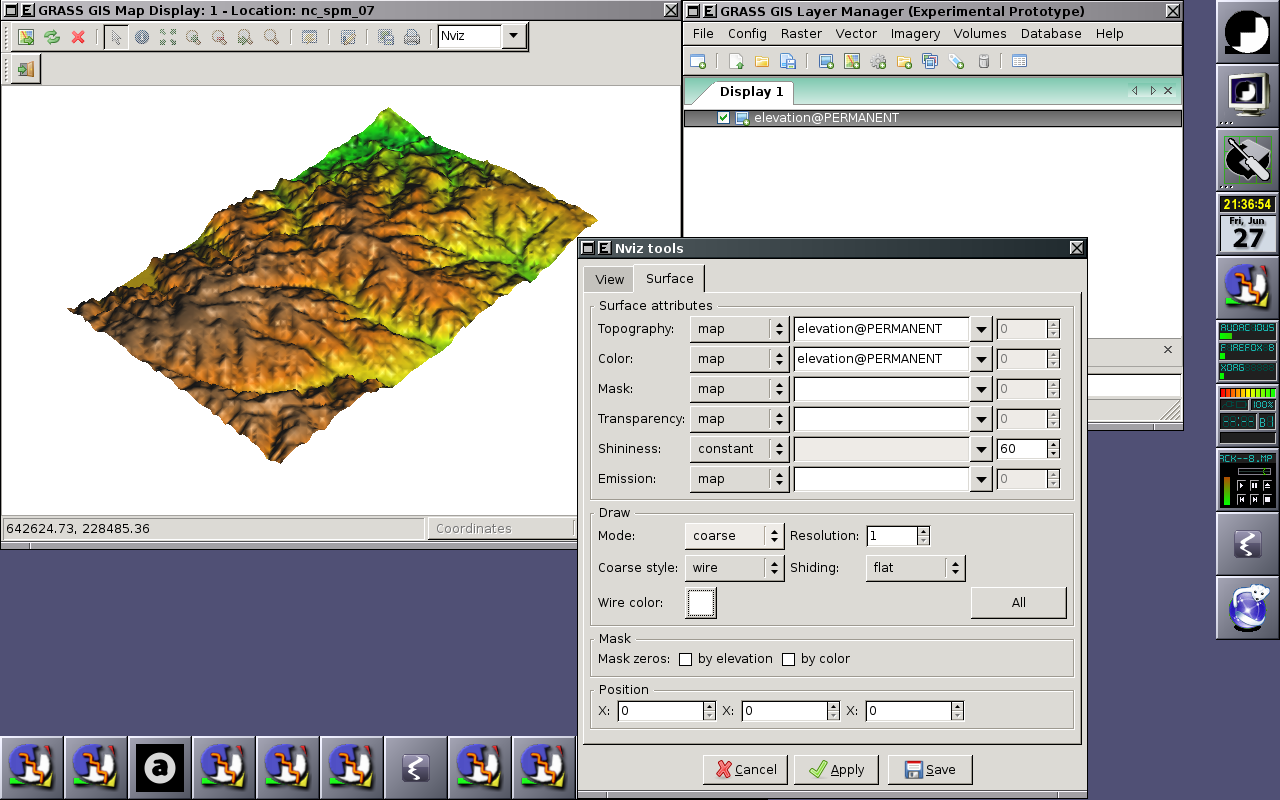
2008-06-27: Display raster map from layer tree in 2.5D (surface)
-
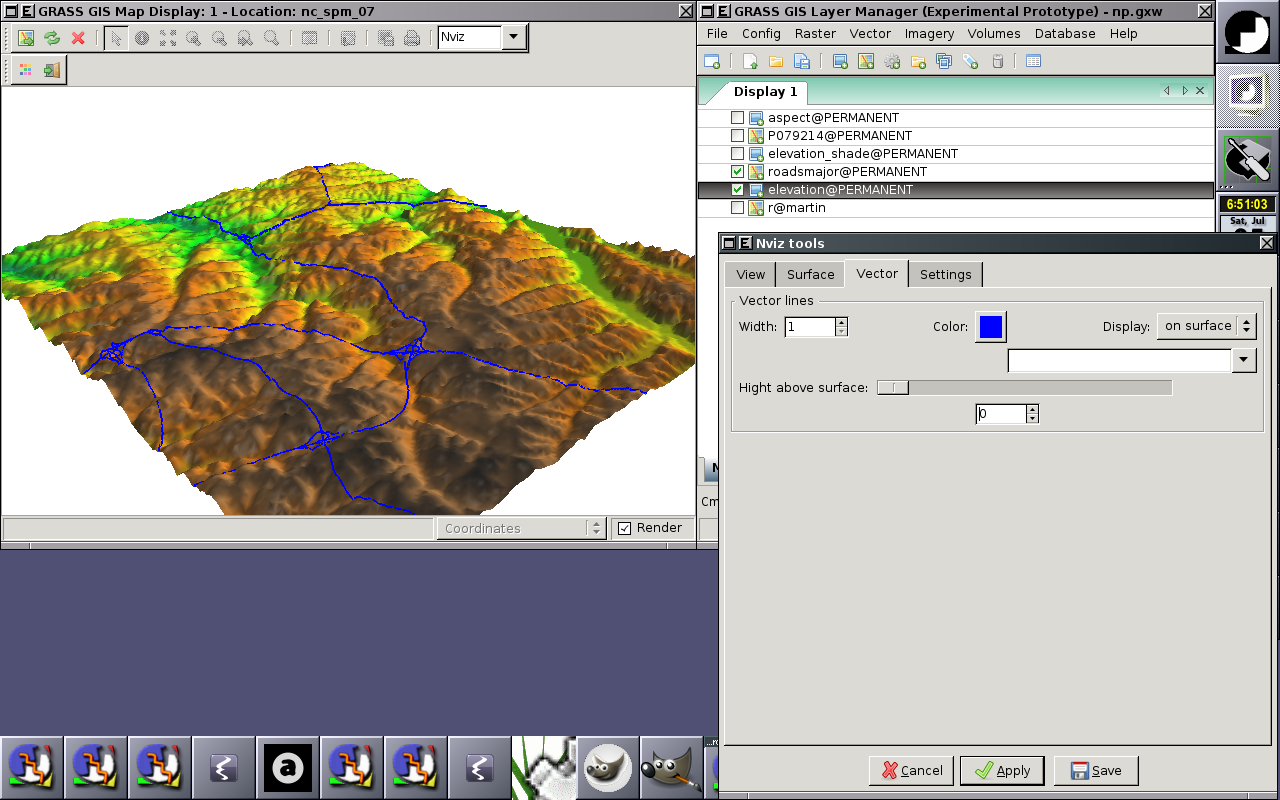
2008-07-05: Support for vector data (2D lines) added
-
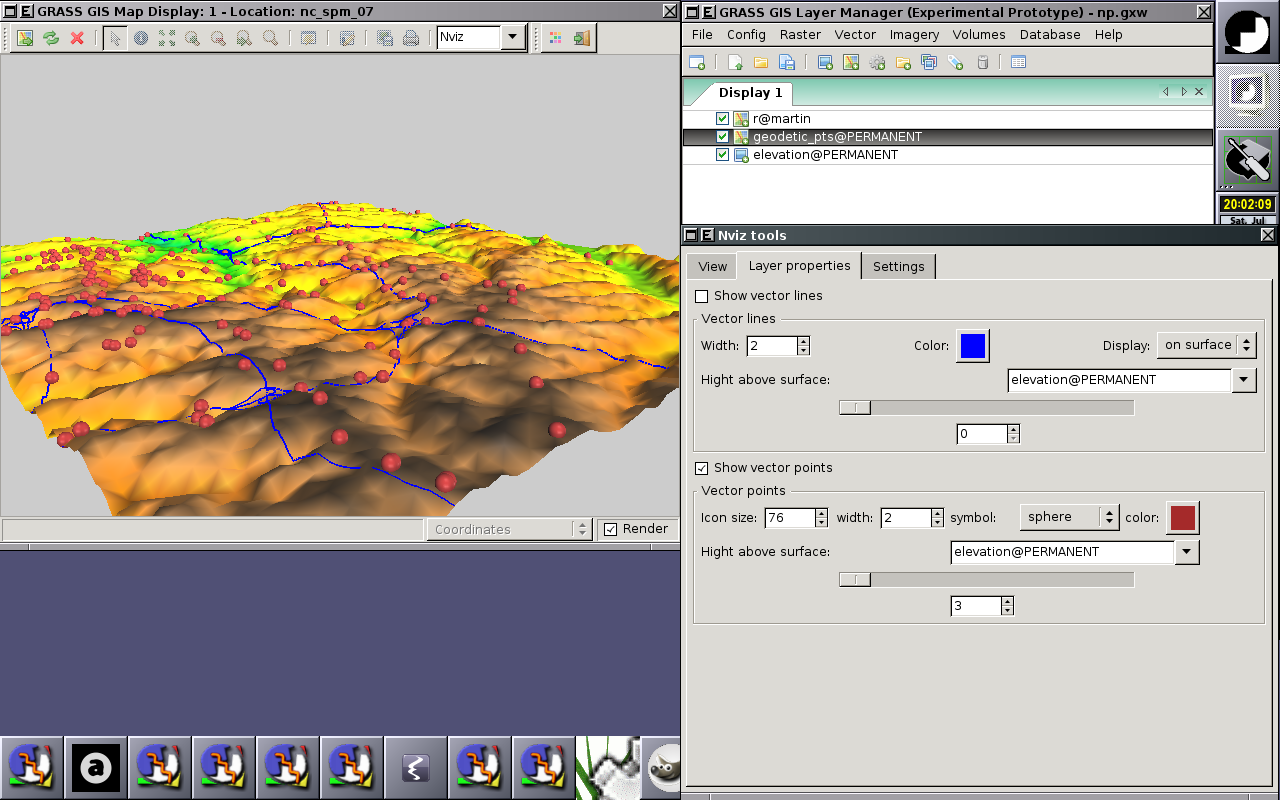
2008-07-26: Support for vector point data
-
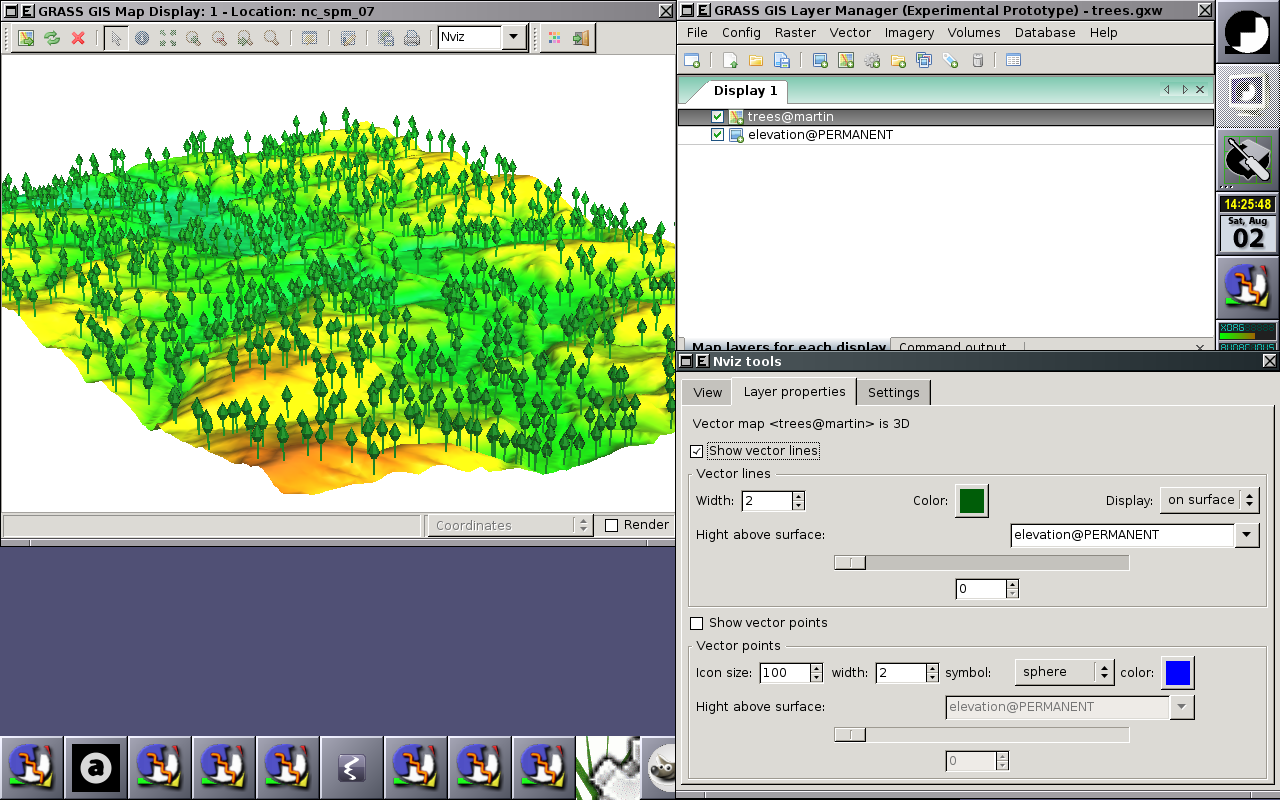
2008-08-02: 3D vector data support
-
2008-08-09: Initial support for volumetric data
-
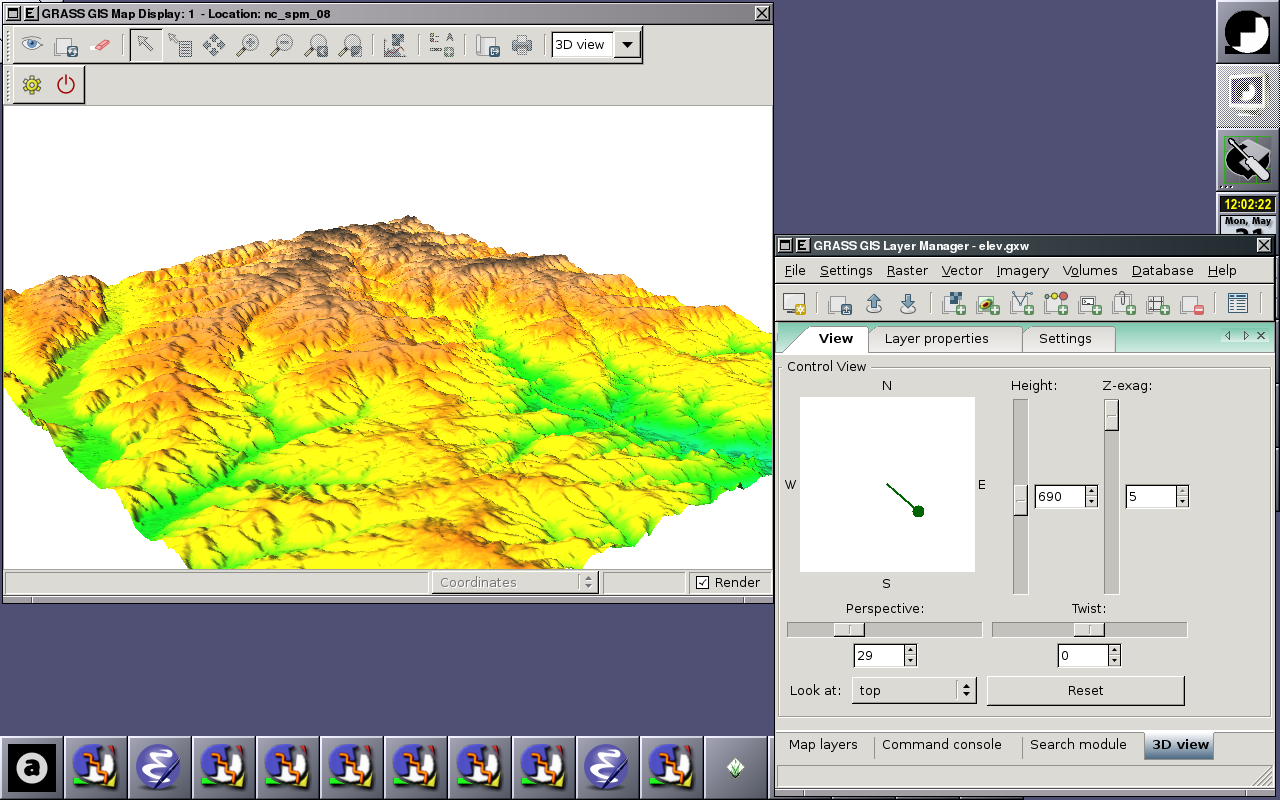
2010-05-31: 3D view tools window integrated into Layer Manager
-
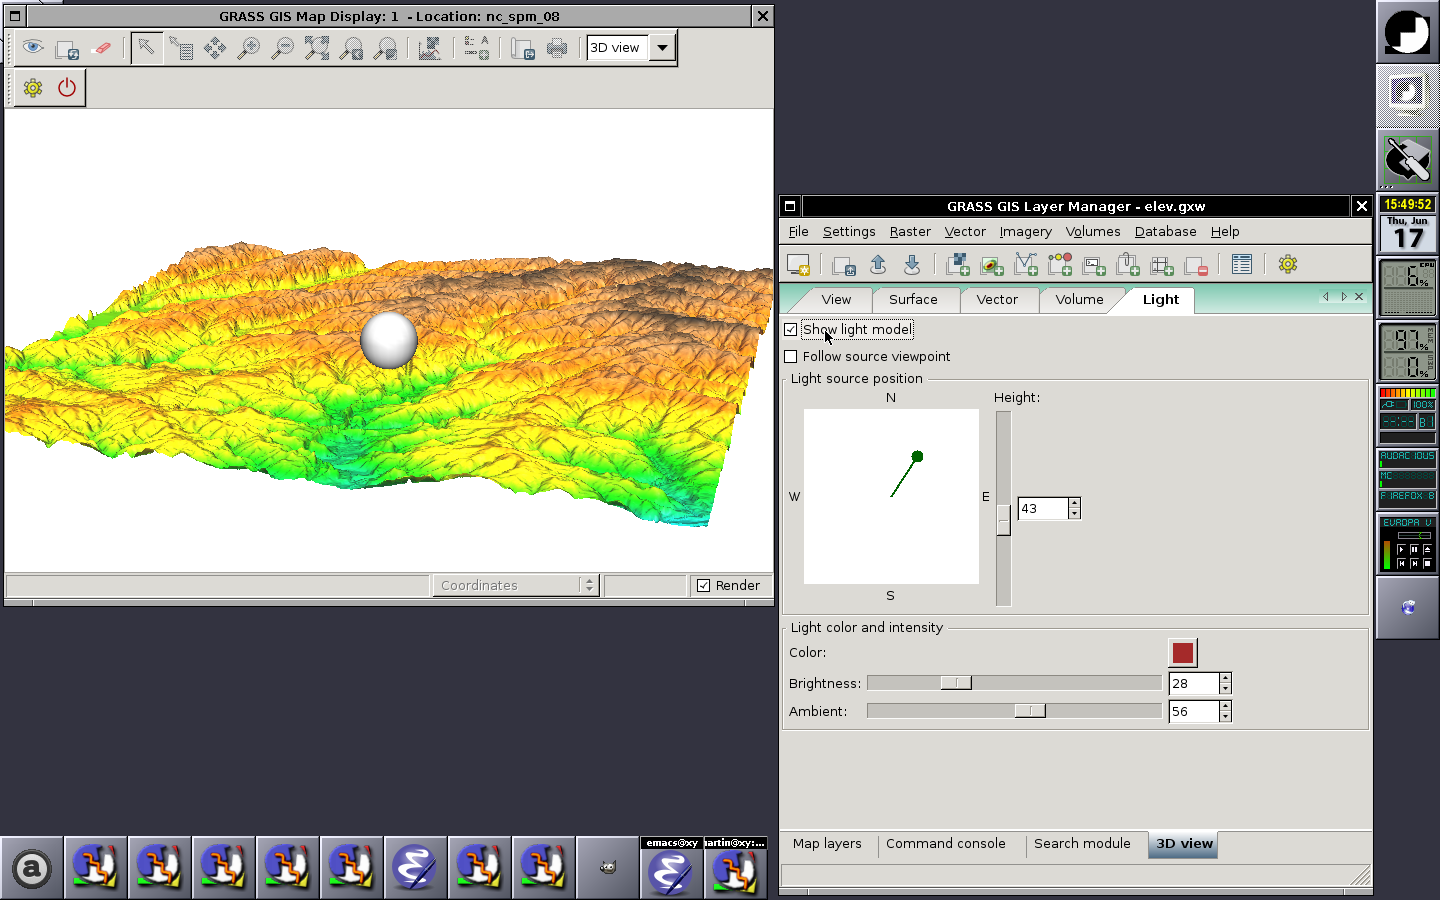
Lighting control panel in Layer Manager (2010-06-17)
-
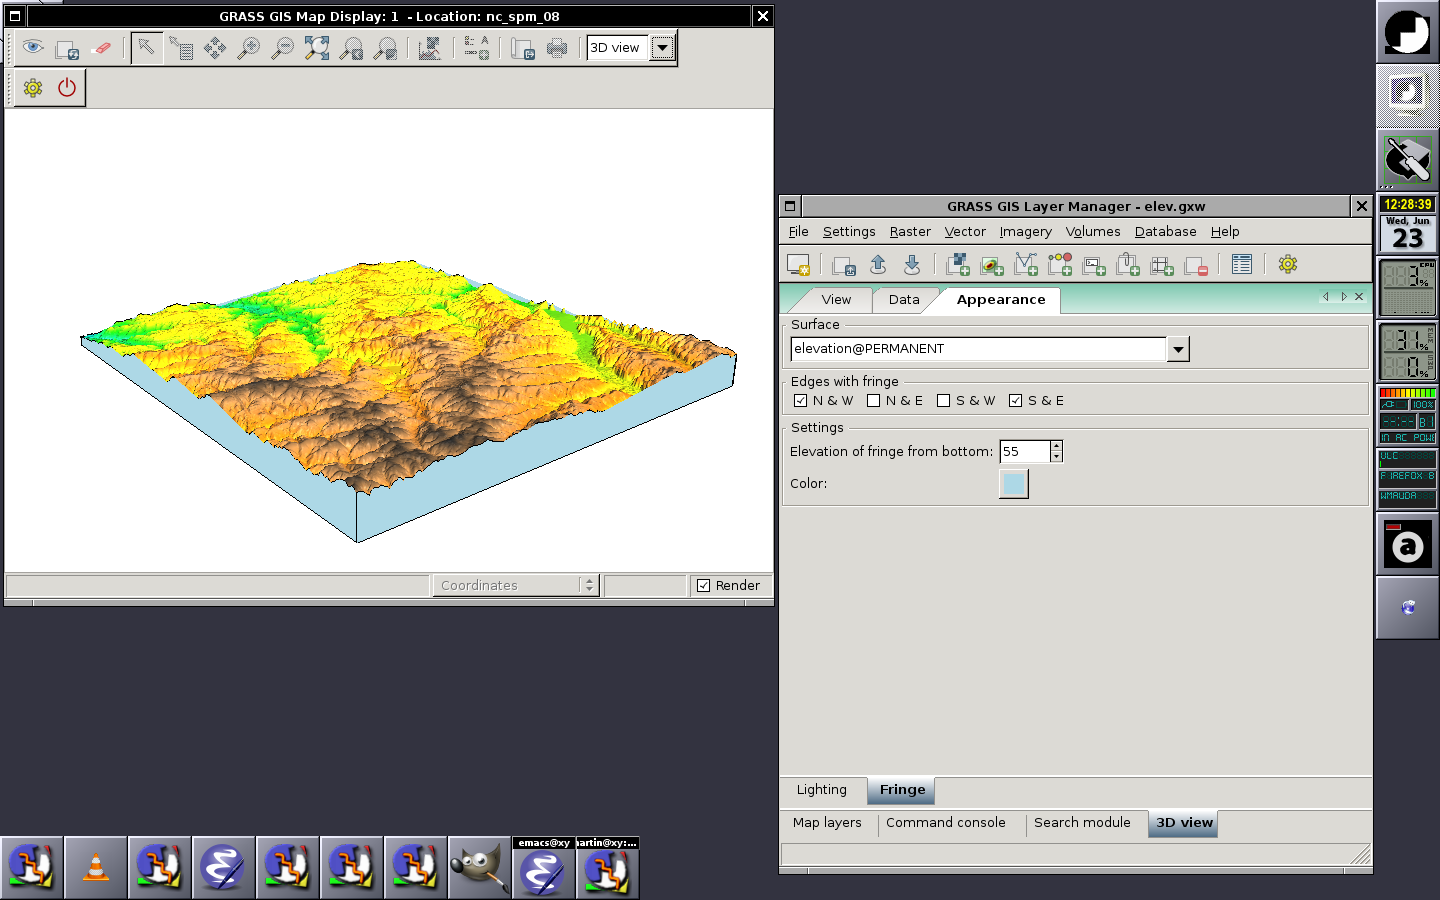
Fringe control panel in Layer Manager (2010-06-23)
-
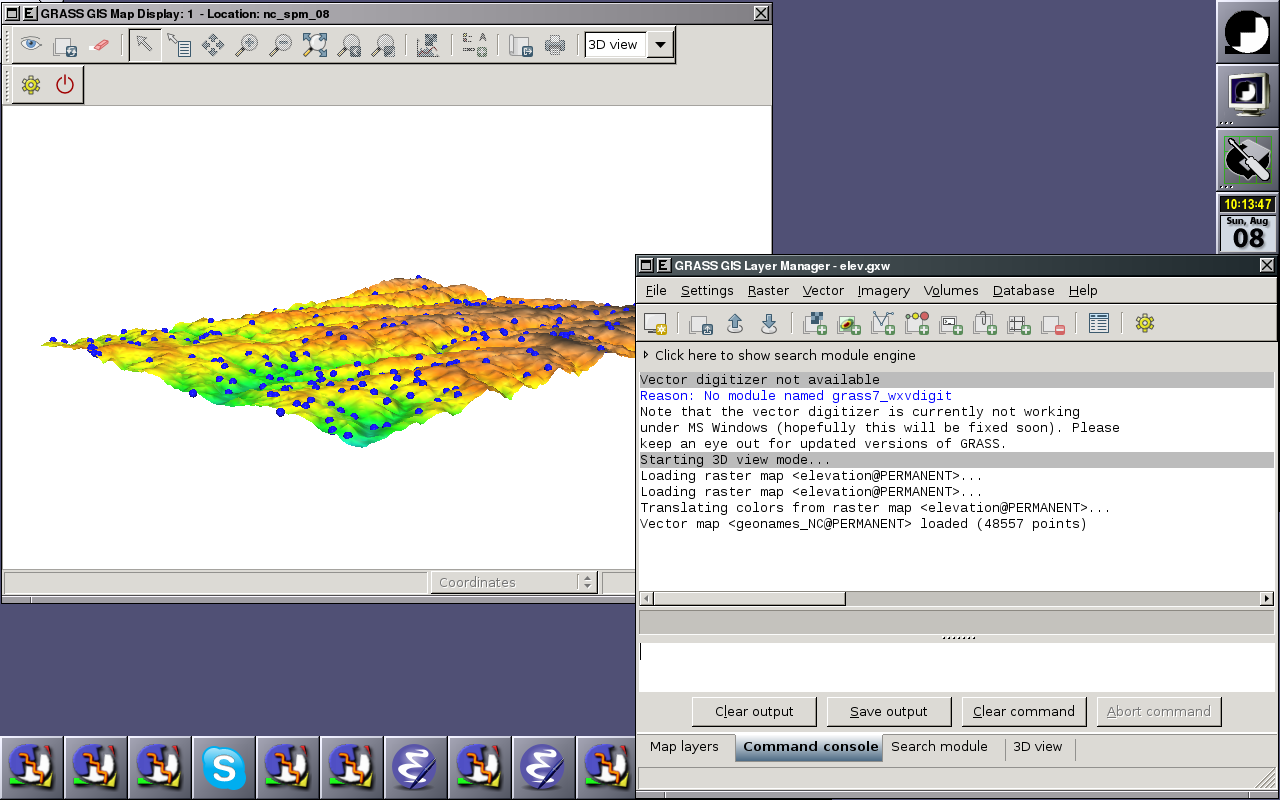
Redirect messages to wxGUI (2010-08-08)
-
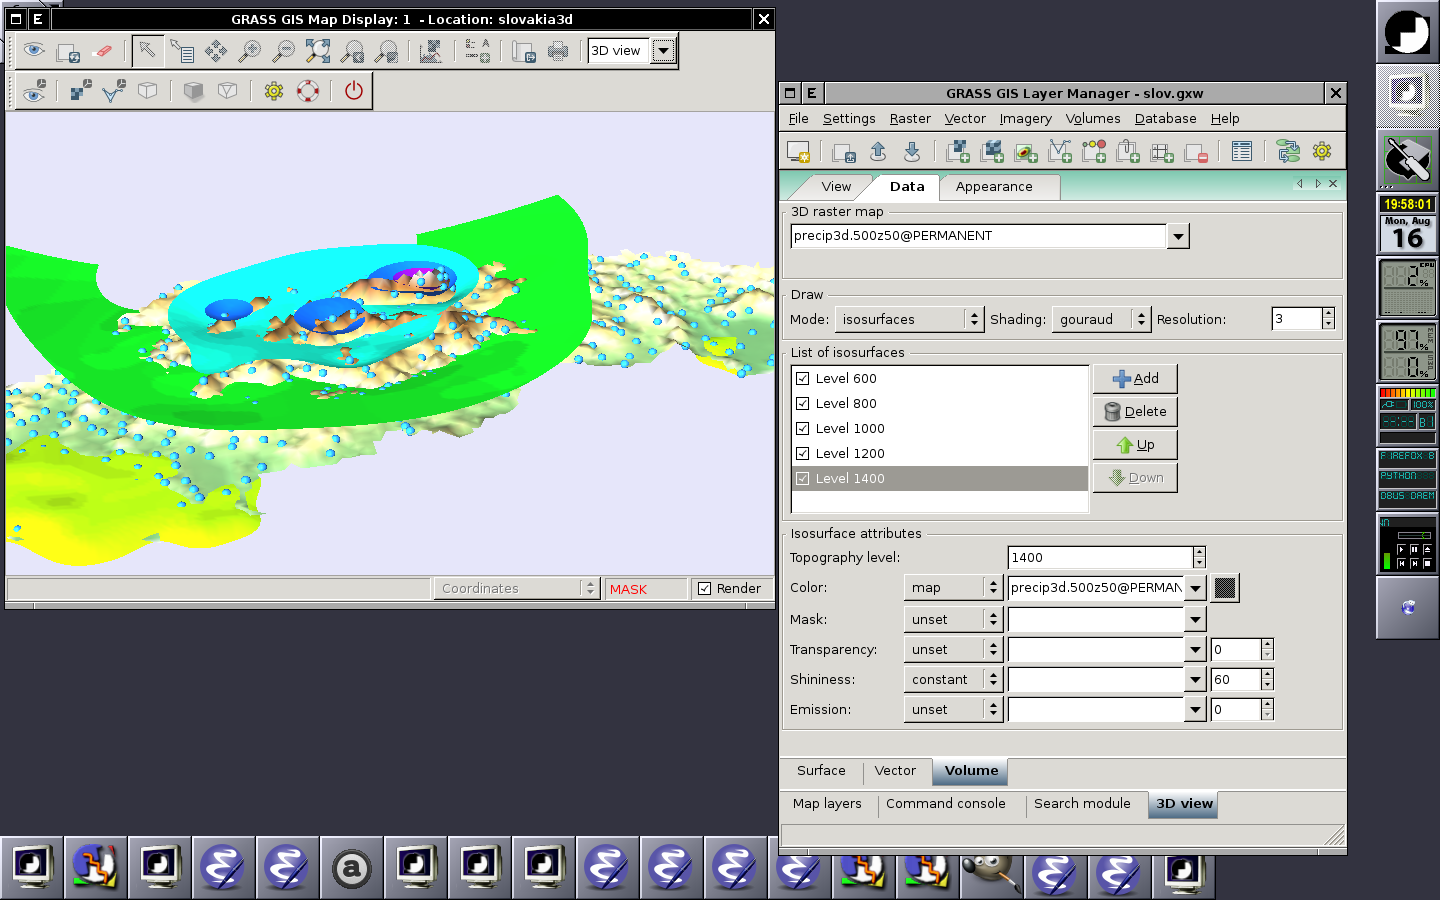
Displaying raster (surface), 2D vector and 3D raster (volume) in the 3D space (2010-08-16)
-
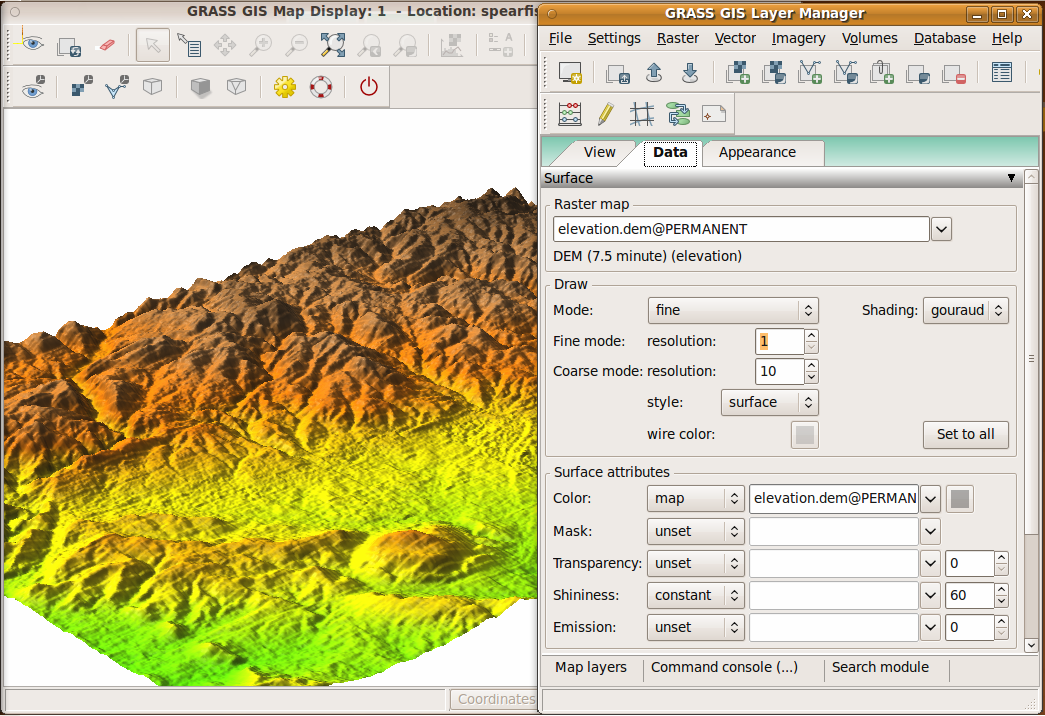
Surface page of WxNviz modified (2011-06-02)
-
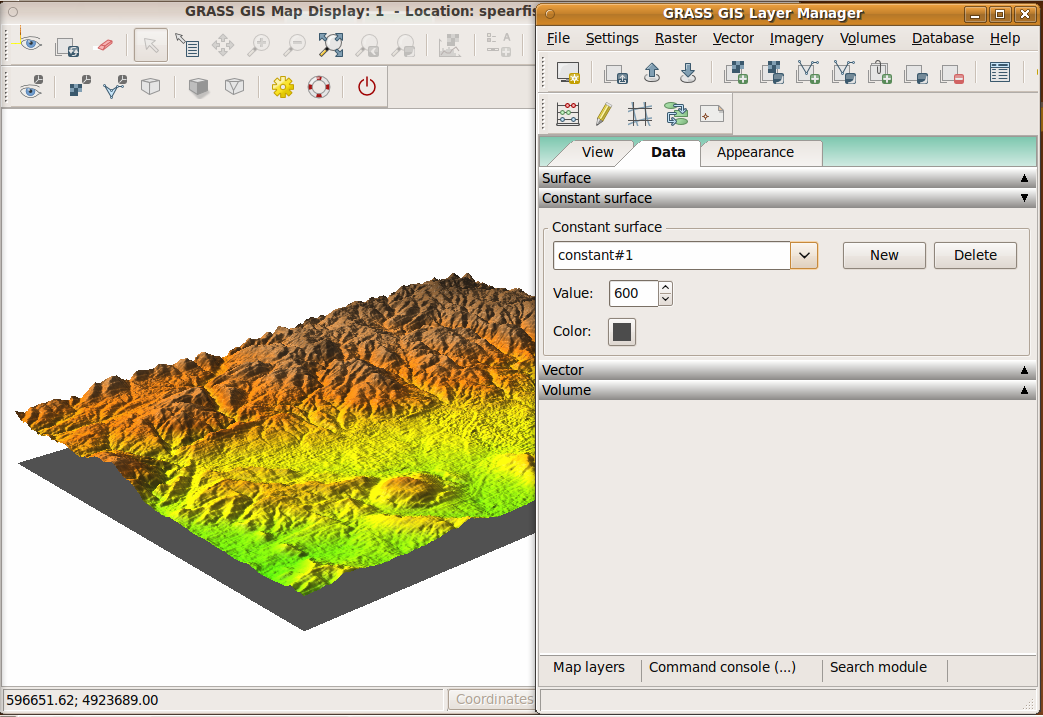
Constant surface page added (2011-06-02)
-
Lighting fixed (2011-05-02)
-
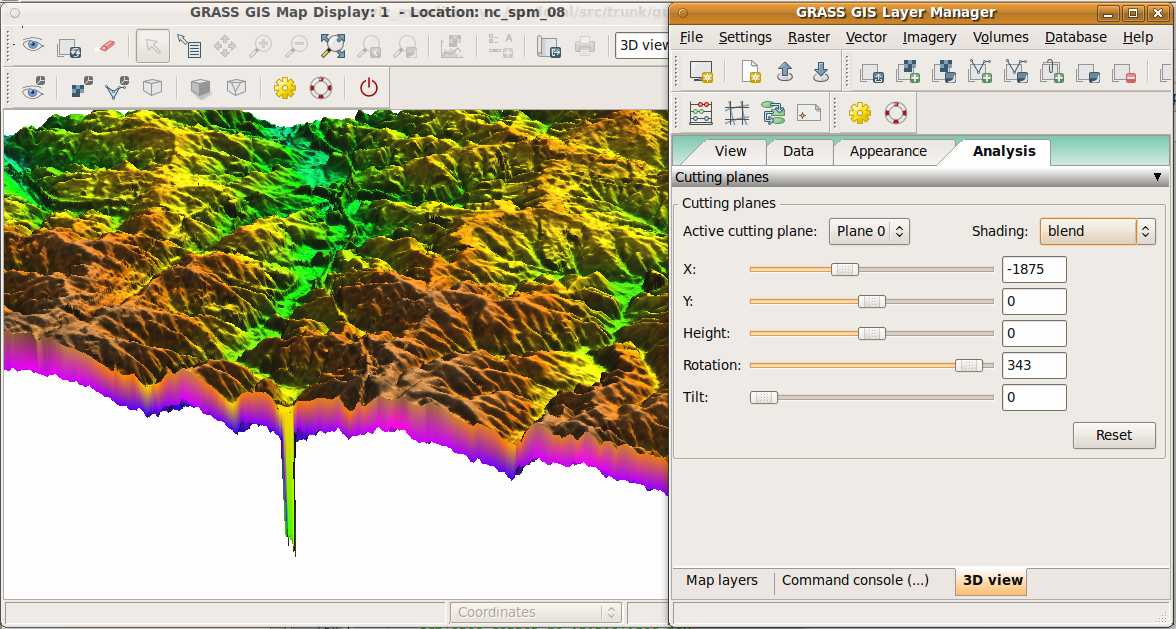
Cutting planes (shading blend) (2011-06-10)
-
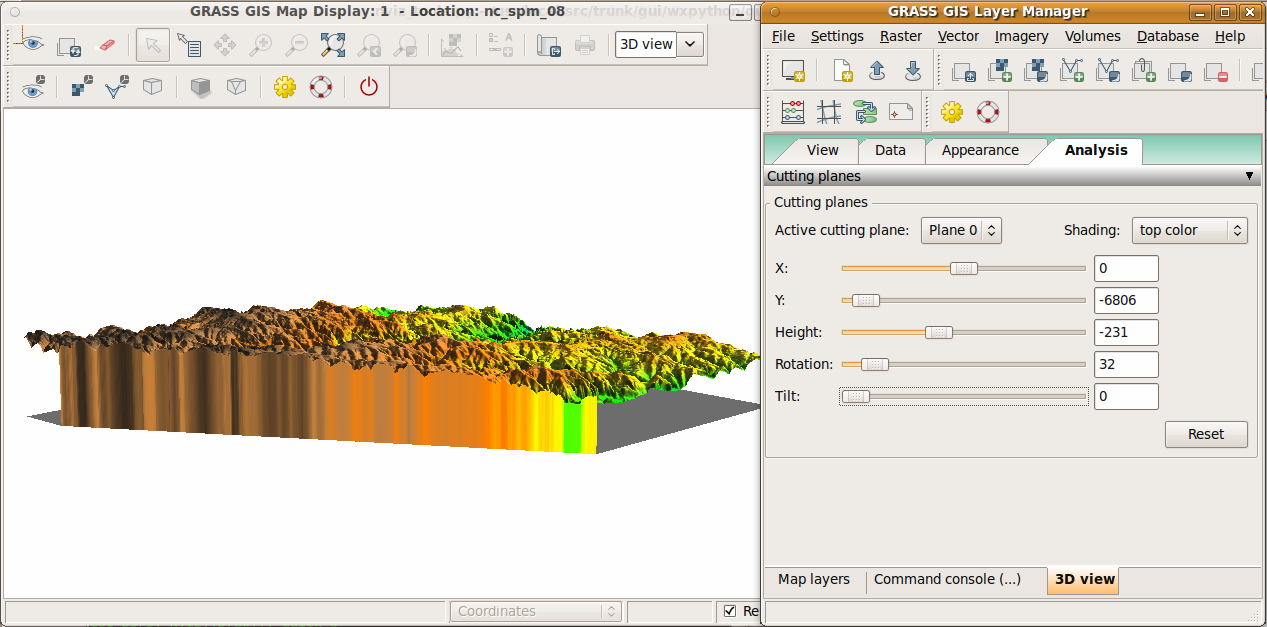
Cutting planes (shading top color) (2011-06-10)
-
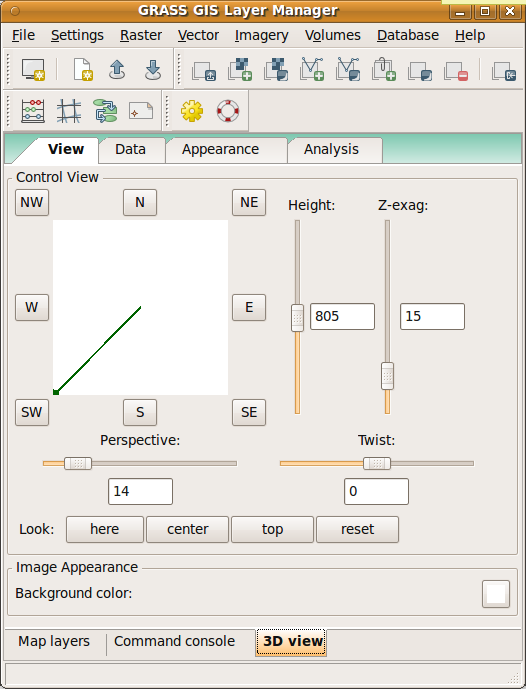
View page modified (2011-06-10)
-
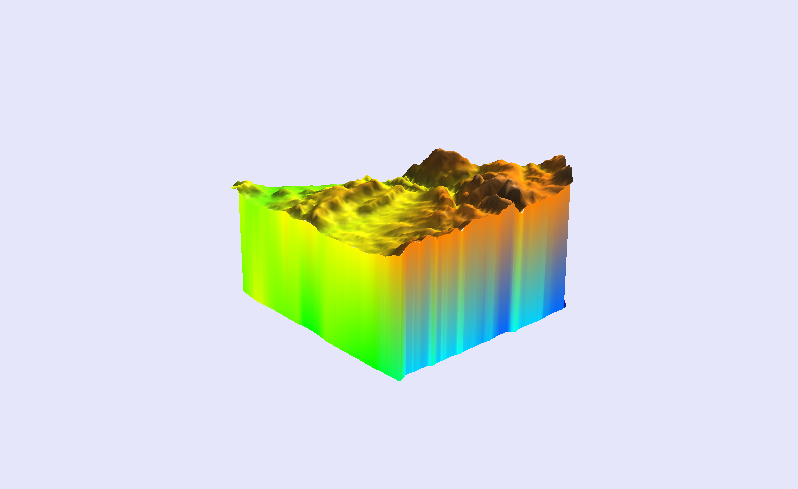
Picture of surfaces cut by two planes (generated by nviz_cmd) (2011-06-30)
-
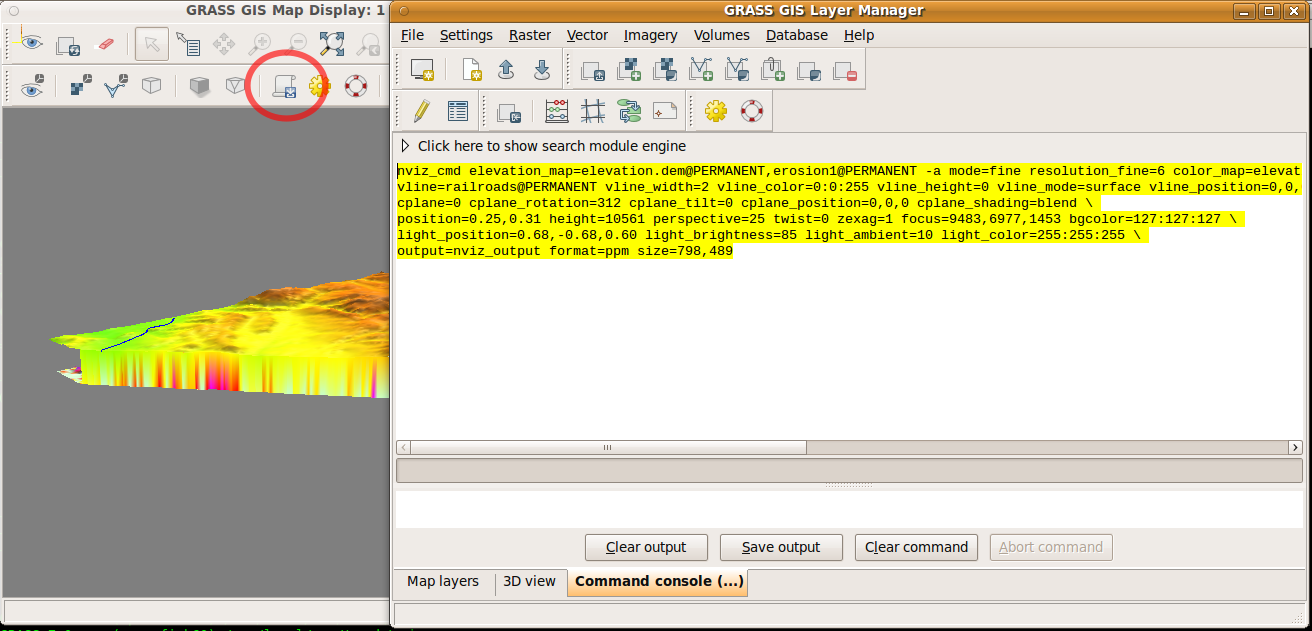
Command for nviz_cmd generated by wxNviz (2011-07-01)
-
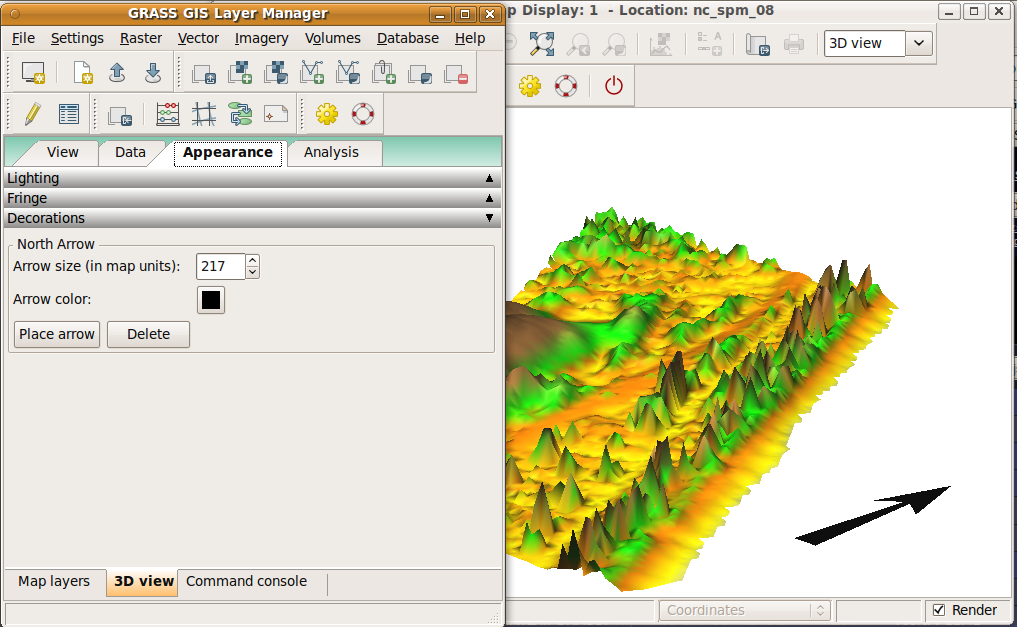
North Arrow implemented (2011-07-08)
-
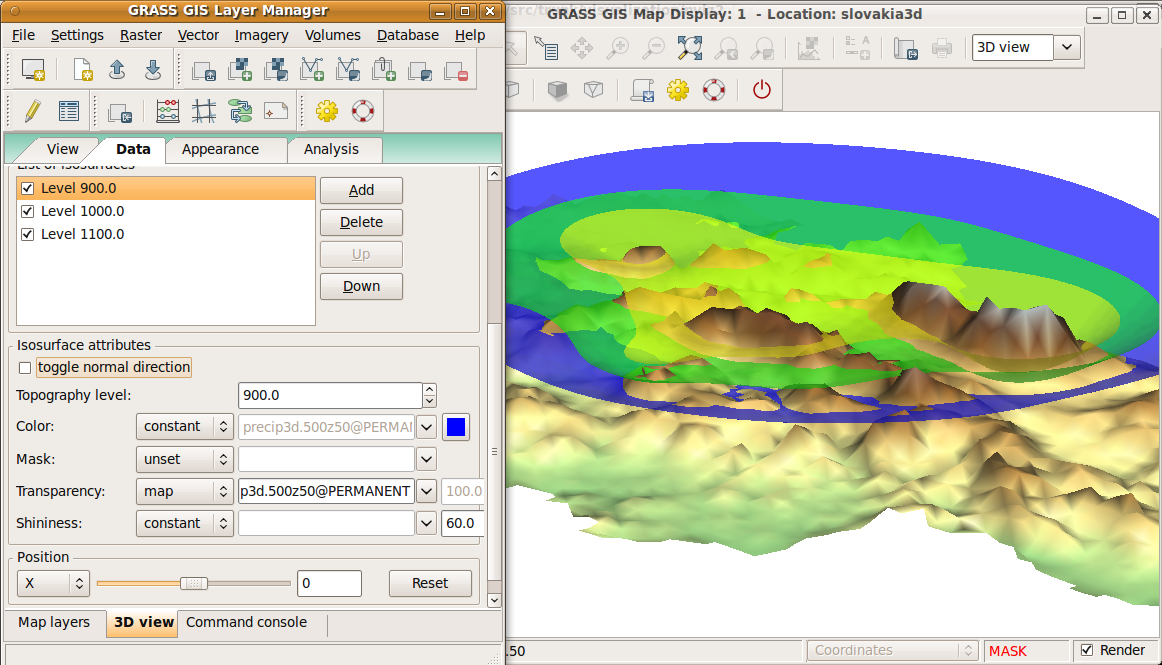
Colored isosurfaces with transparency (2011-07-08)
-
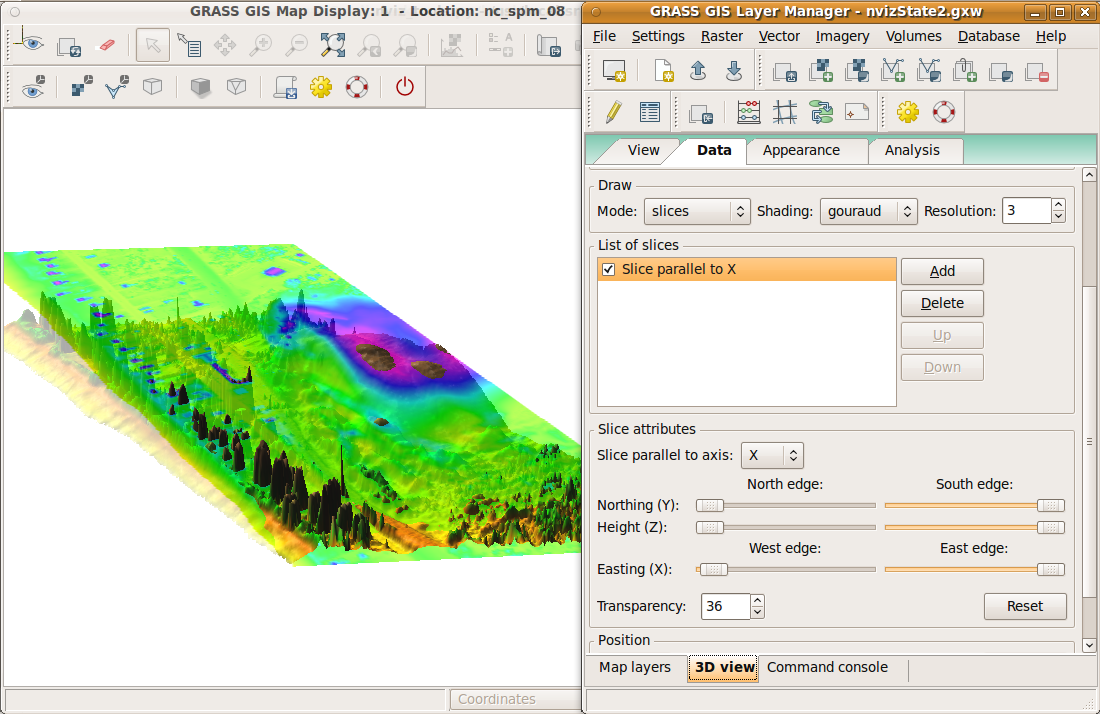
Partially transparent slice (2011-07-14)
-
Combination of slices and isosurface (2011-07-14)
-
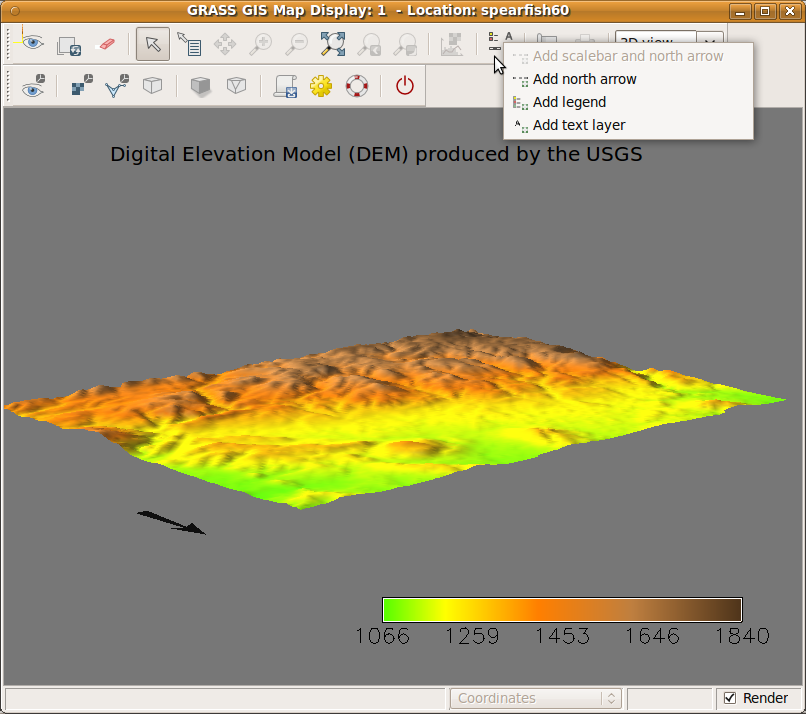
Raster legend, text label and north arrow (2011-07-22)
-
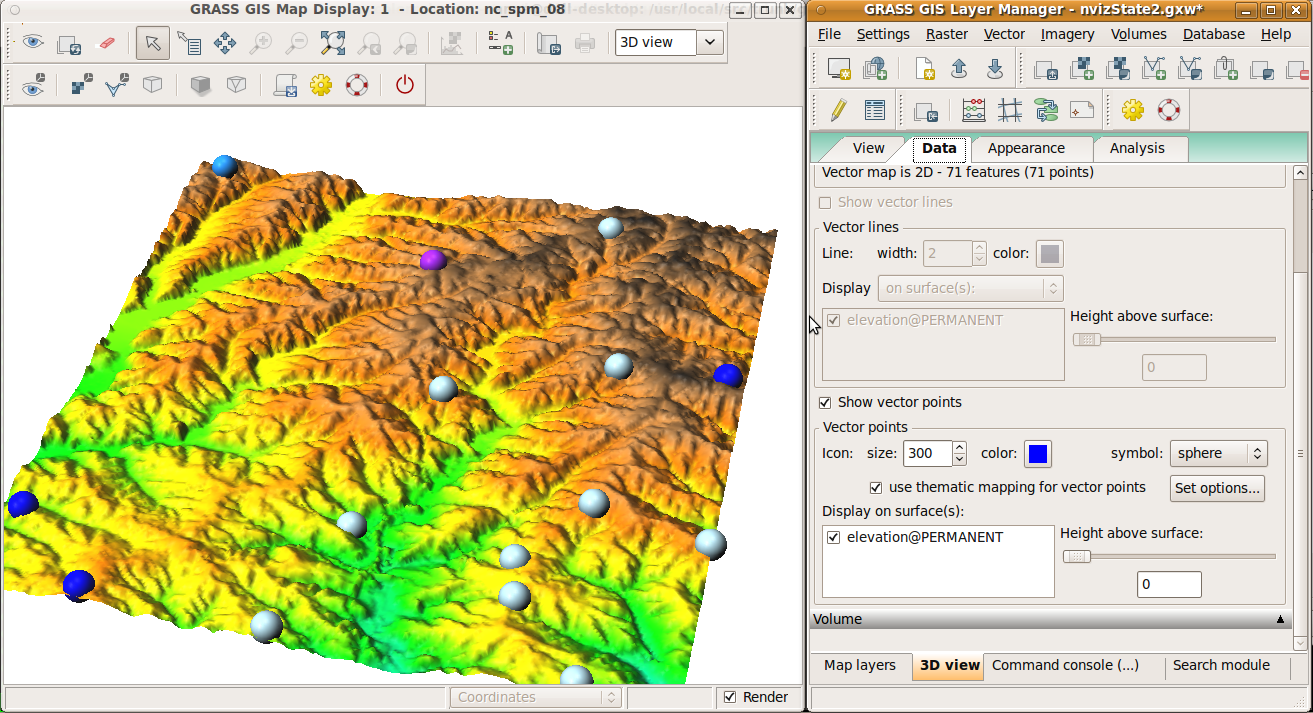
Thematic mapping (colors) for points (2011-08-05)
-
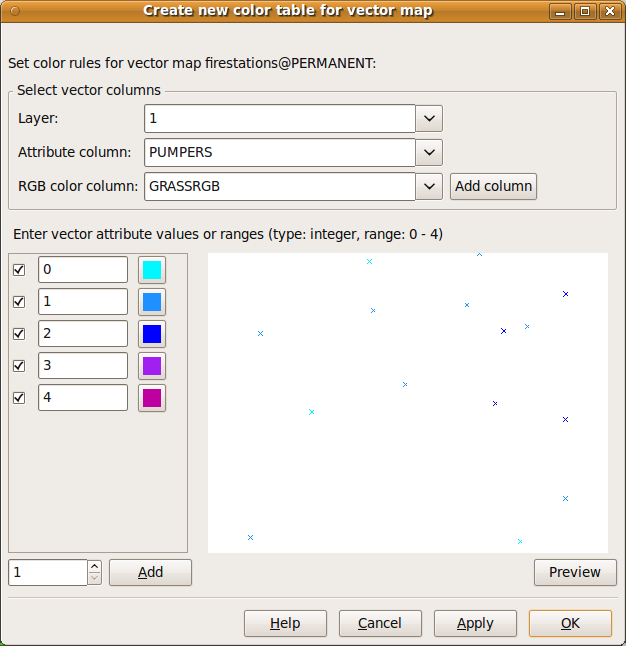
Dialog for v.colors opened from 3D view (2011-08-05)


Animations
Video tutorials
Older tutorials (2010)
Ideas
- Fog support (see [1], [2], [3])
- Vertical labels (take from geonames.org point data): like in http://tev.fbk.eu/marmota/blog/?p=82
- Second interactive light source for isosurface visualization
- Tick marks and coordinate values to x,y,z axis when drawing fringe
Troubleshooting
- Nothing is rendered at all:
- Please note that with wxGTK port of wxPython (Linux systems), a problem might appear during wxNviz initialization (nothing is rendered at all) or when rendering vectors (bad order of rendering surfaces and vectors). If you encounter such problems, try to change a depth buffer number in wxGUI Menu > Settings > Preferences > Map Display > Advanced (possible numbers are 0, 16, 24, 32). It is currently not possible to automatically find out the right number which is working for your computer.
Known issues
- List of open and closed tickets
Adding vector data crashes wxGUI on MacViewing height sometimes sets to 1 after switching to 2D and back to 3D View (or with the simultaneous 2D view - very nice feature) and even after View is reset, it keeps getting back at 1 each time the slider is touched- Fixed in r46208
- Adding draw, draw current and clear button may be useful
- Thematic mapping is available in GRASS 7 only
- Display region in 3D does not change accordingly to display region in 2D in version <= 6.5
- Appearance:
- I
need to click View tab to get the arrow draw, same for the scale bar - add legend > OK: nothing gets drawn in 3D but the legend shows up when I switch to 2D but when I clicked delete scalebar (which was not drawn), my surface disapeared but the legend showed up along with white and black background (which I assume was supposed to be transparent, because when I moved the legend the surface was under it - we already discussed this, it may be my problem, because it works for Michael).
- I
- General
when I go from 3D view to 2D and then back to 3D I lose most of my settingssimilarly, when I add volume to Map layers I lose my view settings and the 3D view goes back to default
- Volumes:
- change of region by g.region seems to be ignored (or I missed something), I had to restart GRASS with the new region to get the 3D region for volumes right. Given that the default top, botom is 1,0, if GRASS starts with the default 3D region settings volumes do not work because there is just one level.
isosurfaces work with my terrestrial lidar data but the slices don't, it seems that it is due my resolution being 0.3m, when I change it to 1m I get at least some limited slicingthis may be in ogsf becuase slices in nviz do not work with this data either
changing color to constant did not change the color of the isosurface
Comparison of Tcl/Tk nviz and wxNviz functionality
What is missing in wxNviz:
- scaled difference
- lighting - follow surface viewpoint
- keyframe animation
- text rendering (in OpenGl)
What is working only partially:
- legend, labels
- thematic mapping - nviz allows to choose also icon and multiple classification
- basic support of animations
What is new in wxNviz:
- it is possible to change view more interactively using mouse
Notes:
- Scripting functionality is replaced by m.nviz.image module
- wxNviz state is saved in workspace