Wx.stream GSoC 2011: Difference between revisions
m (url update) |
|||
| (19 intermediate revisions by 2 users not shown) | |||
| Line 8: | Line 8: | ||
Title: Graphical User Interface for the hydrological tools r.stream* in GRASS GIS | Title: Graphical User Interface for the hydrological tools r.stream* in GRASS GIS | ||
'''The module is currently on maintenance''' | |||
== Aim of the project == | == Aim of the project == | ||
| Line 15: | Line 17: | ||
== Dependencies == | == Dependencies == | ||
r.stream.* modules | r.stream.* modules, see also [[R.stream.*]] | ||
== Bulletin Board == | == Bulletin Board == | ||
| Line 74: | Line 76: | ||
== Documentation == | == Documentation == | ||
The purpose of this GUI is to allow user to access at hydrological modeling in GRASS 7 in a intuitive way. | |||
It is a GUI for the r.stream modules [[R.stream.*]], implemented by Jarek Jasiewicz and Markus Metz. These modules perform stream extraction, ordering (Strahler's order, Horton's original order, Shreve's magnitude, Hack's or Gravelius' stream hierarchy), basin delineation according to user's rules, distance to streams, distance above stream, distance to outlet (width function), etc.. As a further development,in the GUI will be also implemented a module to extract automatically the "optimal" threshold for channel initialization [http://svn.osgeo.org/grass/grass-addons/grass7/raster/r.threshold/] and another one to generate the main morphometric parameters of the basin (that is currently only available for GRASS 6.5 [http://grass.osgeo.org/wiki/GRASS_AddOns#r.basin]). | |||
The GUI is organized in modular way and the first implementation is for stream extraction. The parameters are: | |||
* DEM (required); | |||
* Flow accumulation: this can be optionally generated by the GUI using single or multiple flow direction algorithm, or custom, this means that user can generate it before and insert it as input; | |||
* Threshold for channel initialization. | |||
The outputs are: | |||
* Flow direction; | |||
* Streams (raster); | |||
* Streams (vector). | |||
[[File:Screenshot-9.png|600px|thumb|center|rstream GUI - First step]] | |||
Once filled the fields, user can choose either to run immediately the analysis, pushing the "Run" button, or to see the result of the analysis on a small part of the region, pushing the "Update Preview" button. | |||
This latter raises a message asking user to select the centre of the preview on the canvas. | |||
[[File:Screenshot-10.png|600px|thumb|center|rstream GUI - Second step]] | |||
The OK button raises a new canvas, on which is possible to select the coordinates. The button "Get coordinates" switches the control on the canvas and wait for a mouse click. After that, coordinates are shown on the widget. | |||
[[File:Screenshot-11.png|600px|thumb|center|rstream GUI - Third step]] | |||
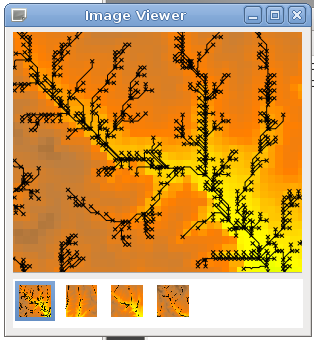
When selection is done, the "Preview" button raises an image slider on which the preview is shown. The preview represents the result of the stream extraction analysis. If user wants to generate more previews, they are added at the image slider. | |||
[[File:ImgViewer.png|thumb|center|rstream GUI - Image Viewer]] | |||
== Updated Timeline == | == Updated Timeline == | ||
| Line 82: | Line 114: | ||
* 1 Aug - 15 Aug : testing | * 1 Aug - 15 Aug : testing | ||
* Final goal: working GUI for grass7 | * Final goal: working GUI for grass7 | ||
== How to test == | |||
Note: {{twiki|DownloadSource#GRASS7|GRASS 7}} required. | |||
Download r.stream.* modules: | |||
svn co http://svn.osgeo.org/grass/grass-addons/grass7/raster/r.stream.extract/ | |||
svn co http://svn.osgeo.org/grass/grass-addons/grass7/raster/r.stream/ | |||
Compile them, then run: | |||
g.extension -s extension=wx.stream | |||
File -> GSoC testing -> RStream | |||
== Weekly Reports, from SoC mailing list == | == Weekly Reports, from SoC mailing list == | ||
| Line 93: | Line 141: | ||
* Week 7 Report (8 Jul) http://lists.osgeo.org/pipermail/soc/2011-July/001466.html | * Week 7 Report (8 Jul) http://lists.osgeo.org/pipermail/soc/2011-July/001466.html | ||
* Week 8 Report (15 Jul) http://lists.osgeo.org/pipermail/soc/2011-July/001491.html | * Week 8 Report (15 Jul) http://lists.osgeo.org/pipermail/soc/2011-July/001491.html | ||
* Week 9 Report (22 Jul) http://lists.osgeo.org/pipermail/soc/2011-July/001519.html | |||
* Week 10 Report (29 Jul) http://lists.osgeo.org/pipermail/soc/2011-July/001527.html | |||
* Week 11 Report (5 Aug) http://lists.osgeo.org/pipermail/soc/2011-August/001551.html | |||
* Week 12 Report (12 Aug) http://lists.osgeo.org/pipermail/grass-dev/2011-August/055317.html | |||
* Week 13 Report (19 Aug) http://lists.osgeo.org/pipermail/grass-dev/2011-August/055435.html | |||
== References == | == References == | ||
Latest revision as of 16:11, 26 January 2013
Wx.stream
Student: Margherita Di Leo (Madi)
Mentor: Jarek Jasiewicz
Organization: OSGeo - Open Source Geospatial Foundation
Title: Graphical User Interface for the hydrological tools r.stream* in GRASS GIS
The module is currently on maintenance
Aim of the project
In GRASS GIS new modules suitable for hydrological analysis have been developed, namely r.stream*. My idea is to develop a wxpython GUI (see wxGUI) for r.stream* that allows to see the preview of the hydrological analysis over a part of a map and then decide if apply the analysis or not. It will include "multiple previews". Every result can be saved as an image and set of parameters for future use in additional "preview windows", next choose from group of possible parameters that which is most suitable.
Dependencies
r.stream.* modules, see also R.stream.*
Bulletin Board
- First draft of main r.stream GUI
I thought to add in Map display a button that allows to select a point on the DEM that will be the center of the preview. So the region is determined by the script and not by the user. This can avoid the warning message for the user if the region selected is too big.
Selecting the point on DEM raises a window with different tabs. Each tab corresponds to a r.stream command. In each tab there are text boxes in which user inserts parameters required to run the command. Below them, there are the following buttons:
- "Preview" Button : it generates the preview. The previews are visible on the right side of the panel. Passing the mouse over the previews shows the command line and so the parameters' values, just like menu items in main GUI.
- "Change Point" Button : it switches on the map display and allows the user to change the center of the preview window.
- "Apply" Button : it applies the analysis over the map on basis of the selected preview. If no preview is selected it applies the last generated. If no preview has been generated it simply applies the command as it is.
- "Close" Button : it closes the window.
Please feel free to discuss and comment my idea.
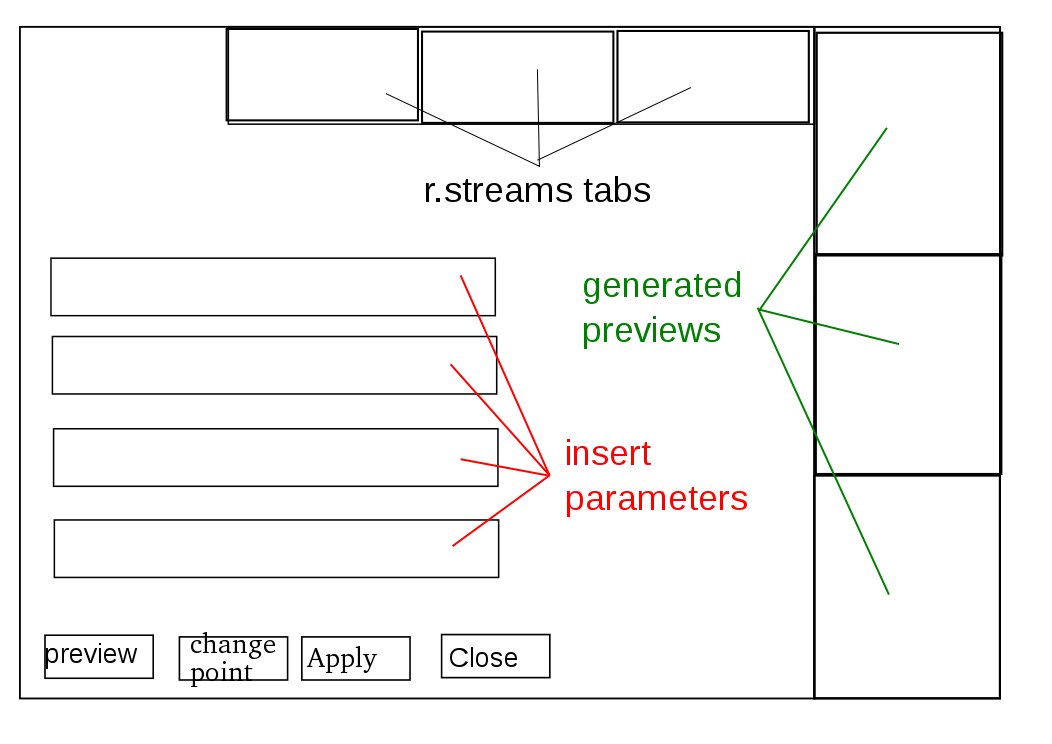
- Previous design
I thought hydrological analysis by GUI has to be organized in two steps:
- In the first step, a simple GUI pops up, asking for the main maps that user should provide. First of all, DEM on which analysis should be carried out. Also, it asks for flow direction and flow accumulation, that are the basis of further hydrological analysis. In fact user can either provide them already done by for instance another software, or create them using GRASS. In the latter case, user should indicate the name of new maps to be created and also he can choose the flow routing algorithm (default is MFD i.e. multiple flow direction). It is also possible to add Mask map (optional). This latter is useful to weight accumulation map in order to improve stream extraction.
IMHO this previous step is necessary in order to generate the preview fastly and also because stream extraction preview needs the accumulation map generated on the whole area and not only on the small region selected (stream network may vary). The "hello world" of this first step GUI is available on my brand new github repository [0]

- Once the user has provided these information, the elaboration starts if user asked to calculate flow direction and flow accumulation and the main GUI pops up, asking for further detailed analysis, for which the preview tool should be available. (see above "Draft of main r.stream GUI")
- Design updated Friday 17 June
There will be probably no need of first time step window. GUI is designed to be divided into tabs. Analysis starts in tab 1, that is stream network extraction. Also, in the first tab should run r.stream.order (result is ordered network. This should be optional, it's required only if user wants to run further analysis in tab 2) and r.stream.basin (resulting map is the basin delineation. This should be optional, it's required only if user wants to run further analysis in tab 2).
Inputs of the first tab are:
- DEM (required) - mask (optional) - closing section (required if user wants to run r.stream.basin) - accumulation map -> three possibilities: 1 Accumulation map can be previously generated by another software (custom); 2 To be generated by r.watershed using SFD algorithm; 3 To be generated by r.watershed using MFD algorithm.
If user chooses "custom", the name of the map in accum field is the name of existing map which will be used. If map is generated, the name in the field is the name of the new map which will be created. The choice will be done by a dropdown list. The field could be labeled as "Use existing accum map or create a new one using r.watershed". Of course, there will be fields to write the names of results maps. There will be checkboxes to choose which layers will be generated, let's say: network, ordered network, ecc.
About preview area: user should select a point on the DEM and push the "update" button. A preview is generated according to parameters inserted by user. The extents of the small area are pre-established (I will establish them on the basis of the computing time, after testing)
Second tab uses results of tab 1 if user wants to continue his/her work on segmentation on the basis of results of network modeling.
Documentation
The purpose of this GUI is to allow user to access at hydrological modeling in GRASS 7 in a intuitive way. It is a GUI for the r.stream modules R.stream.*, implemented by Jarek Jasiewicz and Markus Metz. These modules perform stream extraction, ordering (Strahler's order, Horton's original order, Shreve's magnitude, Hack's or Gravelius' stream hierarchy), basin delineation according to user's rules, distance to streams, distance above stream, distance to outlet (width function), etc.. As a further development,in the GUI will be also implemented a module to extract automatically the "optimal" threshold for channel initialization [1] and another one to generate the main morphometric parameters of the basin (that is currently only available for GRASS 6.5 [2]).
The GUI is organized in modular way and the first implementation is for stream extraction. The parameters are:
- DEM (required);
- Flow accumulation: this can be optionally generated by the GUI using single or multiple flow direction algorithm, or custom, this means that user can generate it before and insert it as input;
- Threshold for channel initialization.
The outputs are:
- Flow direction;
- Streams (raster);
- Streams (vector).
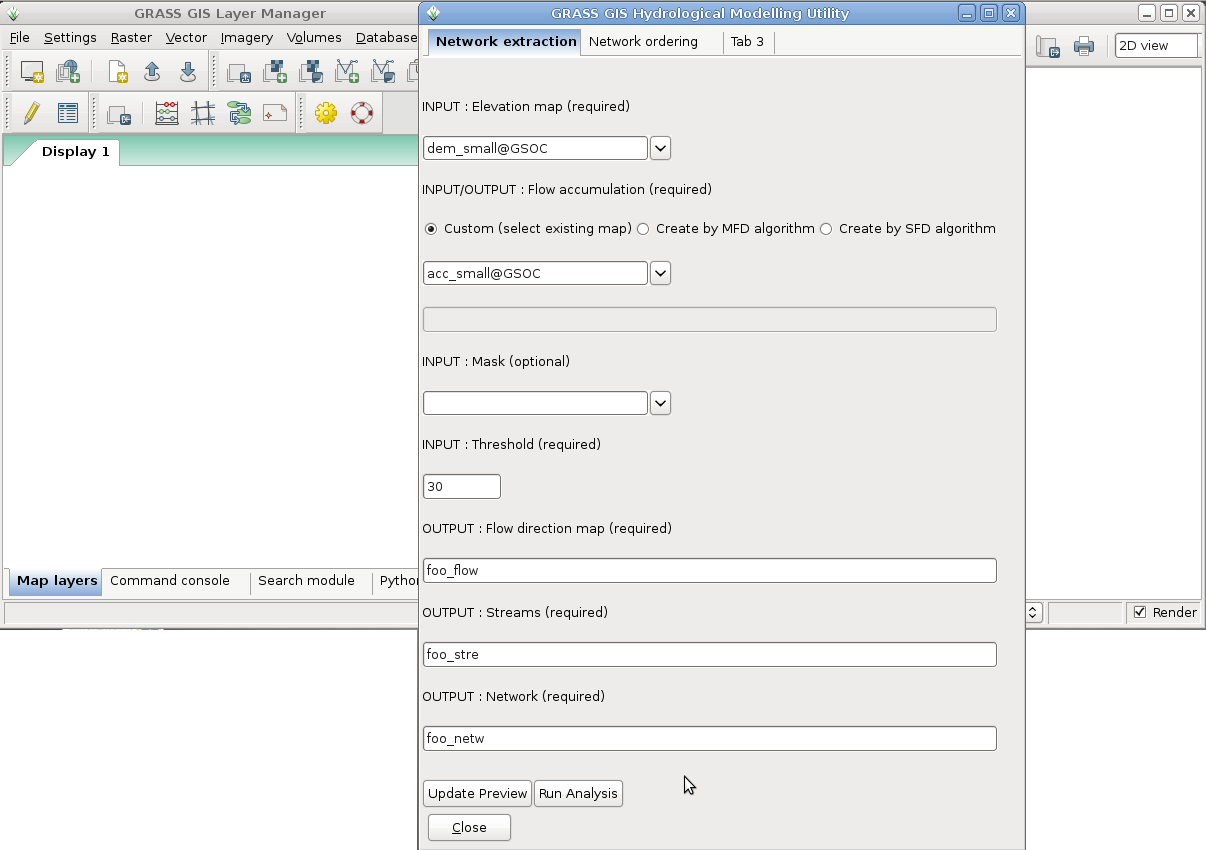
Once filled the fields, user can choose either to run immediately the analysis, pushing the "Run" button, or to see the result of the analysis on a small part of the region, pushing the "Update Preview" button. This latter raises a message asking user to select the centre of the preview on the canvas.
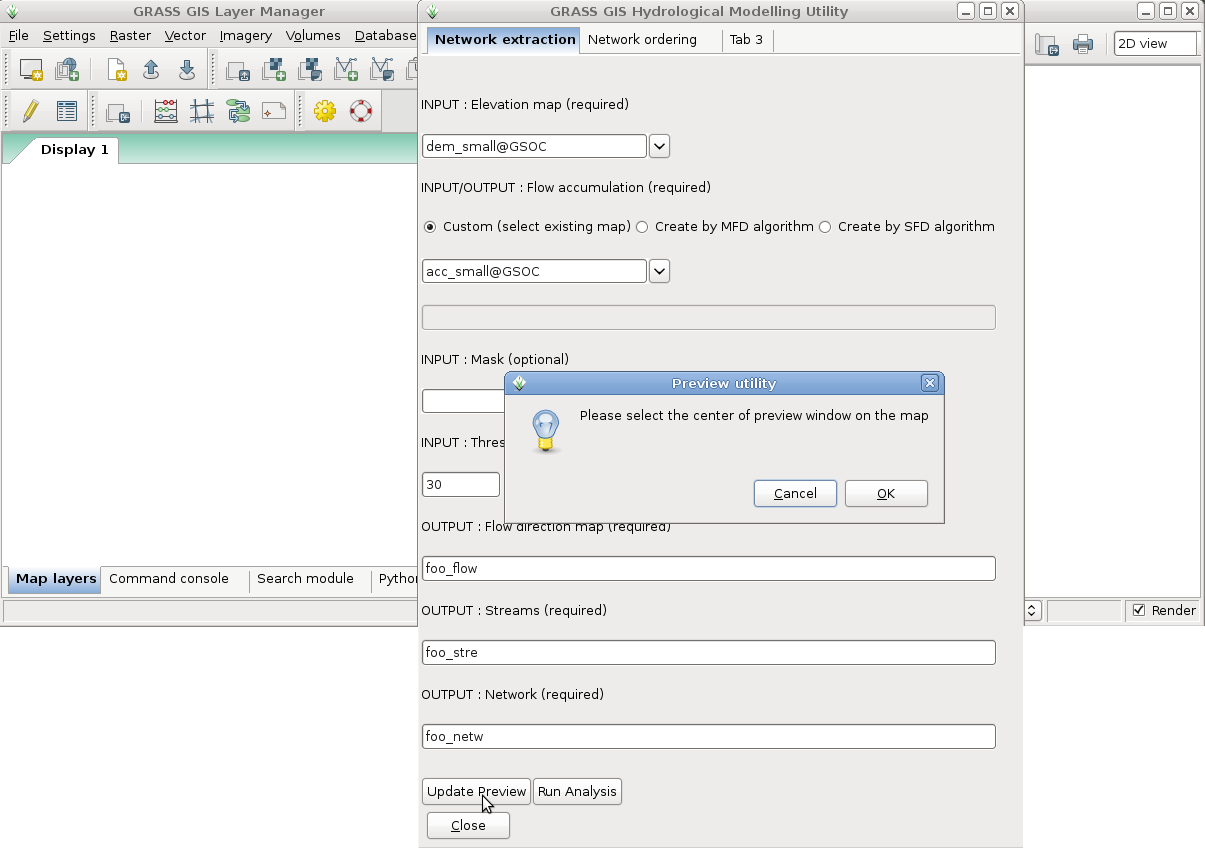
The OK button raises a new canvas, on which is possible to select the coordinates. The button "Get coordinates" switches the control on the canvas and wait for a mouse click. After that, coordinates are shown on the widget.
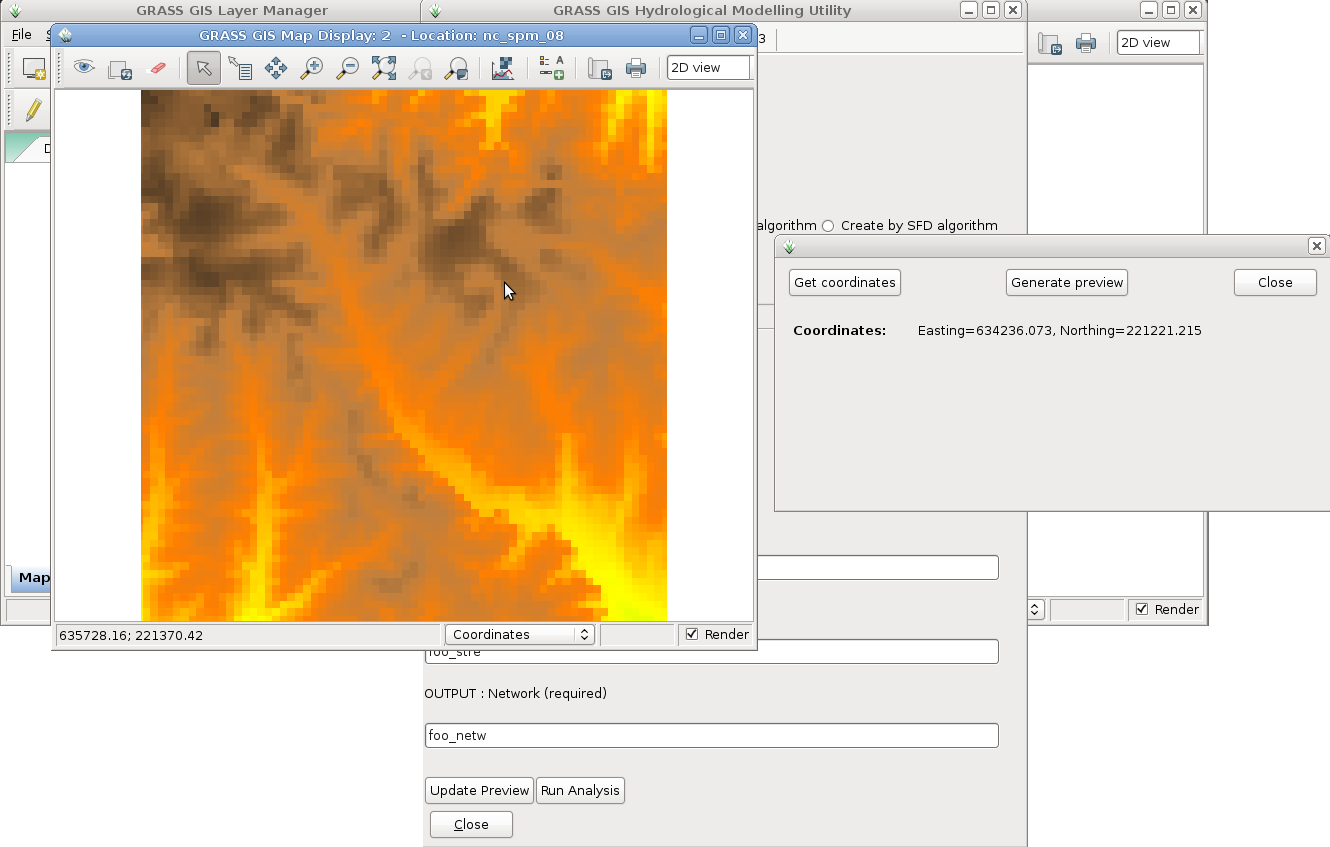
When selection is done, the "Preview" button raises an image slider on which the preview is shown. The preview represents the result of the stream extraction analysis. If user wants to generate more previews, they are added at the image slider.
Updated Timeline
- 23 May - 5 Jun : design interface based on other similar software
- 6 Jun - 15 Jul : midterm goal: get a interface widget for r.stream.extract, r.stream.order
- 16 Jul - 31 Jul: add preview widget, functionality and documentation
- 1 Aug - 15 Aug : testing
- Final goal: working GUI for grass7
How to test
Note: GRASS 7 required.
Download r.stream.* modules:
svn co http://svn.osgeo.org/grass/grass-addons/grass7/raster/r.stream.extract/
svn co http://svn.osgeo.org/grass/grass-addons/grass7/raster/r.stream/
Compile them, then run:
g.extension -s extension=wx.stream
File -> GSoC testing -> RStream
Weekly Reports, from SoC mailing list
- Week 1 Report (27 May) http://lists.osgeo.org/pipermail/soc/2011-May/001330.html
- Week 2 Report (3 Jun) http://lists.osgeo.org/pipermail/soc/2011-June/001341.html
- Week 3 Report (10 Jun) http://lists.osgeo.org/pipermail/soc/2011-June/001369.html
- Week 4 Report (17 Jun) http://lists.osgeo.org/pipermail/soc/2011-June/001392.html
- Week 5 Report (24 Jun) http://lists.osgeo.org/pipermail/soc/2011-June/001414.html
- Week 6 Report (2 Jul) http://lists.osgeo.org/pipermail/soc/2011-July/001446.html
- Week 7 Report (8 Jul) http://lists.osgeo.org/pipermail/soc/2011-July/001466.html
- Week 8 Report (15 Jul) http://lists.osgeo.org/pipermail/soc/2011-July/001491.html
- Week 9 Report (22 Jul) http://lists.osgeo.org/pipermail/soc/2011-July/001519.html
- Week 10 Report (29 Jul) http://lists.osgeo.org/pipermail/soc/2011-July/001527.html
- Week 11 Report (5 Aug) http://lists.osgeo.org/pipermail/soc/2011-August/001551.html
- Week 12 Report (12 Aug) http://lists.osgeo.org/pipermail/grass-dev/2011-August/055317.html
- Week 13 Report (19 Aug) http://lists.osgeo.org/pipermail/grass-dev/2011-August/055435.html