Ps.out Making maps: Difference between revisions
⚠️Ejtizado (talk | contribs) |
No edit summary |
||
| (13 intermediate revisions by one other user not shown) | |||
| Line 88: | Line 88: | ||
end | end | ||
== | == The first output == | ||
At this moment this is the output: | At this moment this is the output: | ||
| Line 94: | Line 94: | ||
[[File:ps_out_first.png|center]] | [[File:ps_out_first.png|center]] | ||
== Composing the map == | |||
== | === The background of the map === | ||
The '''raster file''' is a frequent element and, for the moment, it is necessary to mask vector maps. Here I use a shaded raster to make the aspect of 3D in this simple how to. | The '''raster file''' is a frequent element and, for the moment, it is necessary to mask vector maps. Here I use a shaded raster to make the aspect of 3D in this simple how to. | ||
| Line 103: | Line 104: | ||
The output in console show me that the equivalent quality is 93 ppi. Changing the resolution with ''[[g.region]] res=10'' you can add pixels to slowup the printing quality (if you raster have the request resolution!). | The output in console show me that the equivalent quality is 93 ppi. Changing the resolution with ''[[g.region]] res=10'' you can add pixels to slowup the printing quality (if you raster have the request resolution!). | ||
=== The vector in the map === | |||
Now, I add the '''vector file'''. Here it is a vector with contour lines. | Now, I add the '''vector file'''. Here it is a vector with contour lines. | ||
vlines test_contour@bierzo | vlines test_contour@bierzo | ||
line | line | ||
width .1mm | width .1mm | ||
color OR8 | color OR8 | ||
end | end | ||
rgbcol - level | rgbcol - level | ||
setcolor 600,1000:OR8|.3mm main contour lines | setcolor 600,1000:OR8|.3mm main contour lines | ||
| Line 119: | Line 120: | ||
In this code ''OR8'' is a color defined in a ''palette'' block (do not shown in the code) but the most important is the extended form of the command ''setcolor'' to change the width of the specific contour lines with a ''level'' value of 600 or 1000. | In this code ''OR8'' is a color defined in a ''palette'' block (do not shown in the code) but the most important is the extended form of the command ''setcolor'' to change the width of the specific contour lines with a ''level'' value of 600 or 1000. | ||
== | == The second output == | ||
Now the output is: | Now the output is: | ||
| Line 127: | Line 128: | ||
== Decorations == | == Decorations == | ||
The '''legend''' is another usefull component but in this map is not necessary. After, when I change to a colored version | The '''legend''' is another usefull component but in this map is not necessary. After, the legend is showed when I will change to a colored version. | ||
The only decoration in this howto will be the '''north arrow''' and some free '''text''' using the ''draw'' commend with the option of free to can place the north arrow outside of the map area. | The only decoration in this howto will be the '''north arrow''' and some free '''text''' using the ''draw'' commend with the option of free to can place the north arrow outside of the map area. | ||
| Line 141: | Line 142: | ||
font Univers 10 extend 1.5 ~ color 100:100:100 | font Univers 10 extend 1.5 ~ color 100:100:100 | ||
moveto 26cm 14cm ~ north # | moveto 26cm 14cm ~ north # | ||
font Univers 8 | font Univers 8 2 | ||
moveto 23cm 19.5cm ~ text UTM 29 : ellipsoid ETRS89 | moveto 23cm 19.5cm ~ text UTM 29 : ellipsoid ETRS89 | ||
end | end | ||
Well, also | Well, I also add some of colour with a '''vector map''' of edifications. | ||
vareas bz_edific | vareas bz_edific | ||
| Line 154: | Line 155: | ||
end | end | ||
== | == The third output == | ||
[[File:ps_out_third.png|center]] | [[File:ps_out_third.png|center]] | ||
| Line 167: | Line 168: | ||
ps2pdf14 $OUTPUT.ps | ps2pdf14 $OUTPUT.ps | ||
== A colored final output == | |||
A colored version using the ''raster'' map bz_30m, runnig ''[[r.colors]] map=bz_30m color=haxby'' and adding ''rlegend'' and some changes of the colors. | |||
raster bz_30m bz_30m_shade | |||
end | |||
rlegend | |||
raster bz_30m | |||
frame | |||
where 26cm 5cm | |||
ref center upper | |||
fcolor none | |||
border 0 | |||
end | |||
swidth .5cm | |||
tick 2mm | |||
height 8cm | |||
end | |||
[[File:ps_out_final.png|center]] | |||
= Maps with same layout = | = Maps with same layout = | ||
| Line 172: | Line 195: | ||
Also we need the map_# with the particular content of the map. | Also we need the map_# with the particular content of the map. | ||
== The master file == | |||
The '''master file''', to repeat the creation of all maps with the same layout, is as: | The '''master file''', to repeat the creation of all maps with the same layout, is as: | ||
#!/bin/bash | |||
MAP="_ps_" | |||
MAP= | |||
function makemap() | function makemap() | ||
{ | |||
echo "#!/bin/bash" > $MAP | echo "#!/bin/bash" > $MAP | ||
cat map_pre >> $MAP | cat map_pre >> $MAP | ||
| Line 187: | Line 210: | ||
./$MAP $1 | ./$MAP $1 | ||
rm $MAP | rm $MAP | ||
} | |||
makemap map_1 | |||
makemap map_2 | |||
== The first part == | |||
The file '''map_pre''' include all code to execute ''ps.out'' and design the basic elements of the map: title, | The file '''map_pre''' include all code to execute ''ps.out'' and design the basic elements of the map: title, border, scalebar, north-arrow, etc. | ||
A example content is: | A example content is: | ||
OUTPUT=$1 | |||
ps.out -g out=$OUTPUT.ps << EOF | |||
paper A4 | |||
''[...]'' | |||
end | |||
scale 1:500000 | |||
grid | |||
''[...]'' | |||
end | |||
vlines bz_lim | |||
''[...]'' | |||
end | |||
== The specific part of the map == | |||
The file '''map_#''' include the specific code to draw the particular maps. | |||
vareas risk_range | |||
''[...]'' | |||
end | end | ||
vpoint cs_parcela | |||
''[...]'' | |||
end | end | ||
== The last part == | |||
The file '''map_post''' include the final ending code, and perhaps the common legend style. For example, | The file '''map_post''' include the final ending code, and perhaps the common legend style. For example, | ||
vlegend Legend | |||
''[...]'' | |||
end | |||
draw free | |||
''[...]'' | |||
end | end | ||
EOF | |||
ps2pdf14 $OUTPUT.ps | |||
[[Category: ps.map]] | [[Category: ps.map]] | ||
[[Category: HowTo]] | |||
Latest revision as of 07:19, 29 August 2013
How make a map?
The header of file
#!/bin/bash
Command line
First I define a variable to store the name of the output because when I want change it I modify only this value. Also, begin the ps.out command and the EOF block.
OUTPUT="OUT"
ps.out -g out=$OUTPUT.ps << EOF
The layout
The paper
paper A4
   left 1in
   landscape y
   font
     name Univers
     size 9
   end
   draw
       color black ~ linewidth .8mm
       moveto 23cm 1.5cm ~ fcolor 220:220:220 ~ rect 29cm 19cm
       moveto 23cm 1.5cm ~ fcolor 100:100:100 ~ rect 29cm 4cm
       font Univers-Bold 14 extend 2 ~ color white
       moveto 26cm 2.25cm ~ text :Making|.maps with|ps.out
   end
end
Placing the map area on the page
I prefer use the default values of the map area but to show anything I set the color of the border map.
maparea
   color white
end
I request a fixed scale for the map.
scale 1:100000
Elements on the map
The border of the map is a usual elements to geographically locate the map. There is not a default border then if you want it you need define this stament.
grid
   format iho
   major 10000
       width .1mm
       color indigo$.25
   end
   minor 5000
       color none
   end
end
The scalebar is also an usual elements.
scalebar S
   units km Km
   length 5
   major 5 1
   minor 0 5
   frame
       where 26cm 17cm
       ref center center
       border 0
       fcolor none
   end
   height 3mm
end
The numeric scale is also usefull. As you can see, I request a scale 1:100000 but with the actual margins and border the minimun scale is 1:110249.
note :scale escala
   frame
       where 26cm 17cm
       ref center upper
       border 0
       margin 10
       fcolor none
   end
end
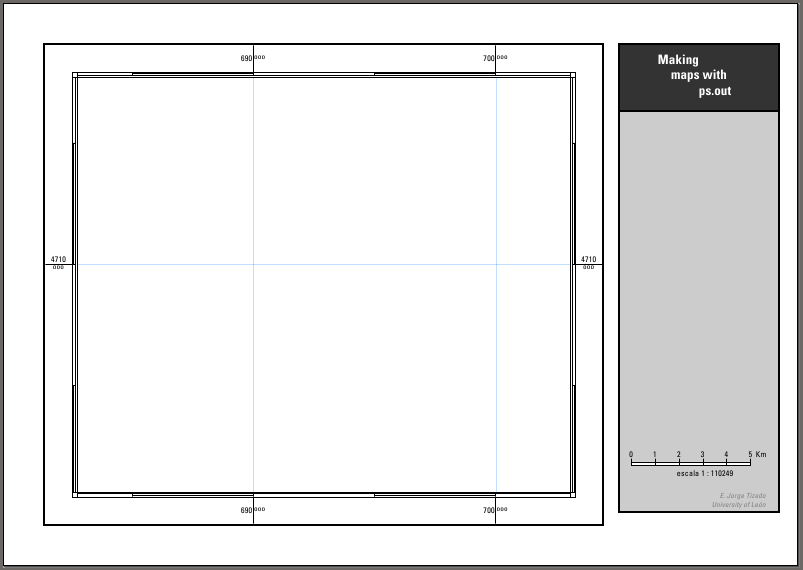
The first output
At this moment this is the output:

Composing the map
The background of the map
The raster file is a frequent element and, for the moment, it is necessary to mask vector maps. Here I use a shaded raster to make the aspect of 3D in this simple how to.
raster bz_30m_shade
end
The output in console show me that the equivalent quality is 93 ppi. Changing the resolution with g.region res=10 you can add pixels to slowup the printing quality (if you raster have the request resolution!).
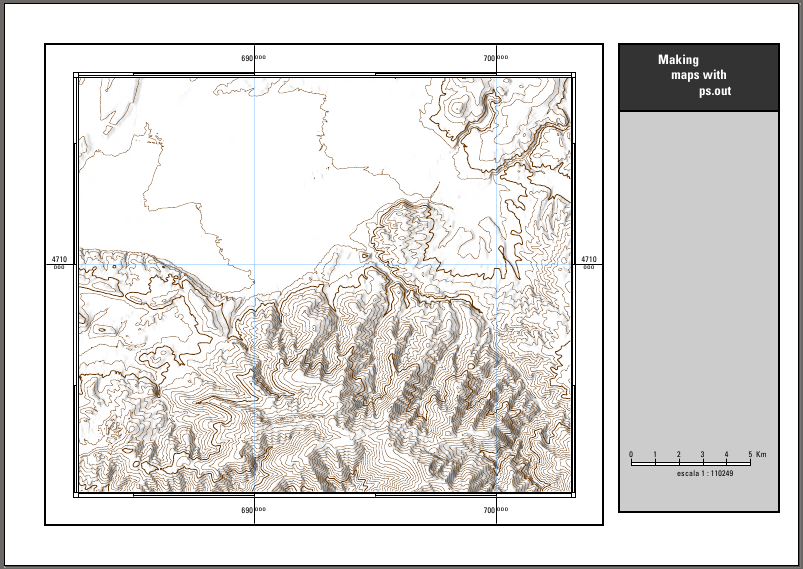
The vector in the map
Now, I add the vector file. Here it is a vector with contour lines.
vlines test_contour@bierzo
   line
       width .1mm
       color OR8
   end
   rgbcol - level
   setcolor 600,1000:OR8|.3mm main contour lines
end
In this code OR8 is a color defined in a palette block (do not shown in the code) but the most important is the extended form of the command setcolor to change the width of the specific contour lines with a level value of 600 or 1000.
The second output
Now the output is:

Decorations
The legend is another usefull component but in this map is not necessary. After, the legend is showed when I will change to a colored version.
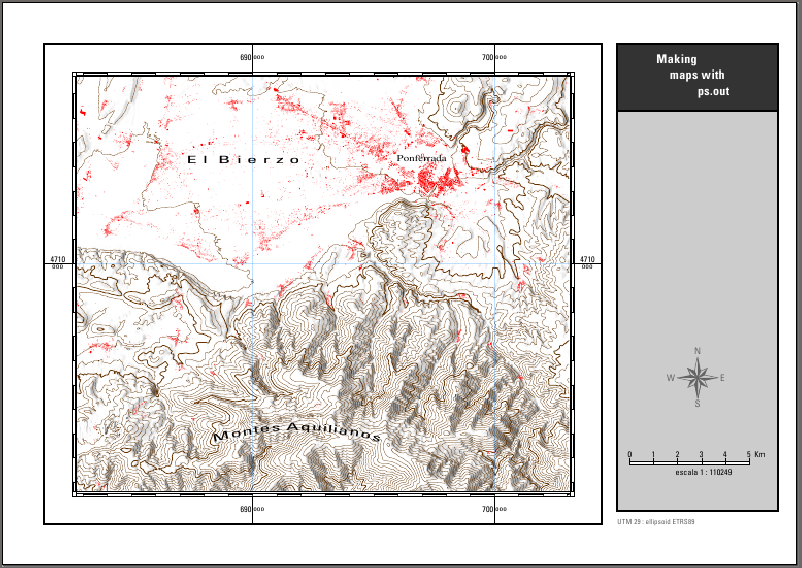
The only decoration in this howto will be the north arrow and some free text using the draw commend with the option of free to can place the north arrow outside of the map area.
draw free
   color black
   font Univers 12 2
   moveto 9cm 6cm ~ text .E l  B i e r z o
   moveto 11cm 16cm ~ otext 12cm 90 Montes Aquilianos
   font Bitstream-Vera-Serif 10 1.2
   moveto 697000 4714200 ~ text .Ponferrada

   font Univers 10 extend 1.5 ~ color 100:100:100
   moveto 26cm 14cm ~ north #
   font Univers 8 2
   moveto 23cm 19.5cm ~ text UTM 29 : ellipsoid ETRS89
end
Well, I also add some of colour with a vector map of edifications.
vareas bz_edific
   line
       color none
   end
   fcolor red
end
The third output

Now, I finish the EOF stament.
EOF
I prefer work with PDF than PS because I see the transparent colours and it compress the file resulting in a considerably smalles file size.
ps2pdf14 $OUTPUT.ps
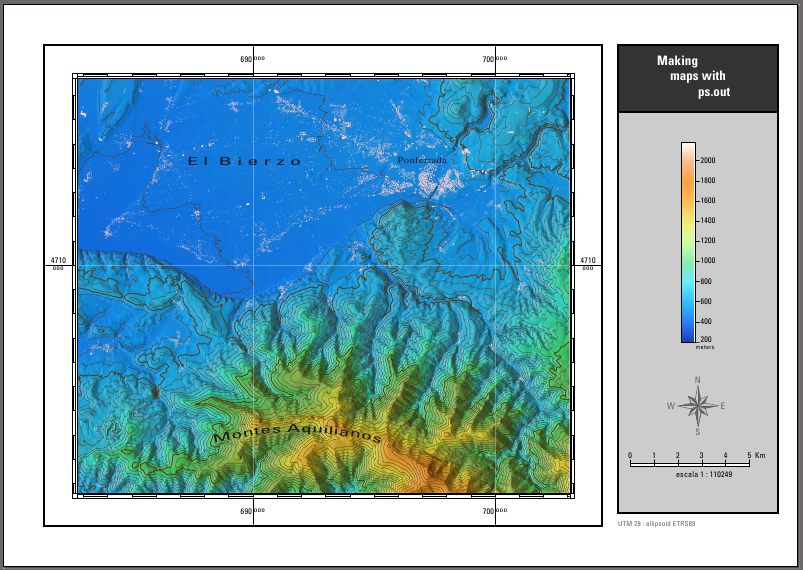
A colored final output
A colored version using the raster map bz_30m, runnig r.colors map=bz_30m color=haxby and adding rlegend and some changes of the colors.
raster bz_30m bz_30m_shade
end

rlegend
   raster bz_30m
   frame
       where 26cm 5cm
       ref center upper
       fcolor none
       border 0
   end
   swidth .5cm
   tick 2mm
   height 8cm
end

Maps with same layout
To make several maps with the same layout, we use three files: map_pre, map_post, and a master file. Also we need the map_# with the particular content of the map.
The master file
The master file, to repeat the creation of all maps with the same layout, is as:
 #!/bin/bash

MAP="_ps_"
function makemap()
 {
   echo "#!/bin/bash" > $MAP
   cat map_pre  >> $MAP
   cat $1 >> $MAP
   cat map_post >> $MAP
   chmod +x $MAP
   ./$MAP $1
   rm $MAP
 }

 makemap map_1
 makemap map_2
The first part
The file map_pre include all code to execute ps.out and design the basic elements of the map: title, border, scalebar, north-arrow, etc. A example content is:
 OUTPUT=$1
 ps.out -g out=$OUTPUT.ps << EOF

 paper A4
   [...]
 end

 scale 1:500000

 grid
   [...]
 end

 vlines bz_lim
   [...]
 end
The specific part of the map
The file map_# include the specific code to draw the particular maps.
vareas risk_range
   [...]
end

vpoint cs_parcela
   [...]
end
The last part
The file map_post include the final ending code, and perhaps the common legend style. For example,
 vlegend Legend
   [...]
 end

draw free
   [...]
end

 EOF

 ps2pdf14 $OUTPUT.ps