Screenshot suggestions: Difference between revisions
(imagery) |
m (+category) |
||
| (44 intermediate revisions by 8 users not shown) | |||
| Line 1: | Line 1: | ||
Please put suggestions for screenshots to go onto the main website on this page. You can post URLs or [[Special:Upload|upload images]] directly to the wiki. | Please put suggestions for screenshots to go onto the main website on this page. You can post URLs or [[Special:Upload|upload images]] directly to the wiki or upload them to the [http://svn.osgeo.org/grass/grass-addons/screenshots/ SVN addons repository]. | ||
Here is the new work-in-progress screenshots page: | Here is the new work-in-progress screenshots page: | ||
* http://grass. | * http://grass.osgeo.org/screenshots/ | ||
'''Note that all screenshots are to be licensed under the [http://creativecommons.org/ Creative Commons] [http://creativecommons.org/licenses/by-sa/2.5/ Attribution ShareAlike 2.5] License.''' Please leave your name as well so we can attribute correct credit. | '''Note that all screenshots are to be licensed under the [http://creativecommons.org/ Creative Commons] [http://creativecommons.org/licenses/by-sa/2.5/ Attribution ShareAlike 2.5] License.''' Please leave your name as well so we can attribute correct credit. | ||
| Line 10: | Line 10: | ||
* PNG images are lossless but can be very large for satellite images & photographs. Best format to use for things like menus with a lot of solid colors and where crispness counts. | * PNG images are lossless but can be very large for satellite images & photographs. Best format to use for things like menus with a lot of solid colors and where crispness counts. | ||
** To help save bandwidth, save your PNGs with compression setting of 9. Often you can reduce the file size significantly by reducing the pallet size to be big enough to hold just the colors used. | ** To help save bandwidth, save your PNGs with compression setting of 9. Often you can reduce the file size significantly by reducing the pallet size to be big enough to hold just the colors used. | ||
** Running a program like [http://pmt.sourceforge.net/pngcrush/ pngcrush] can compress it further. | ** Running a program like [http://pmt.sourceforge.net/pngcrush/ pngcrush] or ''optipng'' can compress it further. | ||
pngcrush -brute image.png image_crushed.png | pngcrush -brute image.png image_crushed.png | ||
optipng -o5 image.png | |||
* JPG images are lossy but can be much smaller for things like satellite images & photographs. | * JPG images are lossy but can be much smaller for things like satellite images & photographs. | ||
| Line 19: | Line 21: | ||
----- | ----- | ||
'''Still to do | '''Still to do''' | ||
* | |||
* Clean up RS/imagery pages, clarify meanings | * Enhance the web services page | ||
* Nicer raster/vector page images? | |||
* Clean up & add to RS/imagery pages, clarify meanings of the two categories | |||
* Nicer raster/'''vector''' page images? | |||
: Create a Spearfish/NC map showing vector maps rendered with the new Cairo display driver | |||
* Create modeling page (R stats, Dylan's spearfish clustering fig, ..?) | * Create modeling page (R stats, Dylan's spearfish clustering fig, ..?) | ||
: Idea for modeling page is non-map figures and graphs | : Idea for modeling page is non-map figures and graphs | ||
| Line 80: | Line 86: | ||
[[Image:Spearfish_catchements.png|right|100px]] | [[Image:Spearfish_catchements.png|right|100px]] | ||
* ''r.watershed'' help page example (HB) - '''''added to raster page''''' | * ''r.watershed'' help page example (HB) - '''''added to raster page''''' | ||
[[Image:Zurich.png|right|100px]] | |||
* ''r.mapcalc'' and LANDSAT imaging/processing | |||
* <tt>r.param.scale param=feature</tt> | |||
* Some more [http://www.grassbook.org/gallery/ch3getstarted/images.html raster maps] | * Some more [http://www.grassbook.org/gallery/ch3getstarted/images.html raster maps] | ||
| Line 88: | Line 100: | ||
* Network ops. | * Network ops. | ||
* 3D visualization | * 3D visualization | ||
** DXF ant (HB): [http://bambi.otago.ac.nz/hamish/grass/bugs/insects01_nviz_dxf.png] | ** DXF ant (HB): [http://bambi.otago.ac.nz/hamish/grass/bugs/insects01_nviz_dxf.png] (combine with [http://grass.ibiblio.org/grass63/screenshots/vector.php Möbius strip]) | ||
** NYC-3D (HB): [http://bambi.otago.ac.nz/hamish/grass/screenshots/nyc3d_nviz3_midtown.png] | ** NYC-3D (HB): [http://bambi.otago.ac.nz/hamish/grass/screenshots/nyc3d_nviz3_midtown.png] | ||
* USA 3D bargraph by state [http://grass.fbk.eu/grass60/screenshots/viz.php here] - v.extrude [http://grass.fbk.eu/grass61/screenshots/vector.php here], NVIZ | |||
* vector map (roads, railway, fields, points, etc) rendered using the Cairo driver | |||
== Imagery == | == Imagery == | ||
''We still need to better define where to make the split between Image Processing and Remote Sensing'' | |||
* i.vpoints example showing back-transformed vector overlay check | * i.vpoints example showing back-transformed vector overlay check | ||
* I remember a picture of a house and dock rendered in 3D from key GCPs in some sort of stereo photogrammetry project. Maybe from an abstract of talk from the GRASS conf. that took place in EU before the Thailand one (??) | |||
== Remote Sensing and LIDAR == | == Remote Sensing and LIDAR == | ||
=== Satellite Data | === Satellite Data === | ||
MODIS, Quickbird, etc, I thought to put some sites/vector points stuff here too. Maybe split that out into its own category? | MODIS, Quickbird, etc, I thought to put some sites/vector points stuff here too. Maybe split that out into its own category? | ||
* clustering, segmentation | * clustering, segmentation [http://gama.fsv.cvut.cz/wiki/index.php/Zpracov%C3%A1n%C3%AD_obrazov%C3%BDch_dat_-_cvi%C4%8Den%C3%AD_%C4%8D.11 many examples from Martin] | ||
: - '''''very nice!''''' | |||
* sat img edge detection (Markus posted one recently) | * sat img edge detection (Markus posted one recently) | ||
* i.landsat.rgb trials [http://bambi.otago.ac.nz/hamish/grass/landsat/] | * i.landsat.rgb trials [http://bambi.otago.ac.nz/hamish/grass/landsat/] | ||
: '''''- added to RS page''''' | : '''''- added to RS page''''' | ||
* [http:// | * [http://www.grassbook.org/neteler/rs/modis_reflectance/ MODIS/Terra Surface Reflectance Daily L2G Global 500m] - ''8 Aug 2002 - true color image composite. Part of Europe as seen from MODIS/TERRA at 500m resolution (R1 G4 B3). New snow arrived in the Alps, floods in Austria, Czech Republic and Germany due to heavy rain (up to 300mm/24h in Eastern Europe)''. (screenshot Markus Neteler) | ||
* [http:// | * [http://www.grassbook.org/neteler/rs/modis_ndvi_evi/index.html MODIS NDVI/EVI] images | ||
* [http:// | * [http://www.grassbook.org/neteler/rs/aster/index.html ASTER high resolution remote sensing] - ships on the North Sea near Germany | ||
: '''''- added to the RS page ''''' | : '''''- added to the RS page ''''' | ||
| Line 115: | Line 133: | ||
: '''''- already on the raster screenshot page'''''. ''add to the RS page too?'' | : '''''- already on the raster screenshot page'''''. ''add to the RS page too?'' | ||
* [http:// | * [http://www.grassbook.org/neteler/rs/landsat7/index.html LANDSAT TM7 visualizations of Venice, Trento] (screenshots Markus Neteler) | ||
* ? more ideas please ? | * ? more ideas please ? | ||
| Line 125: | Line 143: | ||
=== Sites (point) data === | === Sites (point) data === | ||
* where to put this? - eg NVIZ 3D histograms | * where to put this? | ||
- eg NVIZ 3D histograms (example?) | |||
== 3D Visualization == | == 3D Visualization == | ||
| Line 133: | Line 152: | ||
* NVIZ, r3.out.vtk, ... [http://www-pool.math.tu-berlin.de/~soeren/grass/modules/screenshots/ paraview] from Sören | * NVIZ, r3.out.vtk, ... [http://www-pool.math.tu-berlin.de/~soeren/grass/modules/screenshots/ paraview] from Sören | ||
* MARS MOLA data ([http://bambi.otago.ac.nz/hamish/olympus_mons.html]) '''''added to viz page''''' | * MARS MOLA data ([http://bambi.otago.ac.nz/hamish/olympus_mons.html]) '''''added to viz page''''' | ||
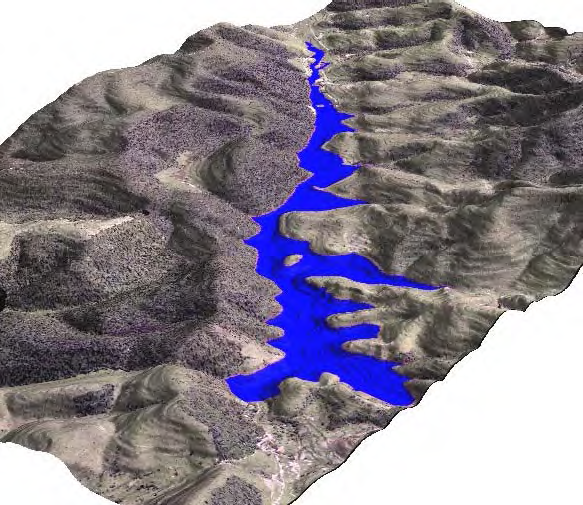
* Una basin reservoir (visualization of proposed dam's lake): [[File:Una_basin_reservoir_project_Taubate_SP_Brasil_png.png]] | |||
== 3D Rendering == | == 3D Rendering == | ||
* [http:// | * [http://www.grassbook.org/neteler/povray/ Povray rendering] (Markus Neteler) | ||
: '''''- added to viz page''''' | : '''''- added to viz page''''' | ||
* [http://casoilresource.lawr.ucdavis.edu/drupal/node/80 Povray rendering] (Dylan Beaudette) | * [http://casoilresource.lawr.ucdavis.edu/drupal/node/80 Povray rendering] (Dylan Beaudette) | ||
: '''''- link added to viz page''''' | : '''''- link added to viz page''''' | ||
* see also the GRASS [[POV-Ray]] wiki page | |||
== Map reprojection == | |||
* [http://grass.osgeo.org/grass60/screenshots/raster.php Lambert Equal Area projection of ETOPO2] | |||
: - ''currently on the raster page'' | |||
* i.vpoints preview vector map backwards projection overlay | |||
== Cartography == | == Cartography == | ||
| Line 147: | Line 177: | ||
** I do not know, if it suits, but this I got some time ago with pure ps.map [[http://wwwold.fle.czu.cz/~jachym/img/grass/krkonose_prehledka.jpg]] | ** I do not know, if it suits, but this I got some time ago with pure ps.map [[http://wwwold.fle.czu.cz/~jachym/img/grass/krkonose_prehledka.jpg]] | ||
* example of rotated symbols in ps.map: | * example of rotated symbols in ps.map: (H Bowman) | ||
: | : --''HB:'' does this demo count as cartography? I'm not quite sure how to classify it. | ||
* [http:// | * [http://grassold.osgeo.org/images/spearfish_drg_nviz.jpg US DRG draped over DEM (NVIZ)] (Markus Neteler) | ||
: - '''''already added as first image on viz page''''', ''add to the cartography page as well as an example of what can be done with a printed topo map??'' | : - '''''already added as first image on viz page''''', ''add to the cartography page as well as an example of what can be done with a printed topo map??'' (HB: sure, if you like) | ||
[[File:Ps.output.png|thumb|right|200px]] | |||
* example of map using {{AddonCmd|ps.output}} addon | |||
: - '''''added''''' | |||
* screenshot of a map created with GRASS and viewed within from QGIS (using aspect data to rotate and area data to adjust the size of arrow-symbols corresponding to forest gaps). | |||
: - Does this fit here? Names and text can be removed as well as a high quality version can be created if required [[File:Forestgaps_Moseltal_Germany.png|thumb|right|200px]] | |||
== Web Services == | == Web Services == | ||
| Line 162: | Line 199: | ||
*** http://www.bnhelp.cz/mapserv/pokusy/OpenLayers/jachym/openlayers/examples/wps.html | *** http://www.bnhelp.cz/mapserv/pokusy/OpenLayers/jachym/openlayers/examples/wps.html | ||
*** http://pywps.ominiverdi.org - more stuff | *** http://pywps.ominiverdi.org - more stuff | ||
*** http://pywps.wald.intevation.org | |||
*** http://www.bnhelp.cz/mapserv/pokusy/openlayers/bonifacio | *** http://www.bnhelp.cz/mapserv/pokusy/openlayers/bonifacio | ||
* r.in.wms | * r.in.wms, v.in.wfs | ||
* CSISS/GMU contributions: GRASS_based geospatial web services | |||
** A lot of web services are developed based on GRASS functions for imagery/raster and vector map processing | |||
*** http://geobrain.laits.gmu.edu:81/grassweb/manuals/ | |||
** They are standard web services, which allow anyone to invoke with their own client applications | |||
** All these web services also could be invoked through our GeOnAS interface | |||
*** http://geobrain.laits.gmu.edu:81/OnAS/ | |||
*** http://geobrain.laits.gmu.edu:81/OnAS/User_Guide.htm | |||
* OSU IPPC GRASSLinks: | |||
: http://pnwpest.org/glinks/ | |||
== Modeling and Statistics == | == Modeling and Statistics == | ||
| Line 190: | Line 237: | ||
* moving NVIZ cutting planes | * moving NVIZ cutting planes | ||
: example South America movie from Bob | : example South America movie from Bob '''''- added''''' | ||
* Paraview | * Paraview | ||
| Line 196: | Line 243: | ||
Feel free to suggest something. | Feel free to suggest something. | ||
[[:Category:Promotion]] (GRASS Promotion Team) | |||
[[Category: Community]] | |||
[[Category: Promotion]] | |||
[[Category: Branding]] | |||
[[Category:Visualization]] | |||
Latest revision as of 16:00, 9 November 2013
Please put suggestions for screenshots to go onto the main website on this page. You can post URLs or upload images directly to the wiki or upload them to the SVN addons repository.
Here is the new work-in-progress screenshots page:
Note that all screenshots are to be licensed under the Creative Commons Attribution ShareAlike 2.5 License. Please leave your name as well so we can attribute correct credit.
- See here for help making an image on this page an instant thumbnail.
(The syntax is [[Image:{name}|{width}px]])
- PNG images are lossless but can be very large for satellite images & photographs. Best format to use for things like menus with a lot of solid colors and where crispness counts.
- To help save bandwidth, save your PNGs with compression setting of 9. Often you can reduce the file size significantly by reducing the pallet size to be big enough to hold just the colors used.
- Running a program like pngcrush or optipng can compress it further.
pngcrush -brute image.png image_crushed.png
optipng -o5 image.png
- JPG images are lossy but can be much smaller for things like satellite images & photographs.
- For quality save nearer to 85%, for size save nearer to 75%.
Still to do
- Enhance the web services page
- Clean up & add to RS/imagery pages, clarify meanings of the two categories
- Nicer raster/vector page images?
- Create a Spearfish/NC map showing vector maps rendered with the new Cairo display driver
- Create modeling page (R stats, Dylan's spearfish clustering fig, ..?)
- Idea for modeling page is non-map figures and graphs
Stuff still to merge & places to draw from:
- Old screenshots from the website [grass6?/screenshots/]
- stuff in the main website images/ dir (mostly GRASS 5 shots)
- Screenshots from http://www.osgeo.org/grass/
- The wiki Imagelist
- Old GRASSNews and OSGeo journal articles
- Scans of old GRASS-Clippings articles? -> helena + old GRASS 4 3D globes?
Subcategories are:
User Interface
Startup screen
- Mapset picker
- Define new location by EPSG & custom params
- Markus has some on the FOSS4G2007 IntegrationShowcase wiki page
TclTk GUI
- GUI and tools in action
wxPython interface
- GIS manager
- module window
GRASS and QGIS
- see Trento QGIS
Platforms
Linux
Mac
Windows
Handhelds
Raster map operations
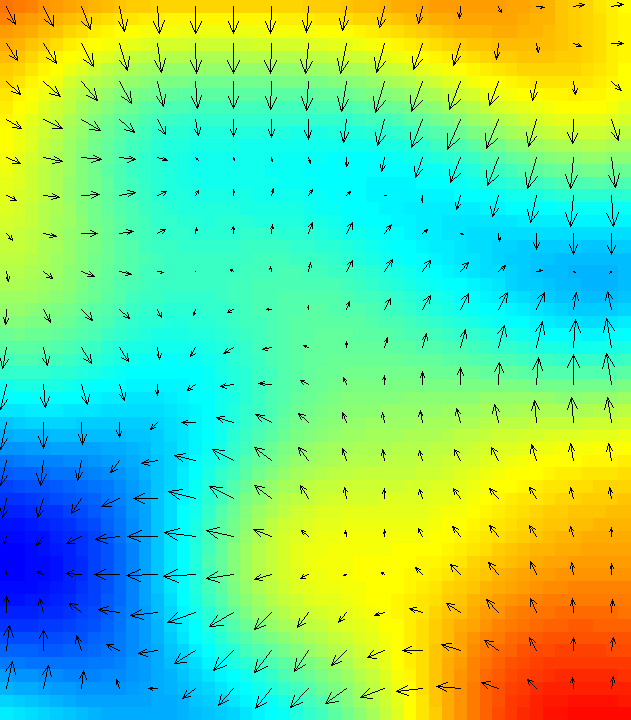
- d.rast.arrow example (HB) - added to raster page
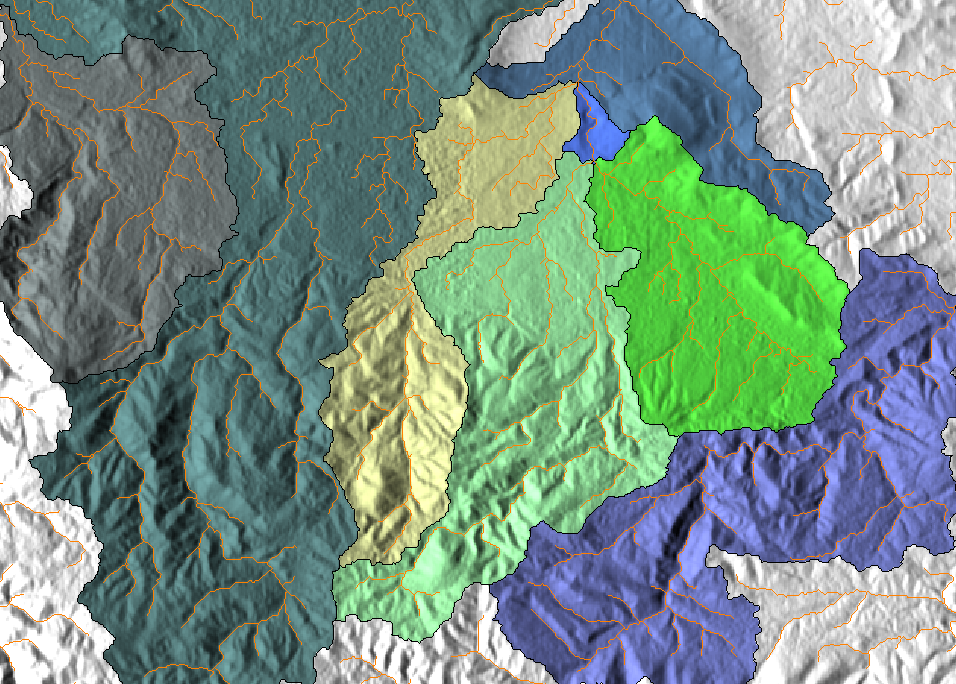
- r.watershed help page example (HB) - added to raster page
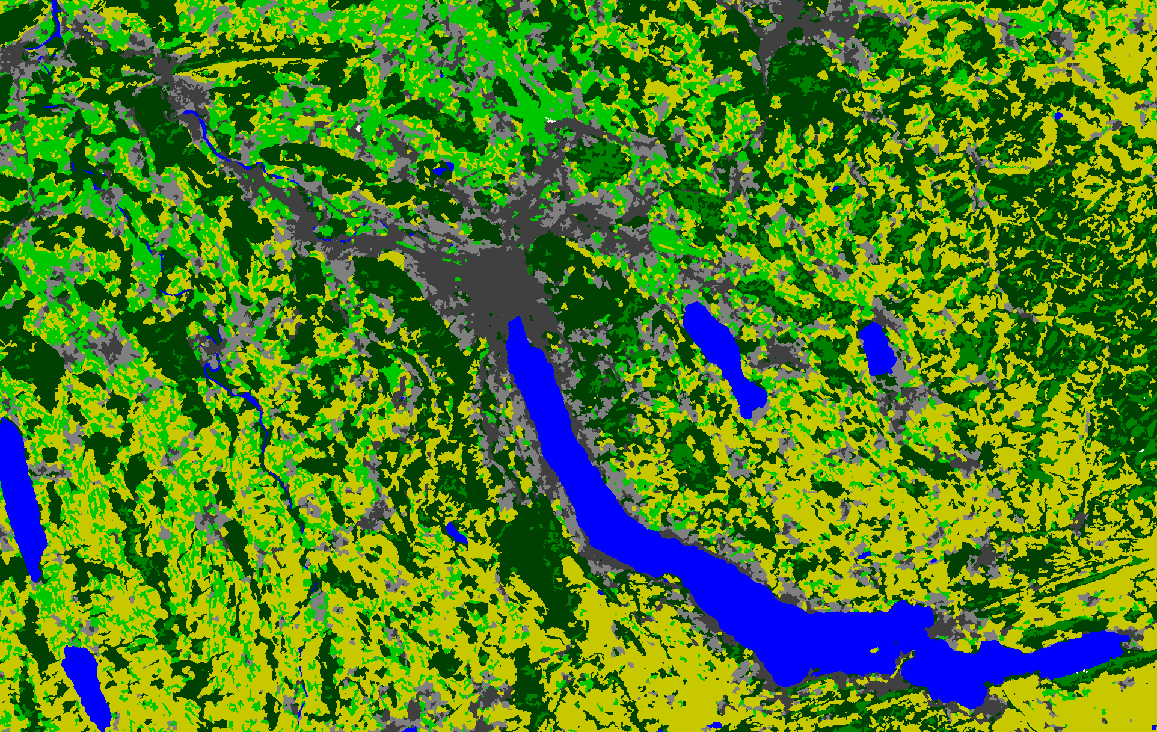
- r.mapcalc and LANDSAT imaging/processing
- r.param.scale param=feature
- Some more raster maps
- And even more raster maps
Vector map operations
- Network ops.
- 3D visualization
- DXF ant (HB): [1] (combine with Möbius strip)
- NYC-3D (HB): [2]
- vector map (roads, railway, fields, points, etc) rendered using the Cairo driver
Imagery
We still need to better define where to make the split between Image Processing and Remote Sensing
- i.vpoints example showing back-transformed vector overlay check
- I remember a picture of a house and dock rendered in 3D from key GCPs in some sort of stereo photogrammetry project. Maybe from an abstract of talk from the GRASS conf. that took place in EU before the Thailand one (??)
Remote Sensing and LIDAR
Satellite Data
MODIS, Quickbird, etc, I thought to put some sites/vector points stuff here too. Maybe split that out into its own category?
- clustering, segmentation many examples from Martin
- - very nice!
- sat img edge detection (Markus posted one recently)
- i.landsat.rgb trials [3]
- - added to RS page
- MODIS/Terra Surface Reflectance Daily L2G Global 500m - 8 Aug 2002 - true color image composite. Part of Europe as seen from MODIS/TERRA at 500m resolution (R1 G4 B3). New snow arrived in the Alps, floods in Austria, Czech Republic and Germany due to heavy rain (up to 300mm/24h in Eastern Europe). (screenshot Markus Neteler)
- MODIS NDVI/EVI images
- ASTER high resolution remote sensing - ships on the North Sea near Germany
- - added to the RS page
- SRTM void filling with spline interpolation in GRASS GIS (screenshot Markus Neteler)
- - already on the raster screenshot page. add to the RS page too?
- LANDSAT TM7 visualizations of Venice, Trento (screenshots Markus Neteler)
- ? more ideas please ?
LIDAR and Sonar Data
- Lidar with NC OSGeo data set
- Jockey's Ridge - added
- gdalwarping of sidescan sonar track? - yes!
Sites (point) data
- where to put this?
- eg NVIZ 3D histograms (example?)
3D Visualization
- see Help with 3D
3D Rendering
- Povray rendering (Markus Neteler)
- - added to viz page
- Povray rendering (Dylan Beaudette)
- - link added to viz page
- see also the GRASS POV-Ray wiki page
Map reprojection
- - currently on the raster page
- i.vpoints preview vector map backwards projection overlay
Cartography
Aim for publication quality
- ps.map, nice PS,PNG driver renders
- I do not know, if it suits, but this I got some time ago with pure ps.map [[5]]
- example of rotated symbols in ps.map: (H Bowman)
- --HB: does this demo count as cartography? I'm not quite sure how to classify it.
- US DRG draped over DEM (NVIZ) (Markus Neteler)
- - already added as first image on viz page, add to the cartography page as well as an example of what can be done with a printed topo map?? (HB: sure, if you like)
- example of map using ps.output addon
- - added
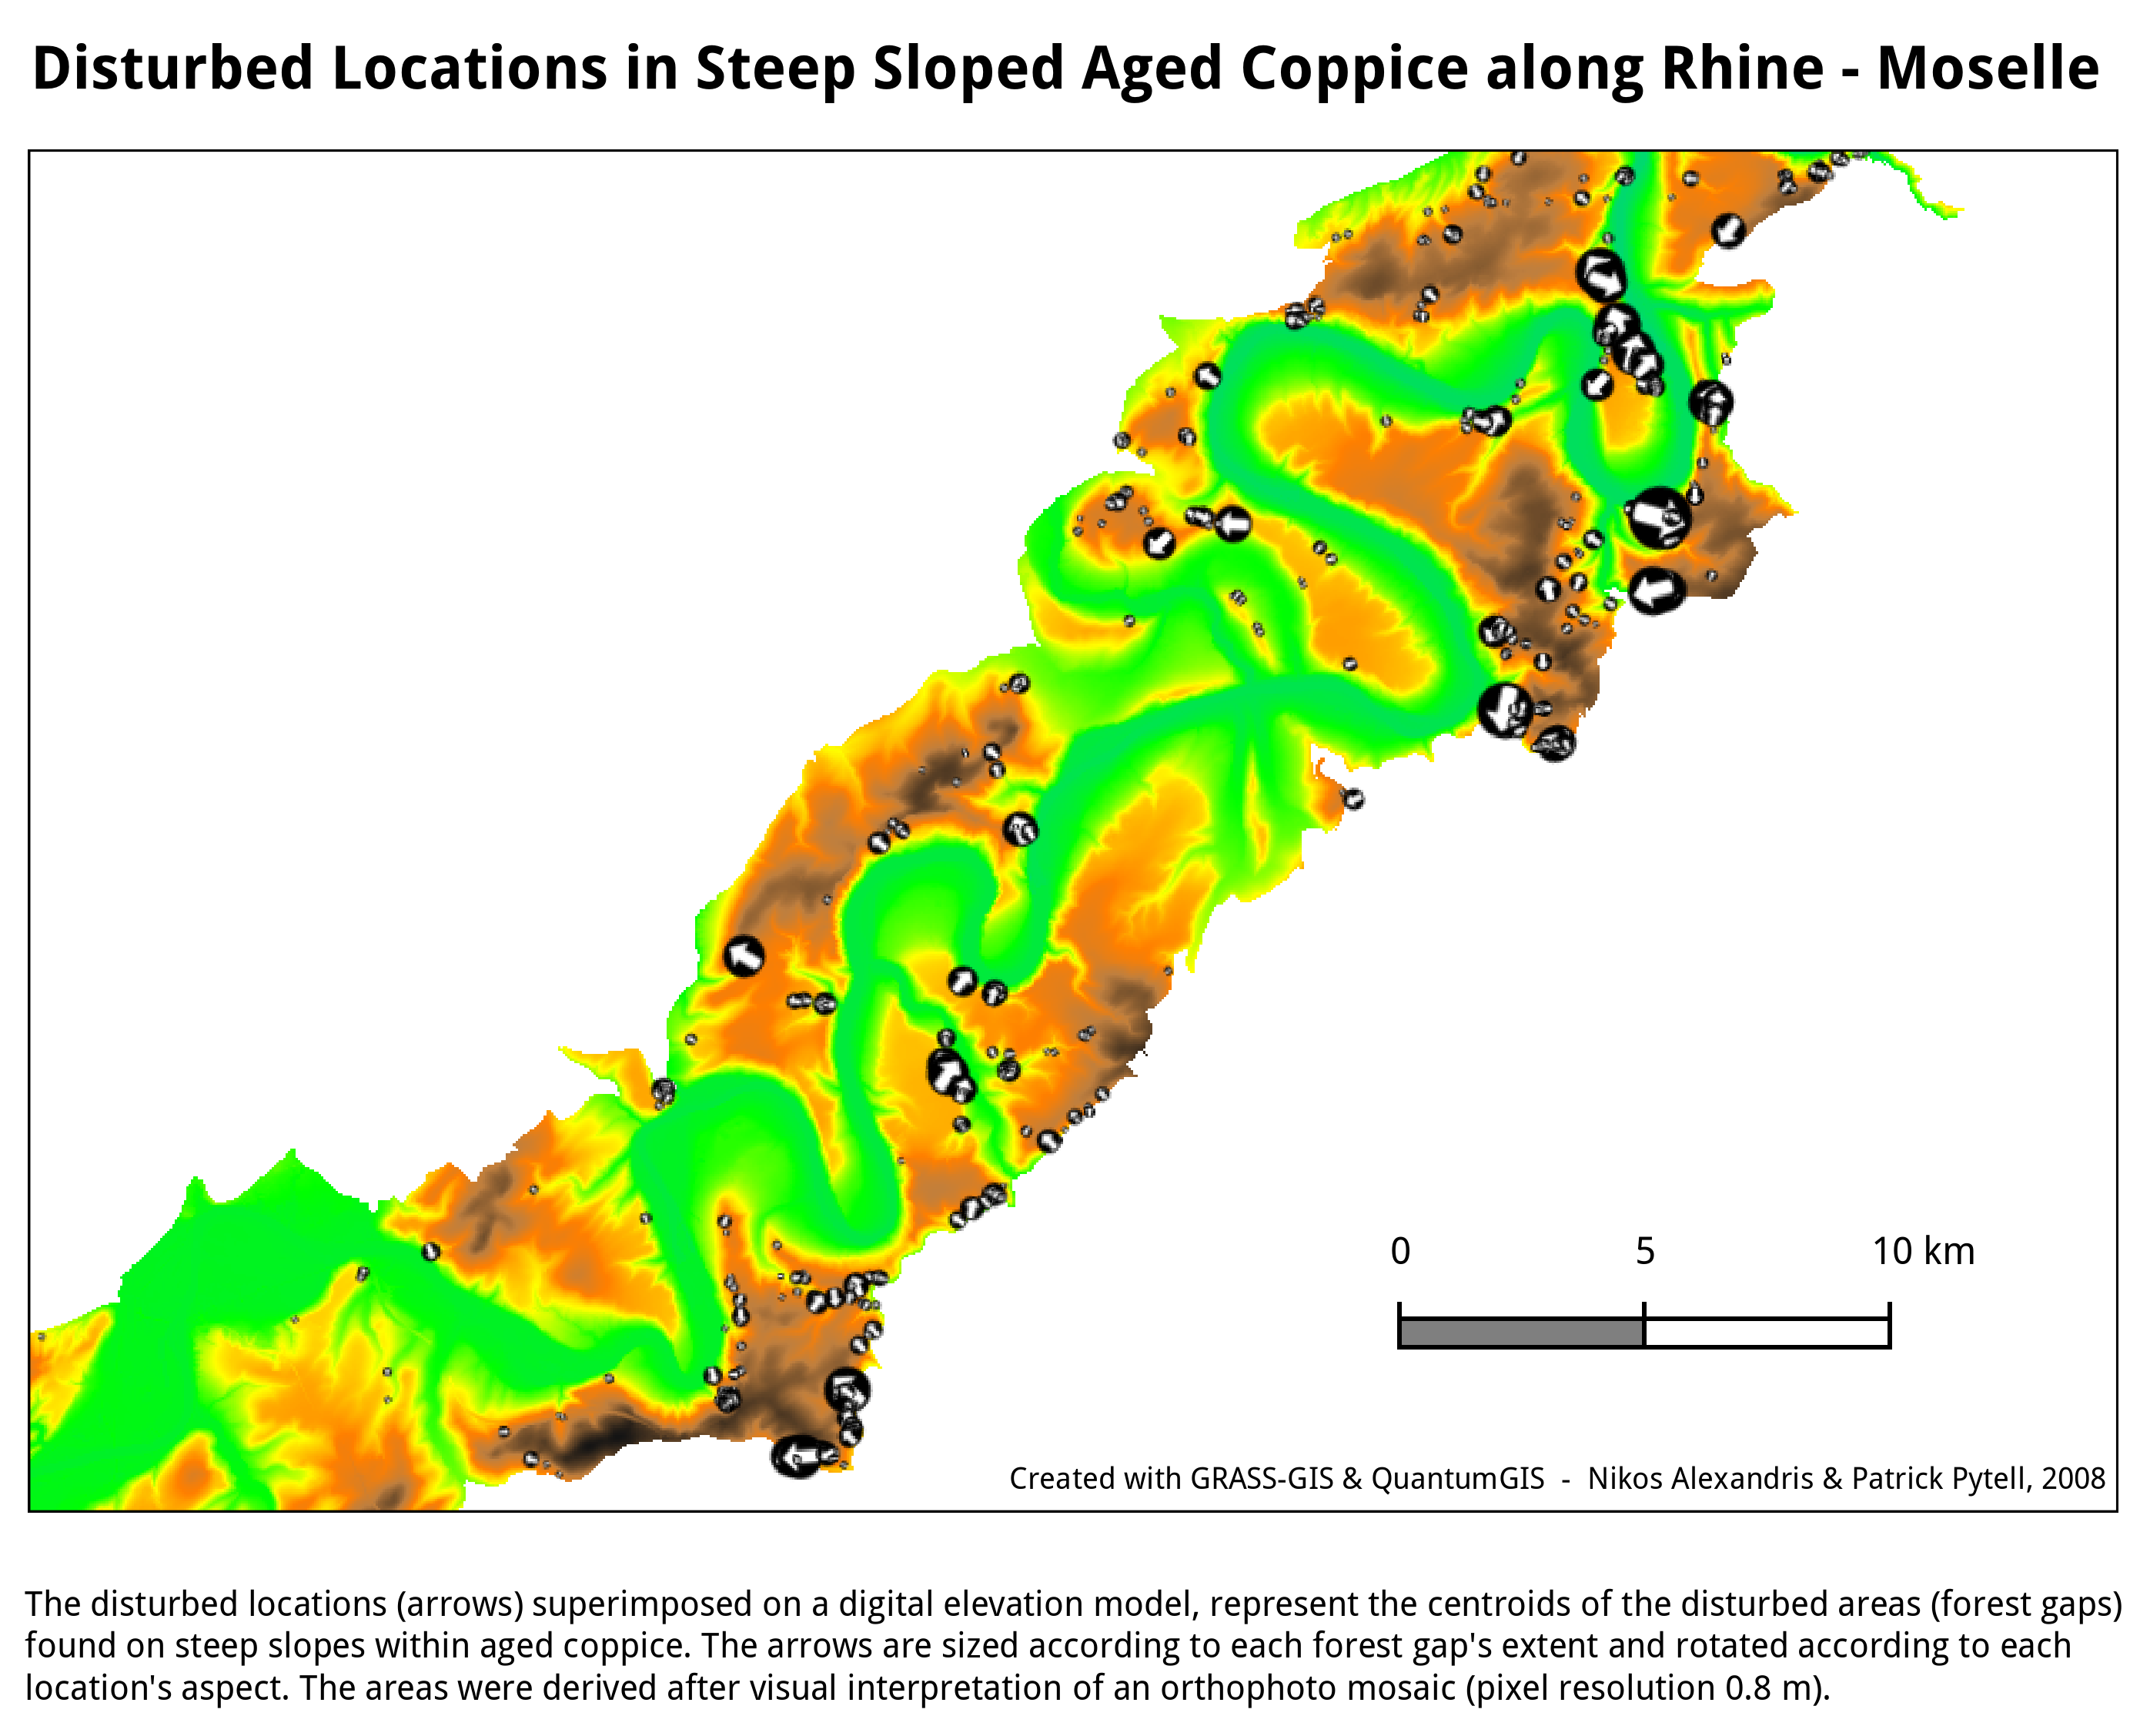
- screenshot of a map created with GRASS and viewed within from QGIS (using aspect data to rotate and area data to adjust the size of arrow-symbols corresponding to forest gaps).
- - Does this fit here? Names and text can be removed as well as a high quality version can be created if required
Web Services
- Markus's PHP earthquake map: http://grass.itc.it/spearfish/php_grass_earthquakes.php
- Jachym's contributions
- PyWPS
- The new one
- There is a lot of the stuff
- r.in.wms, v.in.wfs
- CSISS/GMU contributions: GRASS_based geospatial web services
- A lot of web services are developed based on GRASS functions for imagery/raster and vector map processing
- They are standard web services, which allow anyone to invoke with their own client applications
- All these web services also could be invoked through our GeOnAS interface
- OSU IPPC GRASSLinks:
Modeling and Statistics
this sections needs a better title
- Dylan's Spearfish bugsites cluster plot: http://casoilresource.lawr.ucdavis.edu/drupal/node/340
- Some R variograms etc
Animations
- see Movies
2D MPEGs
(r.out.mpeg et al)
- old MPEG-1 canyon fly through
- - added
- Bob Covill had some ETOPO5 world bathymetry fly throughs
- - added
- Still need to add new movies from Bob
- Maris' r.lakes Latvia animations at http://mpa.itc.it/markus/grass61/demos/rlake/
- (don't use the bad Trento figures there)
3.5 and 4D
- moving NVIZ cutting planes
- example South America movie from Bob - added
- Paraview
More sections?
Feel free to suggest something.
Category:Promotion (GRASS Promotion Team)
