Cartography: Difference between revisions
Jump to navigation
Jump to search
mNo edit summary |
m (remove hardcoded version specific urls, use latest version) |
||
| (14 intermediate revisions by 5 users not shown) | |||
| Line 4: | Line 4: | ||
=== Using ps.map as cartographic engine === | === Using ps.map as cartographic engine === | ||
* [[WxGUI Cartographic Composer]] is an graphical user interface to {{cmd|ps.map}}. | |||
* [[psmap_simple_example|Simple ps.map examples]] ([http://grass.ibiblio.org/download/data6.php Spearfish dataset]) | * [[psmap_simple_example|Simple ps.map examples]] ([http://grass.ibiblio.org/download/data6.php Spearfish dataset]) | ||
| Line 14: | Line 16: | ||
* ps.map example demonstrating a [[Psmap_flooding_example|scripted flood risk map]] | * ps.map example demonstrating a [[Psmap_flooding_example|scripted flood risk map]] | ||
* [http:// | * [http://164.15.12.207/grass/psmap/ Thematic maps] of Belgium | ||
* Create [[ps.map_graph_paper|graph paper]] ready for printing. | * Create [[ps.map_graph_paper|graph paper]] ready for printing. | ||
| Line 27: | Line 29: | ||
[[File:Forestgaps_Moseltal_Germany.png|thumb|center|400px]] | [[File:Forestgaps_Moseltal_Germany.png|thumb|center|400px]] | ||
=== Display monitors === | |||
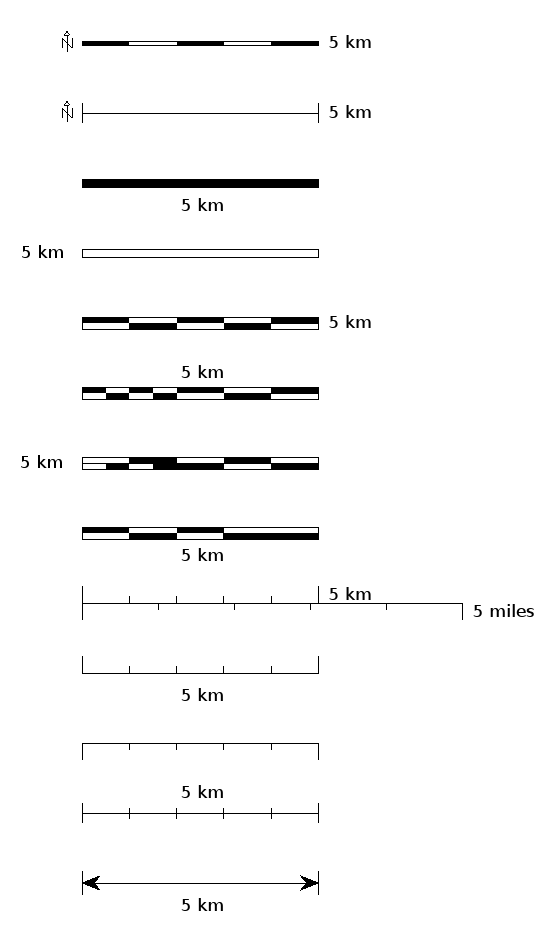
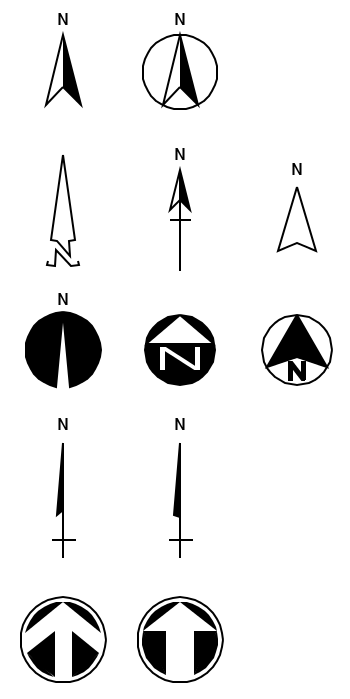
In addition to the hardcopy plots you can make with the {{cmd|ps.map}} command and its [[wxGUI]] [[WxGUI Cartographic Composer|Cartographic Composer]]), in GRASS 7 the {{cmd|d.barscale}} module can draw a number of styles of bar scale and north arrows directly in the live GIS display monitor; in GRASS 6.4.3+ the north arrows can be drawn on the monitor with the {{cmd|d.graph}} module or the {{AddonCmd|d.mark}} addon module and the appropriate [[IconSymbols|symbol]] (available with true-north rotation and line thickness settings). Style, text placement (or none), distance units, color, font, and fontsize can be controlled. Here are some examples: | |||
[[Image:barscales7.png]] [[Image:n_arrows7.png]] | |||
=== Using GMT === | === Using GMT === | ||
| Line 34: | Line 42: | ||
== See also == | == See also == | ||
* [[ | * [[GIS Concepts#Geodesy and Cartography]] | ||
* [[ | * [[Marine Science#Mapping and Cartography]] | ||
* [http://www.shadedrelief.com/realism/index.html Getting Real: Reflecting on the New Look of National Park Service Maps] - nice paper about realistic cartography | |||
[[Category: Applications]] | [[Category: Applications]] | ||
Latest revision as of 10:54, 4 December 2018
GRASS GIS and Cartography
- For graphical examples, see the cartography screenshots page
Using ps.map as cartographic engine
- WxGUI Cartographic Composer is an graphical user interface to ps.map.
- Example showing all standard vareas fill pattern hatches. (Spearfish dataset)
- ps.map example demonstrating a scripted flood risk map
- Thematic maps of Belgium
- Create graph paper ready for printing.
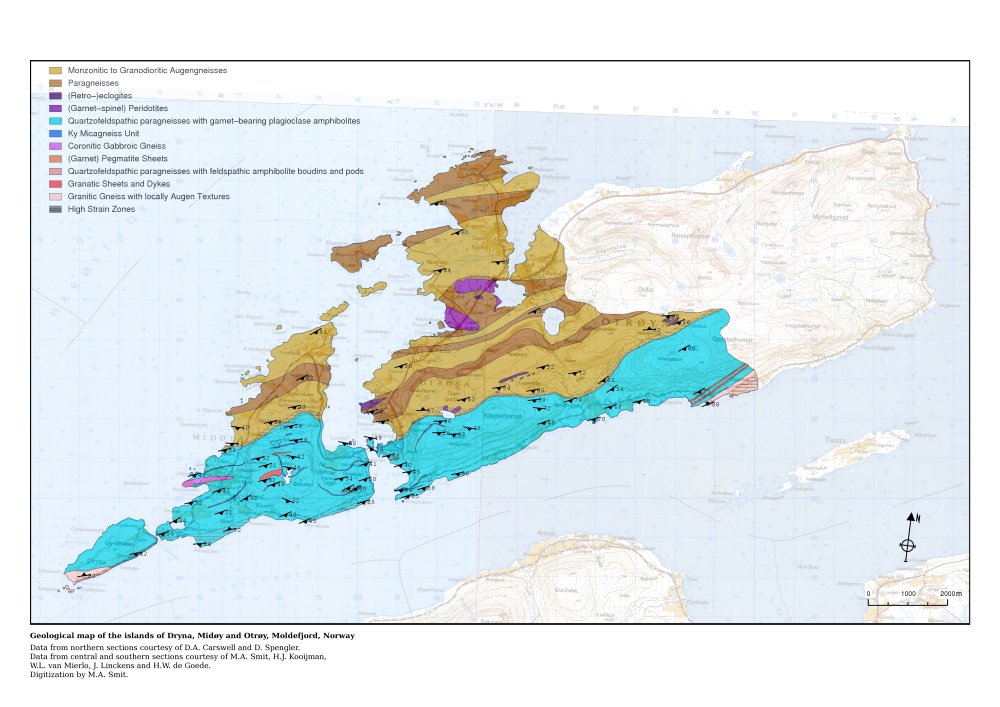
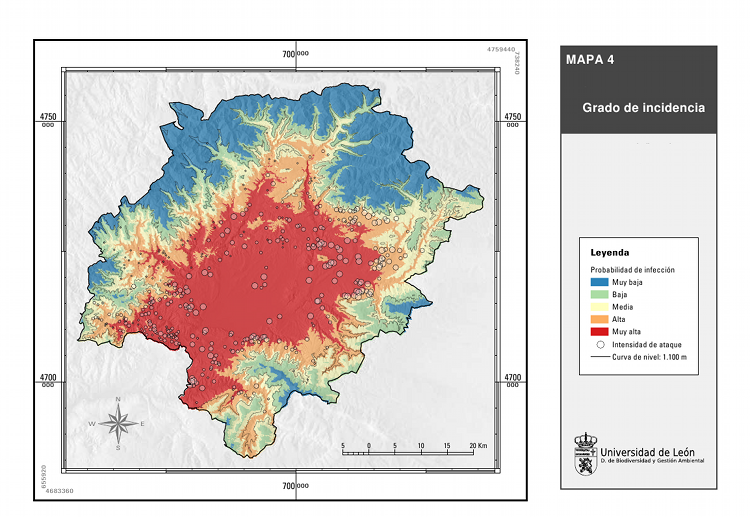
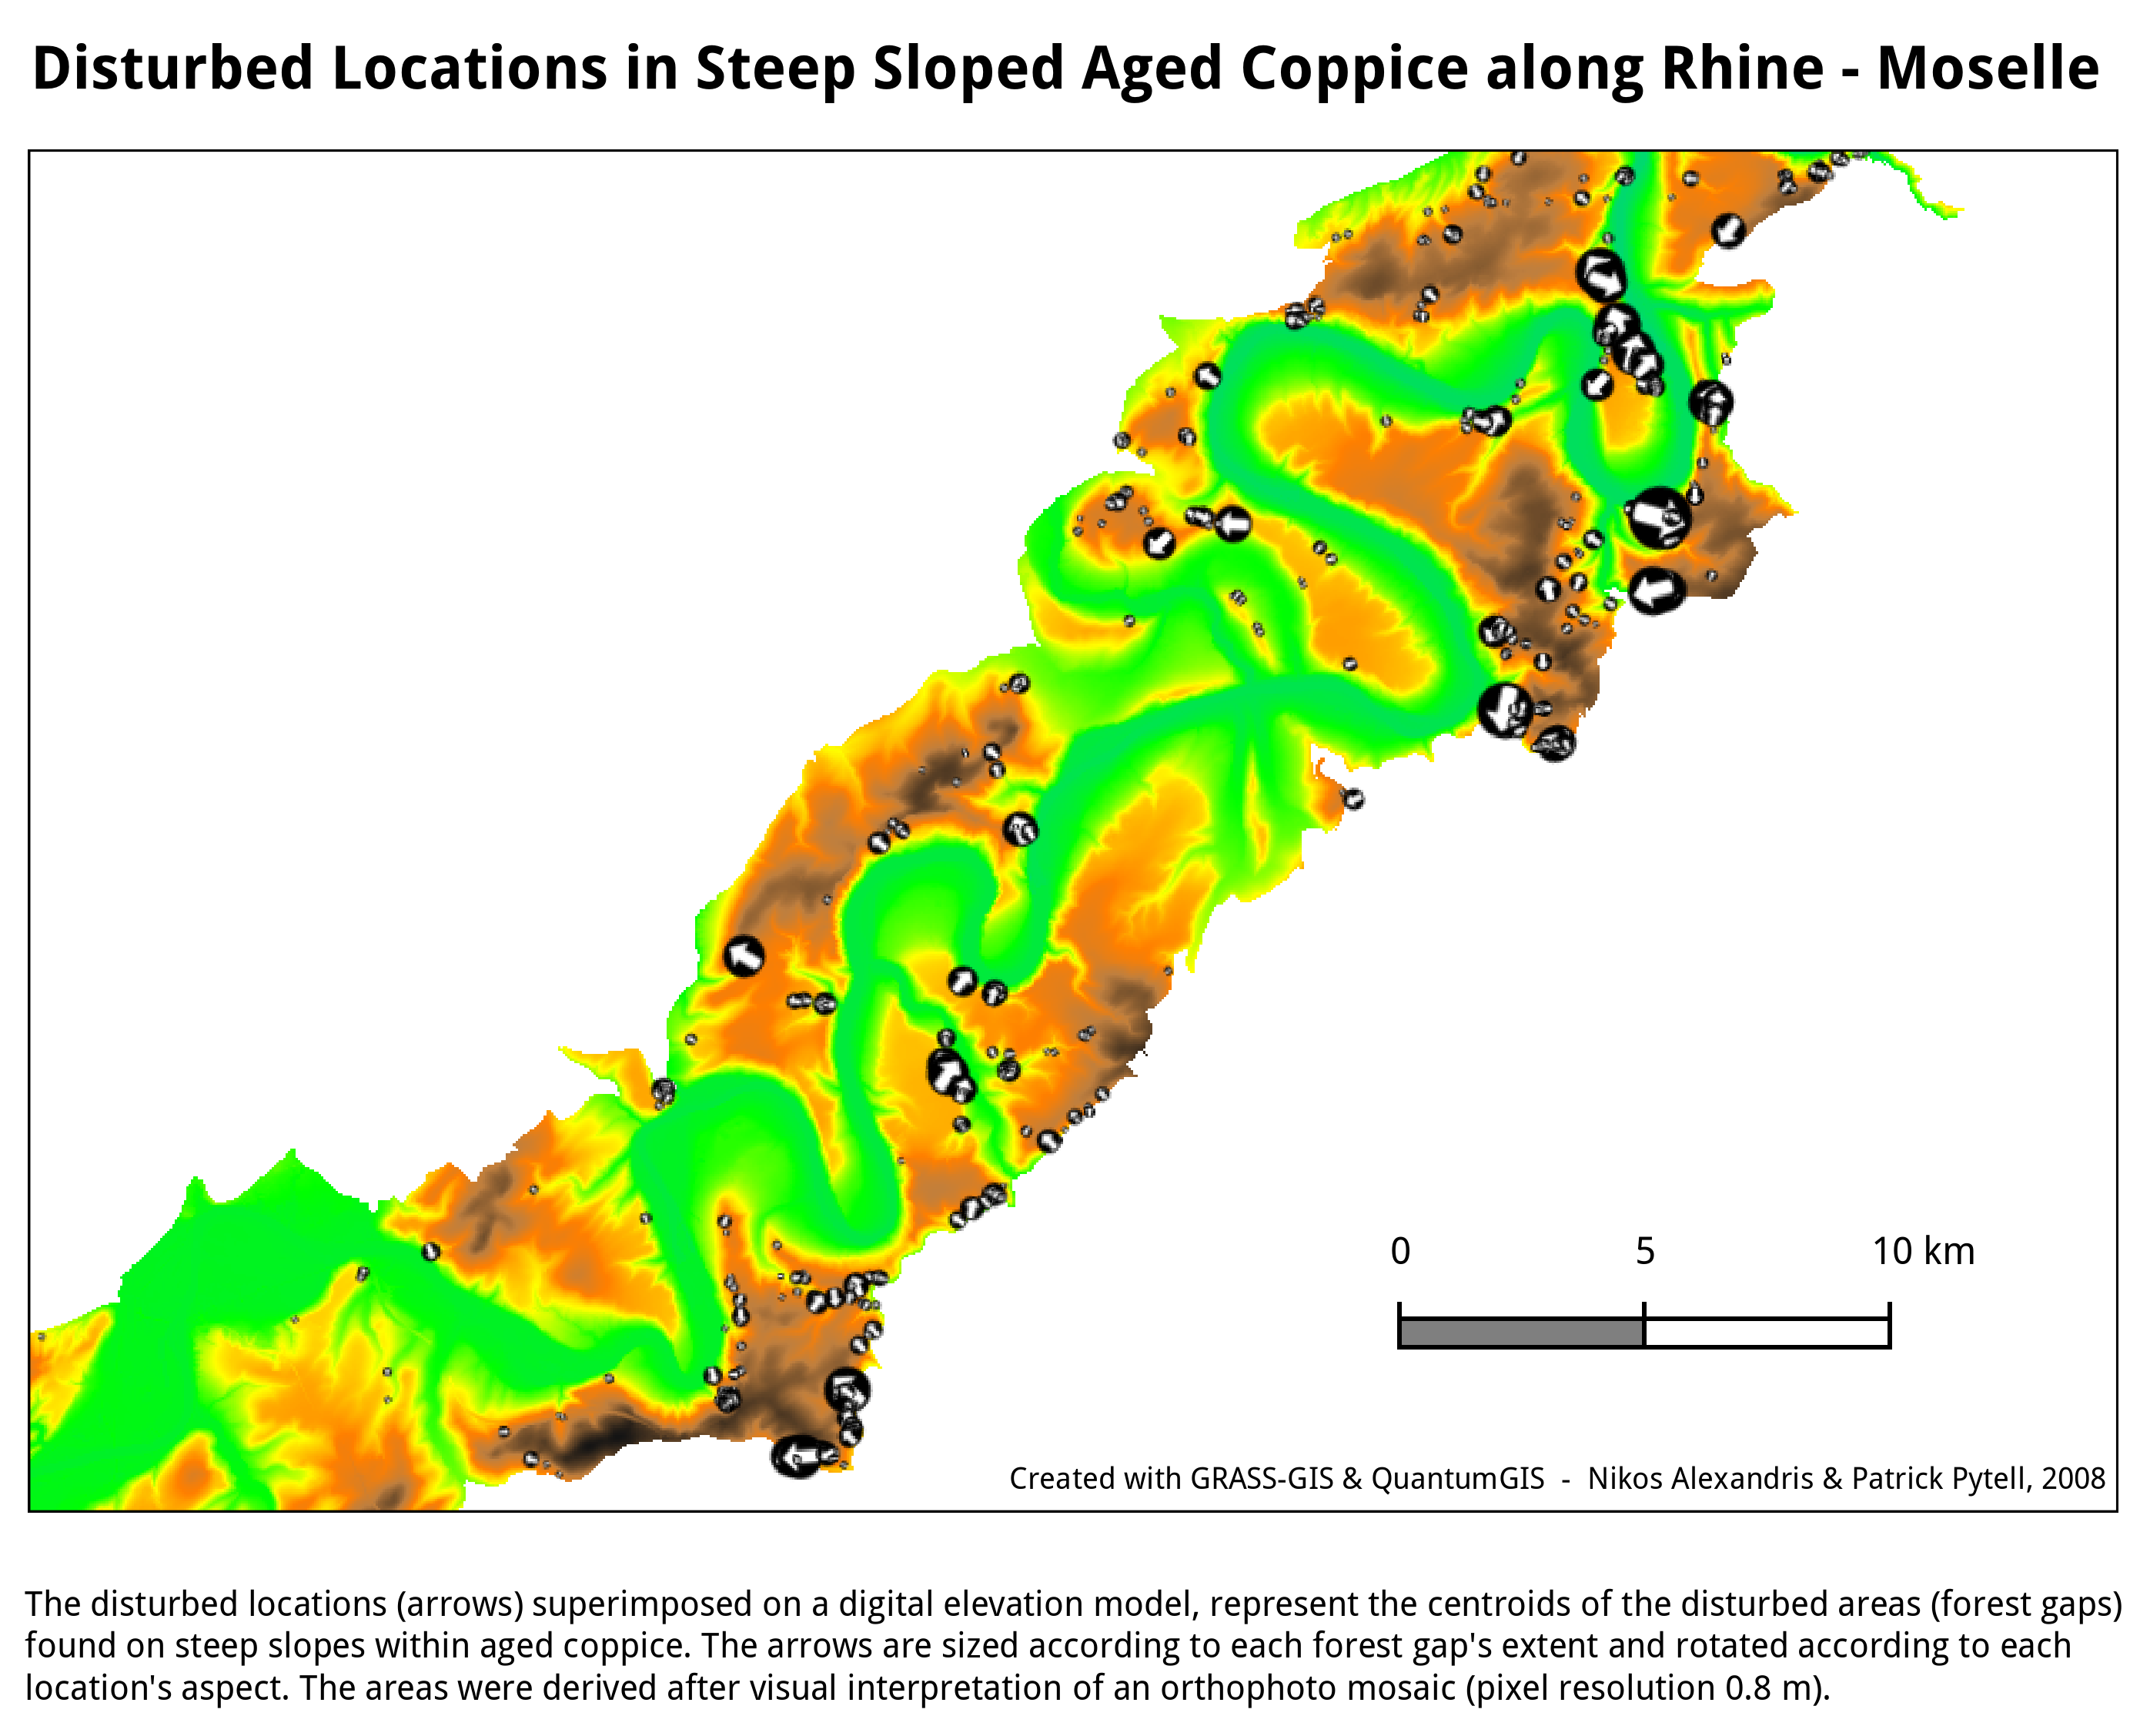
- Some screenshots:
Display monitors
In addition to the hardcopy plots you can make with the ps.map command and its wxGUI Cartographic Composer), in GRASS 7 the d.barscale module can draw a number of styles of bar scale and north arrows directly in the live GIS display monitor; in GRASS 6.4.3+ the north arrows can be drawn on the monitor with the d.graph module or the d.mark addon module and the appropriate symbol (available with true-north rotation and line thickness settings). Style, text placement (or none), distance units, color, font, and fontsize can be controlled. Here are some examples:
Using GMT
See also
- GIS Concepts#Geodesy and Cartography
- Marine Science#Mapping and Cartography
- Getting Real: Reflecting on the New Look of National Park Service Maps - nice paper about realistic cartography
