Voxel: Difference between revisions
m (remove hardcoded version specific urls, use latest version) |
m (→Introduction) |
||
| (One intermediate revision by the same user not shown) | |||
| Line 3: | Line 3: | ||
GRASS GIS is one of the few GIS with volume data support. Here data are stored as a 3D raster with a unit volume called a voxel (volume pixel). Voxels are designed to support for example representations of trivariate continuous fields. | GRASS GIS is one of the few GIS with volume data support. Here data are stored as a 3D raster with a unit volume called a voxel (volume pixel). Voxels are designed to support for example representations of trivariate continuous fields. | ||
=== Import or | === Introduction === | ||
For an overview, see in the manual the '''raster3d summary page {{cmd|raster3dintro}}'''. | |||
:[[Image:chal3d_i.gif]] [[Image:chal4d_i.gif]] | |||
:[[Image:nviz_isosurf3d_small.jpg]] | |||
=== Import or creation of volumes === | |||
'''From 3D point data:''' | '''From 3D point data:''' | ||
You can import 3D ASCII raster data in GRASS voxel format using {{cmd|r3.in.ascii}} or {{cmd|r3.in.xyz}}. | You can import 3D ASCII raster data in GRASS voxel format using {{cmd|r3.in.ascii}} or {{cmd|r3.in.xyz}}. There are different possibilities: | ||
* For ''r3.in.ascii'' the data need to be plain and properly ordered value data with a header (see the manual for the format). | * For ''r3.in.ascii'' the data need to be plain and properly ordered value data with a header (see the manual for the format). | ||
* In case of regular 3D data (x,y,z,value) in a CSV style file, use ''r3.in.xyz'' with method "mean". This only works properly when one value falls into a target voxel. | * In case of regular 3D data (x,y,z,value) in a CSV style file, use ''r3.in.xyz'' with method "mean". This only works properly when one value falls into a target voxel. | ||
* Import x,y,z,... data as 3D with the {{cmd|v.in.ascii}} "-z" flag and "z=" column parameter (see below for voxel interpolation): | |||
v.in.ascii -z format=point cat=1 x=2 y=3 z=4 | |||
* You can convert a 2D vector into a 3D vector with {{cmd|v.extrude}} (take elevation values from vector attribute column) or {{cmd|v.drape}} (interpolate elevation values from a raster DEM map) - see below for voxel interpolation. | |||
'''From 2D raster maps:''' | '''From 2D raster maps:''' | ||
| Line 20: | Line 29: | ||
=== Voxel operations === | === Voxel operations === | ||
Among other functionalities, there are available: | |||
A 3D groundwater flow model is implement in {{cmd|r3.gwflow}}. | * Powerful '''3D map algebra''' is implemented in {{cmd|r3.mapcalc}}. | ||
* '''Cross-sections''' can be generated with {{cmd|r3.cross.rast}}. | |||
* Voxels can be '''interpolated''' from 3D point dat from {{cmd|v.vol.rst}}. | |||
* A '''3D groundwater flow model''' is implement in {{cmd|r3.gwflow}}. | |||
See also the {{cmd|raster3dintro}} for more details. | |||
=== Voxel statistics === | === Voxel statistics === | ||
| Line 39: | Line 49: | ||
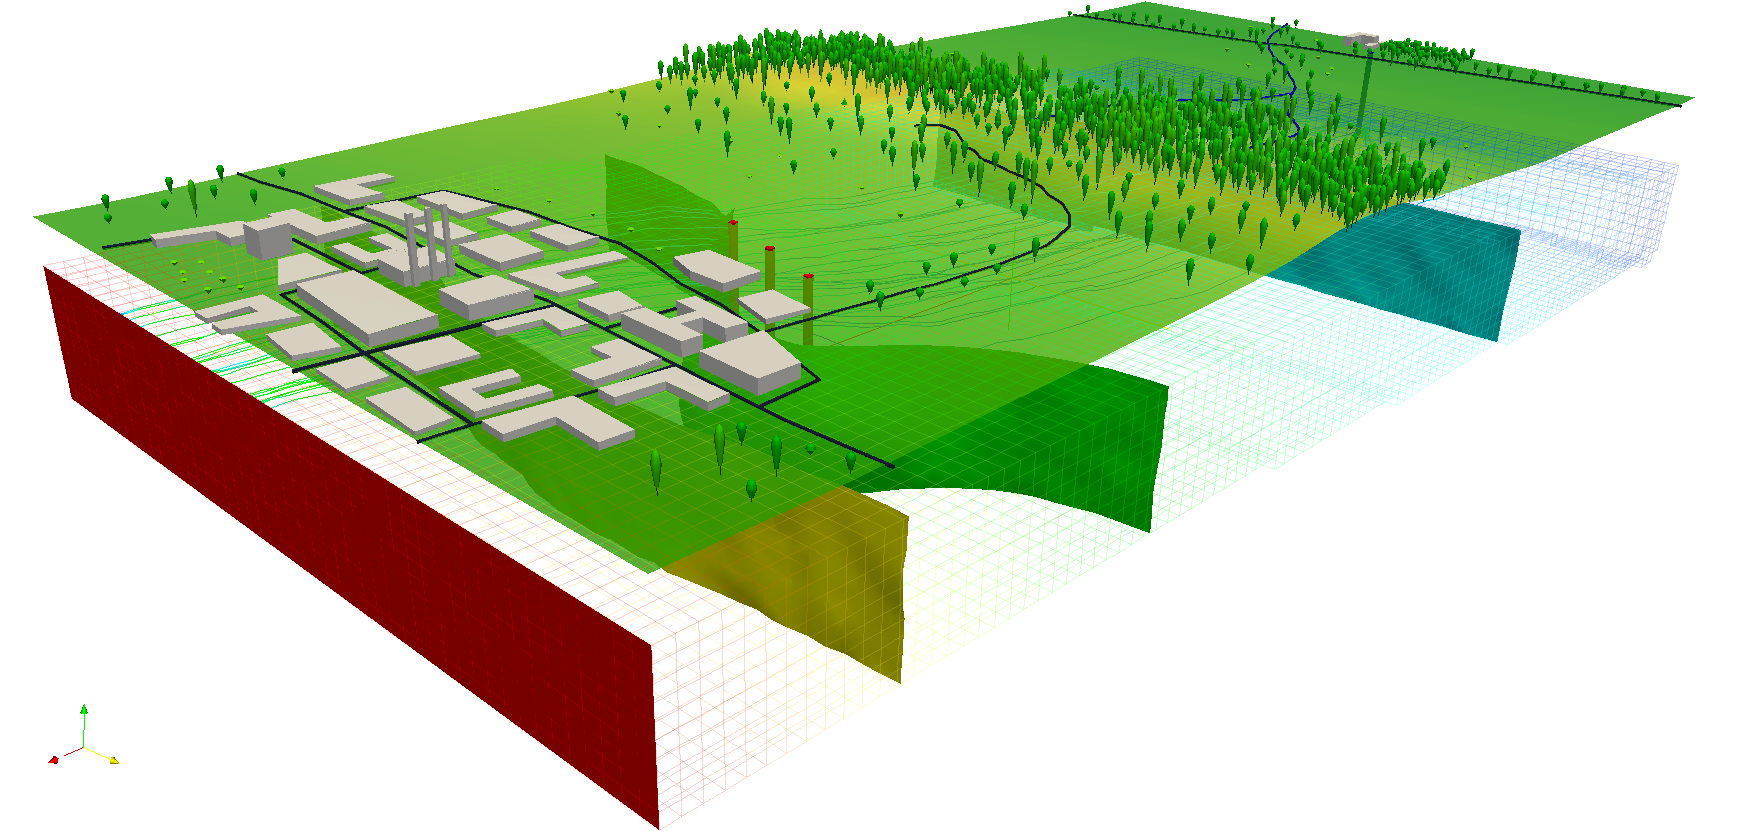
[[Image:LausanneDemoDataset3dParaview_10.png|thumb|center|400px|3D groundwater flow]] | [[Image:LausanneDemoDataset3dParaview_10.png|thumb|center|400px|3D groundwater flow]] | ||
=== Region settings === | |||
Region settings are handled by the {{cmd|g.region}} module. | |||
Special 3D raster controls for {{cmd|g.region}} <code>-p3</code> include: | |||
-3 flag: Prints 3D settings | |||
rast3d Set region to match this 3D raster map (both 2D and 3D values) | |||
t Value for the top edge | |||
b Value for the bottom edge | |||
res3 3D grid resolution (north-south, east-west and top-bottom) | |||
tbres Top-bottom grid resolution 3D | |||
<!-- (??) 3dview Set region to match this 3dview file --> | |||
=== Worksflows === | |||
From the mailing list: [https://lists.osgeo.org/pipermail/grass-user/2006-April/033602.html Raster 3D from DEMs (drillhole data)]. | |||
== Technical details of implementation == | == Technical details of implementation == | ||
Latest revision as of 09:52, 21 April 2022
3D raster map (voxel) processing in GRASS
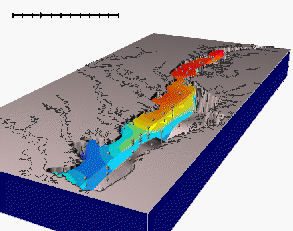
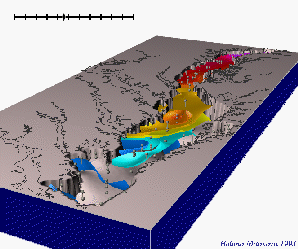
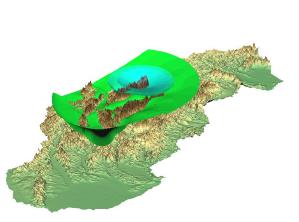
GRASS GIS is one of the few GIS with volume data support. Here data are stored as a 3D raster with a unit volume called a voxel (volume pixel). Voxels are designed to support for example representations of trivariate continuous fields.
Introduction
For an overview, see in the manual the raster3d summary page raster3dintro.
Import or creation of volumes
From 3D point data:
You can import 3D ASCII raster data in GRASS voxel format using r3.in.ascii or r3.in.xyz. There are different possibilities:
- For r3.in.ascii the data need to be plain and properly ordered value data with a header (see the manual for the format).
- In case of regular 3D data (x,y,z,value) in a CSV style file, use r3.in.xyz with method "mean". This only works properly when one value falls into a target voxel.
- Import x,y,z,... data as 3D with the v.in.ascii "-z" flag and "z=" column parameter (see below for voxel interpolation):
v.in.ascii -z format=point cat=1 x=2 y=3 z=4
- You can convert a 2D vector into a 3D vector with v.extrude (take elevation values from vector attribute column) or v.drape (interpolate elevation values from a raster DEM map) - see below for voxel interpolation.
From 2D raster maps:
You can also create a volume raster model based on 2D raster data by converting 2D raster slices into 3D raster or a 3D volume map based on 2D elevation and value raster maps.
See the raster3dintro for more details.
Voxel operations
Among other functionalities, there are available:
- Powerful 3D map algebra is implemented in r3.mapcalc.
- Cross-sections can be generated with r3.cross.rast.
- Voxels can be interpolated from 3D point dat from v.vol.rst.
- A 3D groundwater flow model is implement in r3.gwflow.
See also the raster3dintro for more details.
Voxel statistics
Volume statistics can be calculated with r3.stats and r3.univar.
Visualization
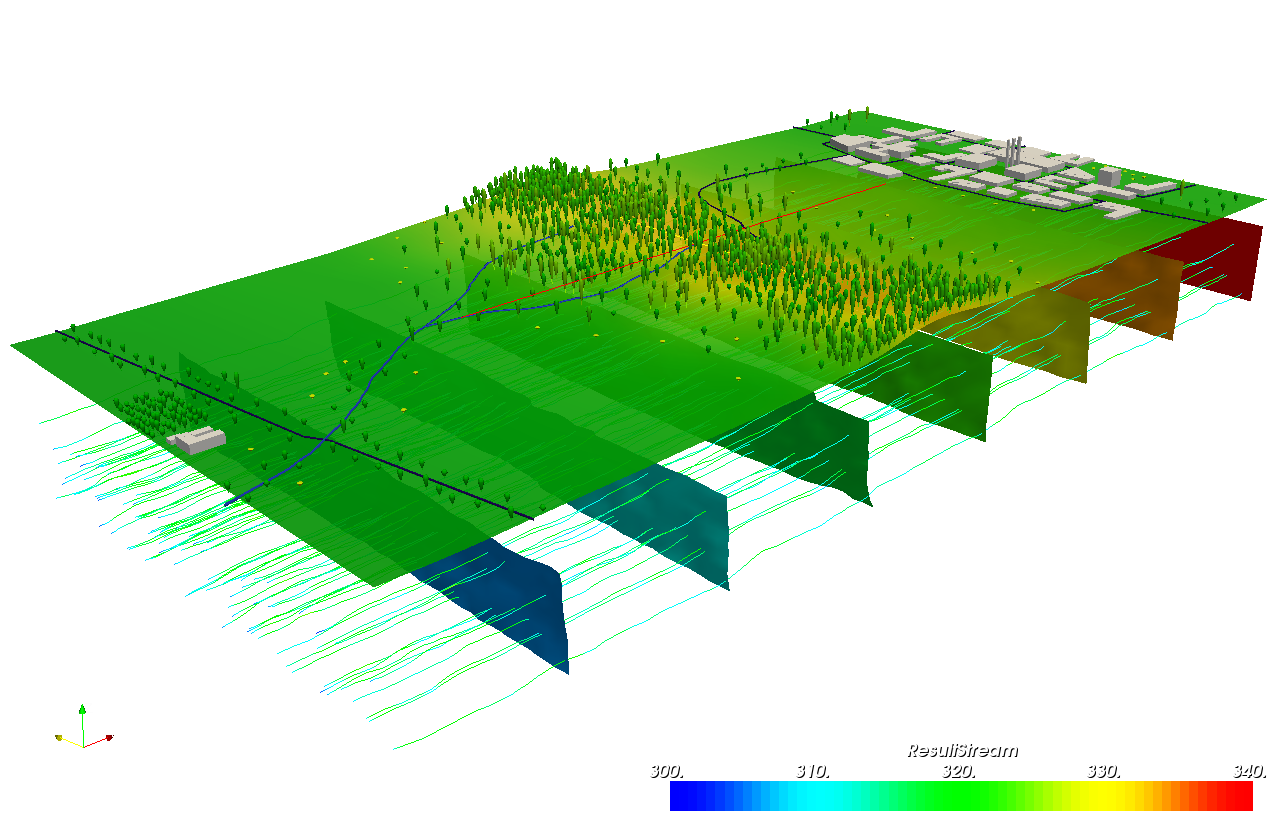
The NVIZ n-dimensional viewer supports voxel visualization. As an alternative, you can use the external Paraview application, see GRASS and Paraview:
Region settings
Region settings are handled by the g.region module.
Special 3D raster controls for g.region -p3 include:
-3 flag:  Prints 3D settings
 rast3d   Set region to match this 3D raster map (both 2D and 3D values)
      t   Value for the top edge
      b   Value for the bottom edge
   res3   3D grid resolution (north-south, east-west and top-bottom)
  tbres   Top-bottom grid resolution 3D
Worksflows
From the mailing list: Raster 3D from DEMs (drillhole data).
Technical details of implementation
The 3D raster (voxel) implementation in GRASS GIS is using a tiled based storage approach (see related page in the Programmer's Manual). The tiles can be stored in compressed form (zlib in GRASS7) or uncompressed form on the hard disk. Usually you store them in compressed form. Hence in case you have many tiles that are empty or have equal data, the compression is very high. GRASS can handle 3D raster maps up to hundreds of GB in size. The main memory is not an issue when processing 3D raster maps, since only a limited number of tiles is read into main memory at runtime. You can specify the tile size of each 3D raster map that you create. Hence you can adjust it to the needs of , e.g. soil depths resolution.
In addition you can specify a 3D raster mask that works pretty the same way as masks in the raster approach in GRASS GIS.
