GRASS Debugging: Difference between revisions
(how to save the core dump) |
(+Python function tracing) |
||
| (30 intermediate revisions by 5 users not shown) | |||
| Line 1: | Line 1: | ||
The following hints assume to work on a working-copy of the | The following hints assume to work on a working-copy of the [https://github.com/OSGeo/grass GRASS GIS source code]. | ||
Additionally it is good to have set the debugging symbols during compile-time. Do not strip the libraries or use optimization in the compile. see {{src|INSTALL}} and {{src|doc/debugging.txt}} in the source code for more information. | Additionally it is good to have set the debugging symbols during compile-time. Do not strip the libraries or use optimization in the compile. see {{src|INSTALL}} and {{src|doc/debugging.txt}} in the source code for more information. | ||
| Line 5: | Line 5: | ||
== Reporting bugs == | == Reporting bugs == | ||
* Bugs should be reported in the GRASS [ | * Bugs should be reported in the GRASS GIS [https://github.com/OSGeo/grass/issues bug and wish tracker]. | ||
* Please use [[GRASS_messages_translation#How_to_change_the_language|untranslated messages]] in your bug reports. The following command will disable the use of translated messages: | * Please use [[GRASS_messages_translation#How_to_change_the_language|untranslated messages]] in your bug reports. The following command will disable the use of translated messages: | ||
| Line 38: | Line 38: | ||
All GRASS modules send out a return code of "0" if they exit successfully and "1" if they have exited with an error. This is typically accompanied by an "ERROR: " message. | All GRASS modules send out a return code of "0" if they exit successfully and "1" if they have exited with an error. This is typically accompanied by an "ERROR: " message. | ||
On UNIX (Linux, | On UNIX (Linux, Mac OS, and [[Cygwin]]) directly after a command line module ends you can type "<tt>echo $?</tt>" and it will tell you the exit code. In a MS-Windows DOS box the equivalent command is "<tt>echo %errorlevel%</tt>". | ||
Note that some modules (like {{cmd|g.findfile}}) exit with a status of 1 if it (for example) could not find a file, which may be exactly the test the module was run to perform. In that way the return code can be used in script logic. Thus the exit code only reports EXIT_SUCCESS or EXIT_FAILURE, but a failure can happen for any number of reasons, expected or unexpected, and is not a reason to panic in and of itself. | Note that some modules (like {{cmd|g.findfile}}) exit with a status of 1 if it (for example) could not find a file, which may be exactly the test the module was run to perform. In that way the return code can be used in script logic. Thus the exit code only reports EXIT_SUCCESS or EXIT_FAILURE, but a failure can happen for any number of reasons, expected or unexpected, and is not a reason to panic in and of itself. | ||
| Line 46: | Line 46: | ||
You'll need binaries built with debugging symbols [todo], then you can use tools like [http://support.microsoft.com/default.aspx?scid=kb;EN-US;308538 Dr. Watson] and [http://msdn.microsoft.com/en-us/windows/hardware/gg463016 windbg.exe] from Microsoft. | You'll need binaries built with debugging symbols [todo], then you can use tools like [http://support.microsoft.com/default.aspx?scid=kb;EN-US;308538 Dr. Watson] and [http://msdn.microsoft.com/en-us/windows/hardware/gg463016 windbg.exe] from Microsoft. | ||
Some hints for how this could work can be found [http://www.cruisersforum.com/forums/f134/opencpn-version-2-4-beta-build-423-a-59409-4.html#post677590 here]. | Some hints for how this could work can be found [http://www.cruisersforum.com/forums/f134/opencpn-version-2-4-beta-build-423-a-59409-4.html#post677590 here]. | ||
== DLL dependencies == | |||
Sometimes it is needed to disentangle DLL dependencies. A reasonable tool is "Dependency Walker" (free as in free lunch, not software libero): http://www.dependencywalker.com | |||
== Using GDB == | == Using GDB == | ||
The [ | The [https://www.gnu.org/software/gdb/ GNU Debugger] may be used to diagnose '''<tt>Segmentation Faults</tt>''' and other weirdness. | ||
=== Compile Time Setup === | === Compile Time Setup === | ||
To add debugging information into the built binary, | To add debugging information into the built binary, first run | ||
make distclean | |||
Then configure the source code with ''-g'' being added to the CFLAGS arguments: | |||
CFLAGS="-ggdb -Wall -Werror-implicit-function-declaration" ./configure ... | CFLAGS="-ggdb -Wall -Werror-implicit-function-declaration" ./configure ... | ||
| Line 59: | Line 66: | ||
Do '''not''' use ''-O'' for optimization and do '''not''' strip the binaries with LDFLAGS="-s". | Do '''not''' use ''-O'' for optimization and do '''not''' strip the binaries with LDFLAGS="-s". | ||
Eventually compile the source code and start the GRSS GIS session for debugging (see below). | |||
=== Using gdb on command line === | === Using gdb on command line === | ||
* Running a program inside [ | * Running a program inside [https://en.wikipedia.org/wiki/Gdb GDB] works (installation of GDB required :-) | ||
: (e.g. on [ | : (e.g. on [https://www.debian.org Debian GNU/Linux]: apt-get install gdb) | ||
* Use the exact module name on the command line (at the GRASS prompt) without arguments. Put any command line arguments on the <tt>(gdb)</tt> command line after the word ''run''. | * Use the exact module name on the command line (at the GRASS prompt) without arguments. Put any command line arguments on the <tt>(gdb)</tt> command line after the word ''run''. | ||
| Line 78: | Line 82: | ||
* type "<tt>frame 2</tt>" to switch to the second level function (see the backtrace), there you can again type "<tt>l</tt>" to see where it got up to. | * type "<tt>frame 2</tt>" to switch to the second level function (see the backtrace), there you can again type "<tt>l</tt>" to see where it got up to. | ||
Alternatively, you can add arguments to gdb directly on the command line: | |||
gdb --args v.in.ogr out=bla dsn="PG:dbname=postgis user=me" olayer=postgislayer | gdb --args v.in.ogr out=bla dsn="PG:dbname=postgis user=me" olayer=postgislayer | ||
Additionally, you can tell it to run the process right away: | |||
: use "<tt>attach <pid></tt>" to attach to an existing process (needed for DBMI debugging etc). | |||
gdb -ex run --args v.in.ogr out=bla dsn="PG:dbname=postgis user=me" olayer=postgislayer | |||
=== Attaching to child process === | |||
: in <tt>gdb</tt>, use "<tt>attach <pid></tt>" to attach to an existing process (needed for DBMI or d.mon debugging, etc). | |||
: For details, see this [http://lists.osgeo.org/pipermail/grass-dev/2007-October/033732.html hint] | : For details, see this [http://lists.osgeo.org/pipermail/grass-dev/2007-October/033732.html hint] | ||
How to solve “ptrace operation not permitted” when trying to attach GDB to a process? Run the following ([https://stackoverflow.com/questions/19215177/how-to-solve-ptrace-operation-not-permitted-when-trying-to-attach-gdb-to-a-pro source]) | |||
echo 0 | sudo tee /proc/sys/kernel/yama/ptrace_scope | |||
d.mon example: | |||
<source lang="bash"> | |||
# GRASS GIS session terminal | |||
d.mon start=wx0 | |||
# Examine running wxGUI components by htop program and get pid | |||
# Run in another terminal or in terminal tab | |||
gdb --pid $(pgrep -f /gui/wxpython/mapdisp/main.py) | |||
continue | |||
# And then interact with the wxGUI component (d.mon) | |||
# If wxGUI component crash then you get backtrace with gdb bt command | |||
bt | |||
</source> | |||
=== Saving a core dump for later analysis === | === Saving a core dump for later analysis === | ||
| Line 99: | Line 130: | ||
It is important to note that you must analyze the ''core'' file against the exact version of the executable you were running at the time, and that if you send the ''core'' file to someone else they will be able to see the data you had loaded in the program at the time (if you are a consultant, you client might not like that). | It is important to note that you must analyze the ''core'' file against the exact version of the executable you were running at the time, and that if you send the ''core'' file to someone else they will be able to see the data you had loaded in the program at the time (if you are a consultant, you client might not like that). | ||
<!-- Tcl/TK has been dropped years ago | |||
=== Using gdb with a mixed C/TclTK application === | === Using gdb with a mixed C/TclTK application === | ||
| Line 126: | Line 157: | ||
through the function (with "next"), printing out the values of any | through the function (with "next"), printing out the values of any | ||
variables as they are assigned. | variables as they are assigned. | ||
--> | |||
=== Using gdb within GNU Emacs === | === Using gdb within GNU Emacs === | ||
* start [ | Notes: | ||
:* 'C' is usually key 'Ctrl' | |||
:* 'M' is usually key 'Alt' | |||
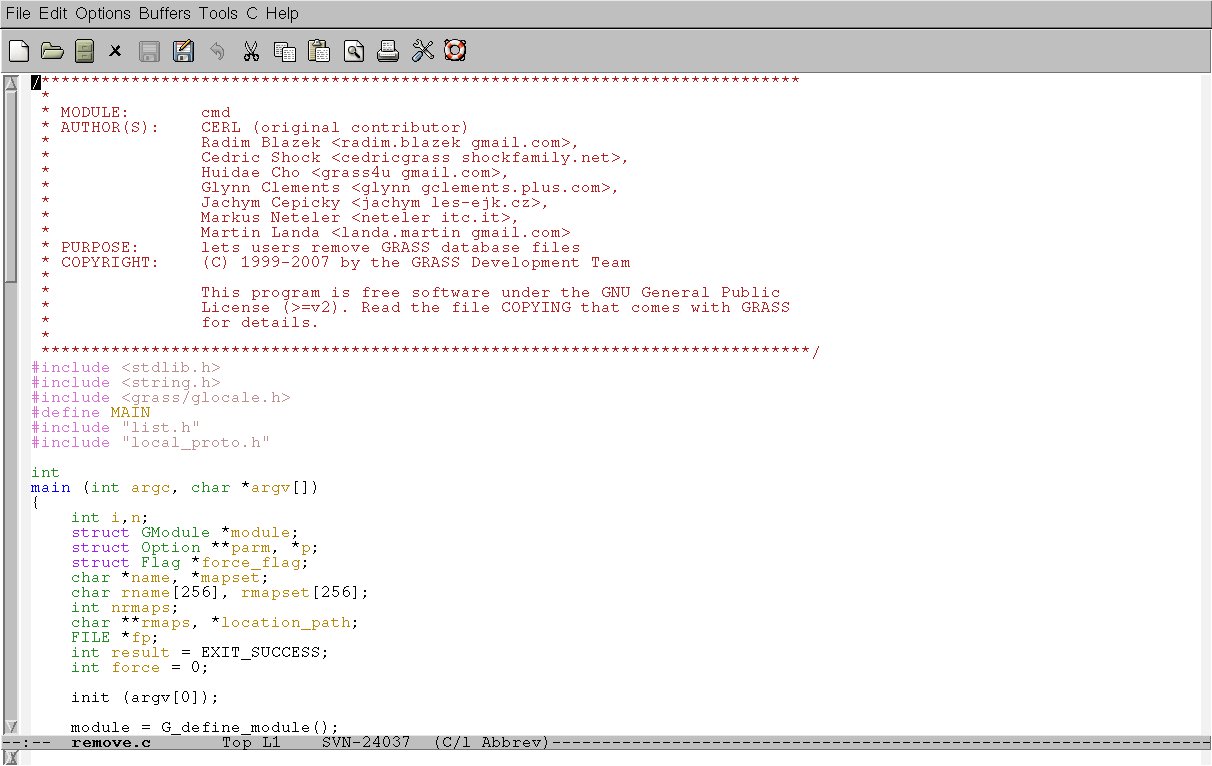
* start [https://en.wikipedia.org/wiki/Emacs GNU Emacs] within GRASS session, e.g. | |||
emacs general/manage/cmd/remove.c | emacs general/manage/cmd/remove.c | ||
| Line 135: | Line 171: | ||
[[Image:Emacs_gdb-1a.png|center|640px]] | [[Image:Emacs_gdb-1a.png|center|640px]] | ||
* create second buffer by <tt>C-x 2</tt> | * create second buffer by <tt>C-x 2</tt> | ||
[[Image:Emacs_gdb-2.png|center|640px]] | [[Image:Emacs_gdb-2.png|center|640px]] | ||
| Line 147: | Line 183: | ||
=== Using DDD (gdb graphical frontend) === | === Using DDD (gdb graphical frontend) === | ||
* debugging a program inside [ | * debugging a program inside [https://en.wikipedia.org/wiki/Ddd DDD] is rather easy (installation of ddd and gdb required), (on Debian GNU/Linux: <tt>apt-get install gdb ddd</tt>; on Fedora: <tt>dnf install ddd</tt>). Start debugger with GRASS command (e.g., {{cmd|v.in.ogr}}): | ||
ddd v.in.ogr | ddd v.in.ogr | ||
| Line 193: | Line 229: | ||
GRASS> ldd `which v.in.ogr` | GRASS> ldd `which v.in.ogr` | ||
For a library: | For a library: | ||
$ ldd /usr/src/grass/ | $ ldd /usr/src/grass/grass78/dist.x86_64-pc-linux-gnu/lib/libgrass_gis.so | ||
The output may look like this: | |||
linux-vdso.so.1 (0x00007ffe1cf03000) | |||
libgrass_datetime.7.8.so => /usr/src/grass/grass78/dist.x86_64-pc-linux-gnulib/libgrass_datetime.7.8.so (0x00007fae7a6cf000) | |||
libz.so.1 => /lib64/libz.so.1 (0x00007fae7a6b5000) | |||
libzstd.so.1 => /lib64/libzstd.so.1 (0x00007fae7a5df000) | |||
libm.so.6 => /lib64/libm.so.6 (0x00007fae7a499000) | |||
libc.so.6 => /lib64/libc.so.6 (0x00007fae7a2cf000) | |||
libpthread.so.0 => /lib64/libpthread.so.0 (0x00007fae7a2ad000) | |||
/lib64/ld-linux-x86-64.so.2 (0x00007fae7a769000) | |||
''ldd'' is good for spotting if the right libraries are used (in the correct path etc). | |||
* On <span style="border-bottom: 1px solid #000;">Mac | * On <span style="border-bottom: 1px solid #000;">Mac OS</span> "otool -L `which v.in.ogr`" almost does the same job. | ||
* For <span style="border-bottom: 1px solid #000;">MS Windows</span> the [ | * For <span style="border-bottom: 1px solid #000;">MS Windows</span> the [https://www.dependencywalker.com/ Dependency Walker] program (depends.exe) might help. | ||
=== Library search path === | === Library search path === | ||
| Line 215: | Line 253: | ||
Alternatively you can add the library path to the $LD_LIBRARY_PATH environmental variable. | Alternatively you can add the library path to the $LD_LIBRARY_PATH environmental variable. | ||
* [https://www.cprogramming.com/tutorial/shared-libraries-linux-gcc.html Read more about how shared libraries work on Linux] | |||
== Using nm and objdump == | == Using nm and objdump == | ||
| Line 233: | Line 273: | ||
$ objdump -T /usr/lib/libX11.so | $ objdump -T /usr/lib/libX11.so | ||
$ objdump -R /usr/lib/libX11.so | $ objdump -R /usr/lib/libX11.so | ||
== Using LD_DEBUG == | |||
To see in which order the various libraries are called, run the command with <tt>LD_DEBUG=files</tt>. | |||
For example: | |||
LD_DEBUG=files r.info elevation | |||
== Using strace == | == Using strace == | ||
Running the command through strace could give you another hint what is going wrong somewhere. It shows the command execution at low level. | |||
For example: | For example: | ||
| Line 243: | Line 290: | ||
== Using Valgrind == | == Using Valgrind == | ||
* [ | * [https://valgrind.org Valgrind] is a tool to check for memory leaks and memory errors. | ||
Examples | ;Examples | ||
* analysis of heap usage | * analysis of ''heap usage'' | ||
CMD="v.in.ascii -zt z=3 in=lidaratm2_250k.txt out=lidaratm2_250k fs=," | CMD="v.in.ascii -zt z=3 in=lidaratm2_250k.txt out=lidaratm2_250k fs=," | ||
valgrind --tool=massif | valgrind --tool=massif $CMD --o | ||
* analysis of memory leaks (include --trace-children=yes to profile e.g. the DBF driver or other children) | * analysis of ''memory leaks'' (include <code>--trace-children=yes</code> to profile e.g. the DBF driver or other children) | ||
<!-- | <!-- | ||
** Quick addrcheck tool: | ** Quick addrcheck tool: | ||
| Line 260: | Line 307: | ||
valgrind --tool=memcheck --leak-check=yes --show-reachable=yes $CMD --o | valgrind --tool=memcheck --leak-check=yes --show-reachable=yes $CMD --o | ||
* The default is to send Valgrind output to stderr. Add < | ;Notes | ||
* The default is to send Valgrind output to stderr. Add <code>--log-file=<filename></code> to save output to a file, but note (if it matters) that you will lose any interleaved GRASS debug messages from the log that way. | |||
* Valgrind can create PostScript output charts. To convert PostScript to PNG: | * Valgrind can create PostScript output charts. To convert PostScript to PNG: | ||
: ('pstoimg' is part of the latex2html Debian package) | : ('pstoimg' is part of the latex2html Debian package) | ||
* If you get something like this (huge value for "still reachable"): | |||
<pre> | |||
> ==13217== LEAK SUMMARY: | |||
> ==13217== definitely lost: 964 bytes in 39 blocks | |||
> ==13217== indirectly lost: 72 bytes in 10 blocks | |||
> ==13217== possibly lost: 79 bytes in 4 blocks | |||
> ==13217== still reachable: 9,025,026,330 bytes in 188,201,312 blocks | |||
</pre> | |||
then please run valgrind again with <tt>--show-reachable=yes</tt> as you will want to find out where these 9,025,026,330 bytes (in this example) have been allocated. | |||
pstoimg -aaliastext -flip r90 -out massif.550.png -scale 1.3 -crop a massif.550.ps | pstoimg -aaliastext -flip r90 -out massif.550.png -scale 1.3 -crop a massif.550.ps | ||
* '''Graphical user interfaces''': | |||
** https://kcachegrind.github.io/html/Home.html | |||
** https://invent.kde.org/sdk/massif-visualizer | |||
** https://wiki.gnome.org/Attic/MassifG | |||
== Using Electric Fence == | == Using Electric Fence == | ||
* [ | * [https://en.wikipedia.org/wiki/Electric_Fence Electric Fence] checks for bad memory writes, ie specific malloc() over-runs and under-runs. | ||
('''''Insert howto here''''') | ('''''Insert howto here''''') | ||
| Line 284: | Line 349: | ||
=== Kcachegrind === | === Kcachegrind === | ||
[ | [https://kcachegrind.github.io/html/Home.html kcachegrind] is a visualization tool for [https://valgrind.org Valgrind]'s callgrind profiling tool (formerly known as the calltree skin). It is very simple to use. Install the GraphViz package as well. | ||
* The [ | * The [https://valgrind.org/docs/manual/cl-manual.html callgrind chapter] in the Valgrind user manual | ||
Example: | Example: | ||
# Spearfish dataset | # Spearfish dataset | ||
g.region | g.region raster=elevation.dem | ||
v.random n=10000 out=rand10k | v.random n=10000 out=rand10k | ||
v.db.addtable rand10k column="elev INT" | v.db.addtable rand10k column="elev INT" | ||
| Line 296: | Line 361: | ||
valgrind --tool=callgrind --trace-children=yes $CMD | valgrind --tool=callgrind --trace-children=yes $CMD | ||
This creates a file containing profiling information which kcachegrind can load. We include < | This creates a file containing profiling information which kcachegrind can load. We include <code>--trace-children</code> in the above example so we can profile the DBF driver process as well as the main {{cmd|v.what.rast}} process. | ||
kcachegrind callgrind.out.12345 | kcachegrind callgrind.out.12345 | ||
| Line 302: | Line 367: | ||
In the above example from the two process costs we can see that 99.5% is taken by the dbf process and 0.5% is taken by the v.what.rast process. Within the dbf process almost 50% is taken by <tt>G_debug()</tt> and <tt>G_strcasecmp()</tt>. | In the above example from the two process costs we can see that 99.5% is taken by the dbf process and 0.5% is taken by the v.what.rast process. Within the dbf process almost 50% is taken by <tt>G_debug()</tt> and <tt>G_strcasecmp()</tt>. | ||
=== gprof === | === Duration: time === | ||
<code>time</code> with disk IO und socket message traffic (note: <code>time</code> with full path): | |||
/usr/bin/time -f "\nreal %E\nuser %U\nsys %S\nCPU %P\nRAM (KB) %M\nwaits %w\nswaps %W\ninputs %I\noutputs %O\nsocket rec %r\nsocket sent %s\nsignals %k\n" grass_command ... | |||
=== Profiling: gprof === | |||
Profiling a program: Where does it spend its time? | |||
* [ | * [https://sourceware.org/binutils/docs/gprof/ GNU gprof] user guide | ||
* [http://linuxgazette.net/100/vinayak.html Profiling programs using gprof] - article from the Linux Gazzette, March 2004 (#100) | * [http://linuxgazette.net/100/vinayak.html Profiling programs using gprof] - article from the Linux Gazzette, March 2004 (#100) | ||
* https://www.nas.nasa.gov/hecc/support/kb/using-gprof-for-performance-analysis_671.html | |||
Compile GRASS with <code>-pg</code> flag. E.g. | Compile GRASS with <code>-pg</code> flag. E.g. | ||
| Line 317: | Line 391: | ||
v.select -tg ain=geodetic_swwake_pts bin=urbanarea out=x ope=overlap --o | v.select -tg ain=geodetic_swwake_pts bin=urbanarea out=x ope=overlap --o | ||
It will generate the profiling data and store in the file <code>gmon.out</code>. | |||
Use gprof to generate human readable output from the file <code>gmon.out</code>: | |||
gprof $(which v.what) gmon.out | |||
To store the output in a reporting file, run | |||
gprof $(which v.what) gmon.out > profile.txt | |||
== Using Mudflap == | == Using Mudflap == | ||
| Line 342: | Line 421: | ||
== Skimming the ChangeLog for changes == | == Skimming the ChangeLog for changes == | ||
* use the tool {{src|tools/ | * use the tool {{src|tools/gitlog2changelog.py}} for generating a local changelog-file, by simply running: | ||
** make changelog | |||
* | |||
<!-- abandoned years ago | |||
== Tcl/Tk debugging == | == Tcl/Tk debugging == | ||
| Line 370: | Line 447: | ||
** "Tcl quoting hell" http://wiki.tcl.tk/1726 | ** "Tcl quoting hell" http://wiki.tcl.tk/1726 | ||
** "1 minute intro to tcl" http://www.pconline.com/~erc/tcl.htm | ** "1 minute intro to tcl" http://www.pconline.com/~erc/tcl.htm | ||
--> | |||
== Shell script debugging == | == Shell script debugging == | ||
| Line 388: | Line 466: | ||
== Python script debugging == | == Python script debugging == | ||
('' | === Python debugging with pdb === | ||
See also: | |||
* pdb Background: https://docs.python.org/3/library/pdb.html | |||
* pdb Tutorial: https://fedoramagazine.org/getting-started-python-debugger/ | |||
1. Edit the GRASS python script and add this line to the import section: | |||
<source lang="python"> | |||
import pdb | |||
</source> | |||
2. Edit and add this line within the code where to debug: | |||
<source lang="python"> | |||
pdb.set_trace() | |||
</source> | |||
3. Run the python script normally, it will stop where pdb.set_trace() was added: | |||
r.unpack x60030_2000.green.histo2000_g.pack | |||
<source lang="python"> | |||
GRASS 7.8 (patUTM32):~ > r.unpack x60030_2000.green.histo2000_g.pack | |||
> /home/neteler/software/grass78/dist.x86_64-unknown-linux-gnu/scripts/r.unpack(93)main() | |||
-> diff_result_1 = diff_result_2 = None | |||
</source> | |||
3. Now you can either (s)tep through or (n)ext or (r)run the rest (c: continue, q: quit) | |||
<source lang="python"> | |||
(Pdb) s | |||
</source> | |||
While "s" will descend in functions, "n" will go to the next line. | |||
To show the source code, use "ll". | |||
See the manual for [https://docs.python.org/3/library/pdb.html#debugger-commands Debugger Commands] | |||
4. To print the content of variables: | |||
<source lang="python"> | |||
(Pdb) s | |||
> /usr/lib64/python3.8/posixpath.py(73)join() | |||
-> path = a | |||
(Pdb) a | |||
a = /grassdata/patUTM32/hist_matching | |||
p = ('..', 'PERMANENT', 'PROJ_INFO') | |||
(Pdb) | |||
</source> | |||
Now will likely be able to better find the issues in your Python script. | |||
See | See also: https://docs.python.org/3/library/pdb.html | ||
=== wxPython GUI debugging === | === wxPython GUI debugging === | ||
'''A) Debug messages:''' | |||
[[wxGUI]] prints debugging messages in five levels (1-5). To redirect these messages to the terminal, run | [[wxGUI]] prints debugging messages in five levels (1-5). To redirect these messages to the terminal, run | ||
g.gisenv set=WX_DEBUG=1 | |||
'''B) Using a debugger:''' | |||
For real debugging of wxgui.py ([https://github.com/OSGeo/grass/blob/master/general/g.gui/main.c source code]) with gdb or other tools, so you can use something like: | |||
cd grass/src | |||
python gui/wxpython/wxgui.py | |||
or: | |||
python $GISBASE/gui/wxpython/wxgui.py | |||
or with gdb e.g.: | |||
<source lang="bash"> | |||
# GRASS GIS session terminal | |||
d.mon start=wx0 | |||
# Examine running wxGUI components by htop program and get pid | |||
# Run in another terminal or in terminal tab | |||
gdb --pid $(pgrep -f /gui/wxpython/mapdisp/main.py) | |||
continue | |||
# And then interact with the wxGUI component (d.mon) | |||
# If wxGUI component crash then you get backtrace with gdb bt command | |||
bt | |||
</source> | |||
Well, but that's just how to run the Python code directly. | |||
=== | === Python debugging with gdb === | ||
See https://wiki.python.org/moin/DebuggingWithGdb | |||
=== Komodo dbgp.client.brk() === | === Komodo dbgp.client.brk() === | ||
| Line 412: | Line 561: | ||
* See http://docs.activestate.com/komodo/5.0/debugpython.html | * See http://docs.activestate.com/komodo/5.0/debugpython.html | ||
from dbgp.client import brk | from dbgp.client import brk | ||
=== Python function tracing === | |||
Functions can be traced using the 'trace' module. It generates a trace of program execution, and annotated statement coverage and more. | |||
python -m trace --ignore-dir=../lib --trace mymain.py | |||
See also (for example): https://www.tutorialspoint.com/trace-or-track-python-statement-execution-trace | |||
=== Profiling python scripts === | === Profiling python scripts === | ||
* See | * See https://docs.python.org/library/profile.html | ||
=== Memory debugging of python scripts === | |||
* memray: Memray is a memory profiler for Python | |||
** https://bloomberg.github.io/memray/ | |||
== PROJ debugging == | |||
= | See also: https://proj.org/usage/environmentvars.html?highlight=debugging | ||
For unix with a | For unix with a style shell use export: | ||
export PROJ_DEBUG=5 | export PROJ_DEBUG=5 | ||
cs2cs ... | cs2cs ... | ||
[[Category:Development]] | [[Category:Development]] | ||
Latest revision as of 18:30, 27 August 2022
The following hints assume to work on a working-copy of the GRASS GIS source code.
Additionally it is good to have set the debugging symbols during compile-time. Do not strip the libraries or use optimization in the compile. see INSTALL and doc/debugging.txt in the source code for more information.
Reporting bugs
- Bugs should be reported in the GRASS GIS bug and wish tracker.
- Please use untranslated messages in your bug reports. The following command will disable the use of translated messages:
export LC_ALL=C
- Users should read the Mailing list etiquette page before posting questions to the grass-dev mailing list.
Patches
- For instructions on creating and applying patches the see Patches wiki page.
Setting GRASS-environment variables (numbers: 1-5)
g.gisenv set="DEBUG=1"
- A higher debug level means you see more messages.
- These messages are always present regardless of compiler settings.
- A setting of "5" is the most verbose, "0" is no debug messages.
Common problems
- Check that the region settings are not totally overwhelming for the raster engine. While there is no set upper limit, anything bigger than 20000x20000 is considered large, and anything an order of mangnitude bigger than that will most likely end with out of memory or large file problems, especially on 32-bit platforms built without LFS support. Many modules will continue to work on these huge datasets, but processing time may make it not worth the while. See Memory issues for more tips.
g.region -p
Watching top
top is a nice command line utility for watching a process's progression. While it won't give you many hard metrics it will give you an idea of what is happening. To make the view a little more stable, with top running from the command line press "M" to sort by memory usage.
Return codes
All GRASS modules send out a return code of "0" if they exit successfully and "1" if they have exited with an error. This is typically accompanied by an "ERROR: " message.
On UNIX (Linux, Mac OS, and Cygwin) directly after a command line module ends you can type "echo $?" and it will tell you the exit code. In a MS-Windows DOS box the equivalent command is "echo %errorlevel%".
Note that some modules (like g.findfile) exit with a status of 1 if it (for example) could not find a file, which may be exactly the test the module was run to perform. In that way the return code can be used in script logic. Thus the exit code only reports EXIT_SUCCESS or EXIT_FAILURE, but a failure can happen for any number of reasons, expected or unexpected, and is not a reason to panic in and of itself.
Using a C debugger on MS Windows
You'll need binaries built with debugging symbols [todo], then you can use tools like Dr. Watson and windbg.exe from Microsoft. Some hints for how this could work can be found here.
DLL dependencies
Sometimes it is needed to disentangle DLL dependencies. A reasonable tool is "Dependency Walker" (free as in free lunch, not software libero): http://www.dependencywalker.com
Using GDB
The GNU Debugger may be used to diagnose Segmentation Faults and other weirdness.
Compile Time Setup
To add debugging information into the built binary, first run
make distclean
Then configure the source code with -g being added to the CFLAGS arguments:
CFLAGS="-ggdb -Wall -Werror-implicit-function-declaration" ./configure ...
Do not use -O for optimization and do not strip the binaries with LDFLAGS="-s".
Eventually compile the source code and start the GRSS GIS session for debugging (see below).
Using gdb on command line
- Running a program inside GDB works (installation of GDB required :-)
- (e.g. on Debian GNU/Linux: apt-get install gdb)
- Use the exact module name on the command line (at the GRASS prompt) without arguments. Put any command line arguments on the (gdb) command line after the word run.
 gdb `which v.in.ogr`
 run  out=some_map dsn="PG:dbname=postgis user=me" olayer=postgislayer
- when it crashes, type "bt full" for a full backtrace
- type "l" to list where in the source code it got to
- type "frame 2" to switch to the second level function (see the backtrace), there you can again type "l" to see where it got up to.
Alternatively, you can add arguments to gdb directly on the command line:
gdb --args v.in.ogr out=bla dsn="PG:dbname=postgis user=me" olayer=postgislayer
Additionally, you can tell it to run the process right away:
gdb -ex run --args v.in.ogr out=bla dsn="PG:dbname=postgis user=me" olayer=postgislayer
Attaching to child process
- in gdb, use "attach <pid>" to attach to an existing process (needed for DBMI or d.mon debugging, etc).
- For details, see this hint
How to solve “ptrace operation not permitted” when trying to attach GDB to a process? Run the following (source)
echo 0 | sudo tee /proc/sys/kernel/yama/ptrace_scope
d.mon example:
# GRASS GIS session terminal
d.mon start=wx0

# Examine running wxGUI components by htop program and get pid
# Run in another terminal or in terminal tab
gdb --pid $(pgrep -f /gui/wxpython/mapdisp/main.py)
continue

# And then interact with the wxGUI component (d.mon)
# If wxGUI component crash then you get backtrace with gdb bt command
bt
Saving a core dump for later analysis
On Linux, often if a program exits with a "Segmentation Fault" the program will exit leaving nothing behind. It is however possible to dump the state of the program (the memory "core") to a file. Ubuntu & Mac users may have seen with some crashing programs the long list of memory address computerese which it then asks if you want to report back to the authors.
On Linux, you can check if you are set to "dump the core" to a file with the ulimit command:
ulimit -c
a response of "0" means no core file will be written. Core files can be very large (depending on how much system RAM the program was using at the time it crashed), so is usually kept off. You can temporarily change the limit in a command terminal to dump the whole thing with:
ulimit -c unlimited
which will save a file called "core" in the present directory (if you have permission to write there). You can then analyze the core at a later time with:
gdb `which g.module` /path/to/core/file
It is important to note that you must analyze the core file against the exact version of the executable you were running at the time, and that if you send the core file to someone else they will be able to see the data you had loaded in the program at the time (if you are a consultant, you client might not like that).
Using gdb within GNU Emacs
Notes:
- 'C' is usually key 'Ctrl'
- 'M' is usually key 'Alt'
- start GNU Emacs within GRASS session, e.g.
emacs general/manage/cmd/remove.c
- create second buffer by C-x 2
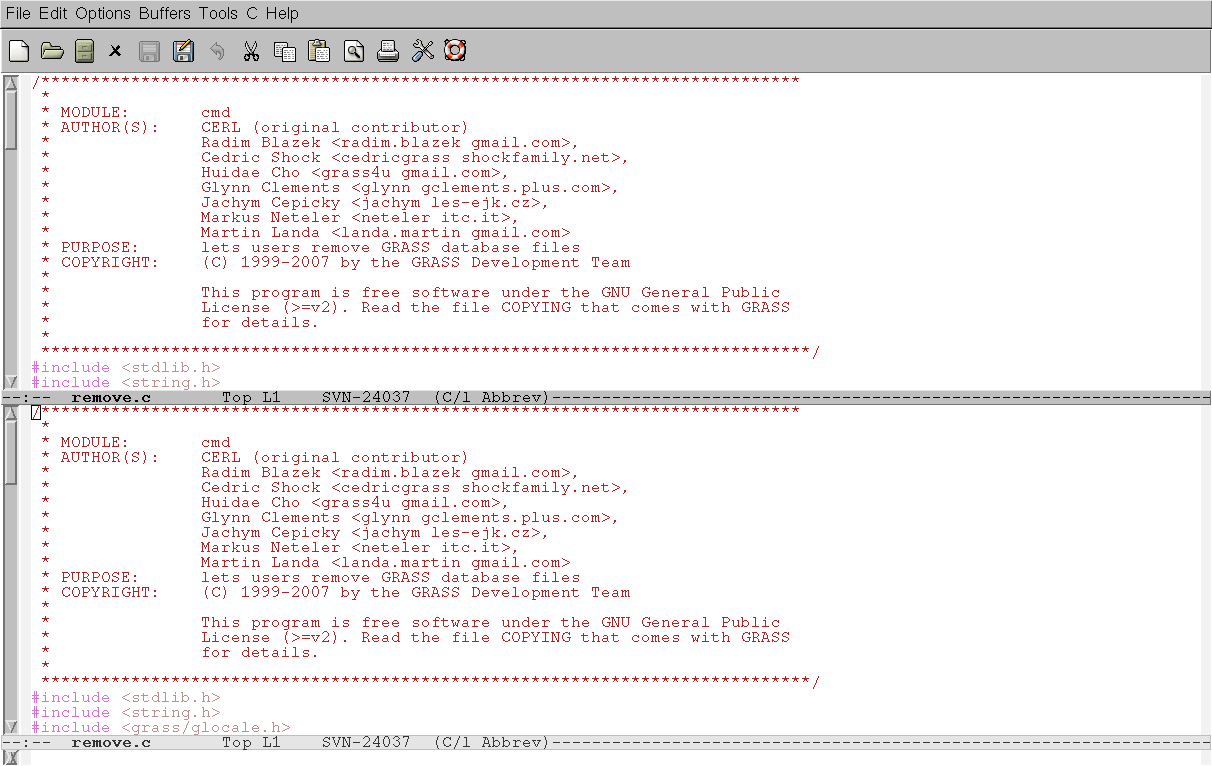
- move cursor to the second buffer by C-x o, then M-x gdb, Enter
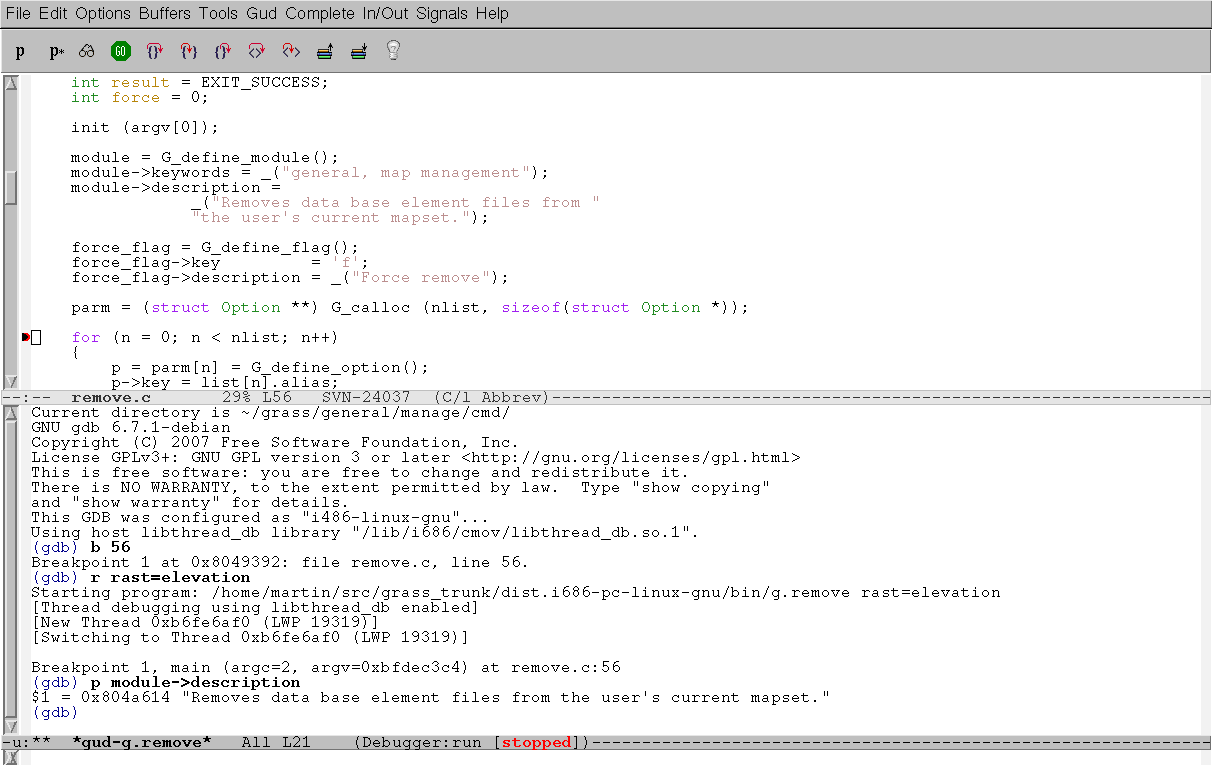
- type module name which you would like to debug, e.g. g.remove, Enter
- now you can use gdb inside GNU Emacs
Using DDD (gdb graphical frontend)
- debugging a program inside DDD is rather easy (installation of ddd and gdb required), (on Debian GNU/Linux: apt-get install gdb ddd; on Fedora: dnf install ddd). Start debugger with GRASS command (e.g., v.in.ogr):
ddd v.in.ogr
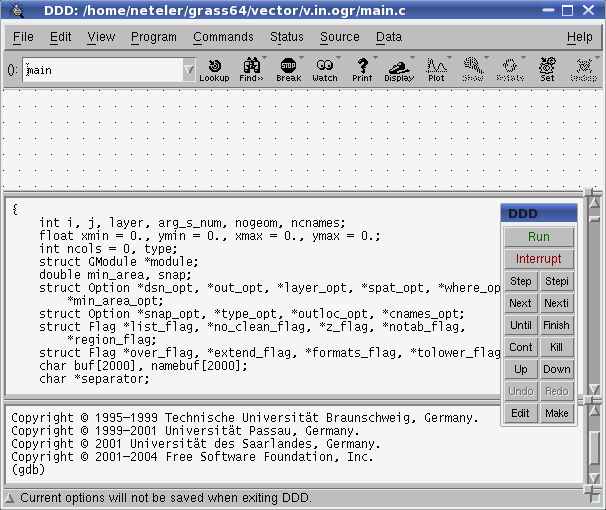
- Run (from main menu PROGRAM): "out=test dsn="PG:dbname=postgis user=me" olayer=postgislayer"
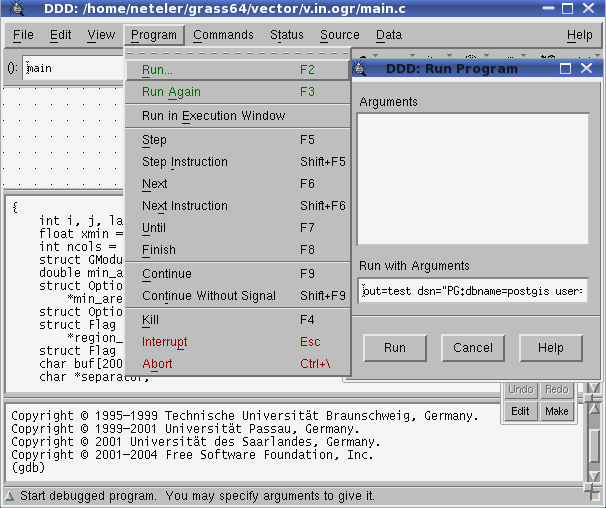
- run with parameters
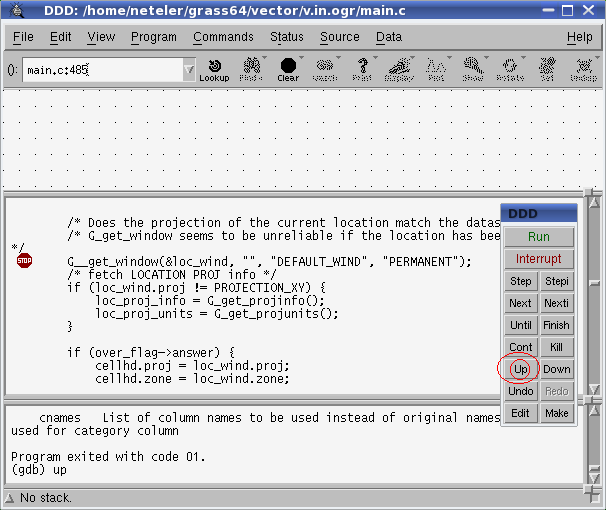
- when it crashes, use the UP menu item to trace back
- reach the line where it crashed
- set a breakpoint, then run again to stop before the crash
- right mouse button on variables permits to display them etc.
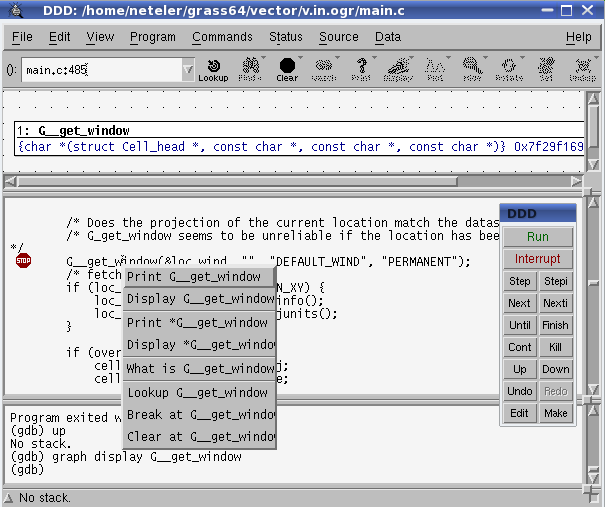
- figure out why it crashed there. This requires PATIENCE. But you will nearly save the world if you identify the problem :-)
Using kdbg (gdb graphical frontend)
- kdbg is not unlike DDD, but it's a KDE application.
- Use is similar to DDD.
- Start with (within GRASS):
kdbg `which g.module`
- Fill in command line arguments with menu item Execution->Arguments.
- Open the View->Locals window.
- Click the Run icon (or Execution->Run) and see where it breaks.
- Set pause-points by clicking a red stop-sign to the left of the "+" on a line of the source code. From there you can step through instructions.
- Explore the values of variables in the locals window.
- You can select an individual variable to watch with
View->Watched expressions
- Type "data" in the text box at the top to view the entire structure of some variable called "data". If it is a structure you can then expand it and click on an interior variable. Clicking on its name makes it come up in the text box. Hit enter from the text box and it will be added to the list of watched expressions. You can edit a Y to X (then enter again) to quickly add another similarly named variable. e.g.:
(data->header).Ycoordinate
Using ldd
On Linux ldd will show the shared library dependencies for a program or library. For example:
For a module:
GRASS> ldd `which v.in.ogr`
For a library:
$ ldd /usr/src/grass/grass78/dist.x86_64-pc-linux-gnu/lib/libgrass_gis.so
The output may look like this: linux-vdso.so.1 (0x00007ffe1cf03000) libgrass_datetime.7.8.so => /usr/src/grass/grass78/dist.x86_64-pc-linux-gnulib/libgrass_datetime.7.8.so (0x00007fae7a6cf000) libz.so.1 => /lib64/libz.so.1 (0x00007fae7a6b5000) libzstd.so.1 => /lib64/libzstd.so.1 (0x00007fae7a5df000) libm.so.6 => /lib64/libm.so.6 (0x00007fae7a499000) libc.so.6 => /lib64/libc.so.6 (0x00007fae7a2cf000) libpthread.so.0 => /lib64/libpthread.so.0 (0x00007fae7a2ad000) /lib64/ld-linux-x86-64.so.2 (0x00007fae7a769000)
ldd is good for spotting if the right libraries are used (in the correct path etc).
- On Mac OS "otool -L `which v.in.ogr`" almost does the same job.
- For MS Windows the Dependency Walker program (depends.exe) might help.
Library search path
If a support library like libgdal can't be found, and you are sure it is installed, make sure the library search path is set correctly. For example in Linux if GDAL was installed to /usr/local, add the line "/usr/local/lib" to the /etc/ld.so.conf file, and as root run ldconfig to rebuild the library links and cache.
Alternatively you can add the library path to the $LD_LIBRARY_PATH environmental variable.
Using nm and objdump
nm will show a list symbols contained in a library or a program. Use this if you want to check which functions it calls. It will not work if the binary has been stripped.
For example:
GRASS> nm $GISBASE/lib/libgrass_gis.so
GRASS> nm `which r.digit`
If the binaries have been stripped you can still use the -D option to show dynamic symbols instead of normal symbols:
$ nm -D /bin/ls
- see also the tools/sql.sh script in the GRASS souce code, which will run "nm" on every object file, library and executable to find dependencies. The result is stored in a PostgreSQL database.
objdump will work even if the binaries have been stripped. For example:
$ objdump -T /usr/lib/libX11.so
$ objdump -R /usr/lib/libX11.so
Using LD_DEBUG
To see in which order the various libraries are called, run the command with LD_DEBUG=files. For example:
LD_DEBUG=files r.info elevation
Using strace
Running the command through strace could give you another hint what is going wrong somewhere. It shows the command execution at low level.
For example:
strace v.in.ogr out=your_map dsn="PG:dbname=postgis user=me" olayer=postgislayer
Using Valgrind
- Valgrind is a tool to check for memory leaks and memory errors.
- Examples
- analysis of heap usage
CMD="v.in.ascii -zt z=3 in=lidaratm2_250k.txt out=lidaratm2_250k fs=,"
valgrind --tool=massif $CMD --o
- analysis of memory leaks (include
--trace-children=yesto profile e.g. the DBF driver or other children)- Full memcheck tool, including non-orphaned, but left over, allocated memory:
valgrind --tool=memcheck --leak-check=yes --show-reachable=yes $CMD --o
- Notes
- The default is to send Valgrind output to stderr. Add
--log-file=<filename>to save output to a file, but note (if it matters) that you will lose any interleaved GRASS debug messages from the log that way.
- Valgrind can create PostScript output charts. To convert PostScript to PNG:
- ('pstoimg' is part of the latex2html Debian package)
- If you get something like this (huge value for "still reachable"):
> ==13217== LEAK SUMMARY:
> ==13217==    definitely lost: 964 bytes in 39 blocks
> ==13217==    indirectly lost: 72 bytes in 10 blocks
> ==13217==      possibly lost: 79 bytes in 4 blocks
> ==13217==    still reachable: 9,025,026,330 bytes in 188,201,312 blocks
then please run valgrind again with --show-reachable=yes as you will want to find out where these 9,025,026,330 bytes (in this example) have been allocated.
pstoimg -aaliastext -flip r90 -out massif.550.png -scale 1.3 -crop a massif.550.ps
- Graphical user interfaces:
Using Electric Fence
- Electric Fence checks for bad memory writes, ie specific malloc() over-runs and under-runs.
(Insert howto here)
Example:
CMD="gdalwarp -tps -srcnodata 255 -dstnodata 255 \
       -of GTiff -rcs ${TMP}.tif ${OUTFILE}_warp"
LD_PRELOAD=libefence.so.0.0 $CMD
Using a profiling tool
A profiling tool may be used to identify the bottlenecks in long running processes.
Kcachegrind
kcachegrind is a visualization tool for Valgrind's callgrind profiling tool (formerly known as the calltree skin). It is very simple to use. Install the GraphViz package as well.
- The callgrind chapter in the Valgrind user manual
Example:
# Spearfish dataset
g.region raster=elevation.dem
v.random n=10000 out=rand10k
v.db.addtable rand10k column="elev INT"
CMD="v.what.rast rand10k rast=elevation.dem column=elev"
valgrind --tool=callgrind --trace-children=yes $CMD
This creates a file containing profiling information which kcachegrind can load. We include --trace-children in the above example so we can profile the DBF driver process as well as the main v.what.rast process.
kcachegrind callgrind.out.12345
In the above example from the two process costs we can see that 99.5% is taken by the dbf process and 0.5% is taken by the v.what.rast process. Within the dbf process almost 50% is taken by G_debug() and G_strcasecmp().
Duration: time
time with disk IO und socket message traffic (note: time with full path):
/usr/bin/time -f "\nreal %E\nuser %U\nsys %S\nCPU %P\nRAM (KB) %M\nwaits %w\nswaps %W\ninputs %I\noutputs %O\nsocket rec %r\nsocket sent %s\nsignals %k\n" grass_command ...
Profiling: gprof
Profiling a program: Where does it spend its time?
- GNU gprof user guide
- Profiling programs using gprof - article from the Linux Gazzette, March 2004 (#100)
- https://www.nas.nasa.gov/hecc/support/kb/using-gprof-for-performance-analysis_671.html
Compile GRASS with -pg flag. E.g.
CFLAGS='-pg' CXXFLAGS='-pg' LDFLAGS='-pg' ./configure --disable-shared
- Example
Run the module
v.select -tg ain=geodetic_swwake_pts bin=urbanarea out=x ope=overlap --o
It will generate the profiling data and store in the file gmon.out.
Use gprof to generate human readable output from the file gmon.out:
gprof $(which v.what) gmon.out
To store the output in a reporting file, run
gprof $(which v.what) gmon.out > profile.txt
Using Mudflap
GCC built in feature, that "instruments all risky pointer/array dereferencing operations, some standard library string/heap functions, and some other associated constructs with range/validity tests. Modules so instrumented should be immune to buffer overflows, invalid heap use, and some other classes of C/C++ programming errors. The instrumentation relies on a separate runtime library (libmudflap), which will be linked into a program if -fmudflap -lmudflap is given at link time." GCC Wiki
- Requires GCC with mudflap support (GCC 4.x with mudflap USE flag on Gentoo, separate library "libmudflap*" in other distros);
- Add -fmudflap and -lmudflap options (Is this correct way? It works...):
- in include/Make/Platform.make add -lmudflap to LD_SEARCH_FLAGS;
- in include/Make/Platform.make add -fmudflap to CFLAGS1;
- Disable mudflap during compilation
export MUDFLAP_OPTIONS='-mode-nop -viol-nop'
- Compile GRASS (make clean && make). For best results use NO optimisations for compilation (-O0);
- Use GRASS.
- To disable warnings
export MUDFLAP_OPTIONS='-mode-nop -viol-nop'
- To enable warnings
export MUDFLAP_OPTIONS='-mode-check -viol-nop -check-initialization'
More information about debugging with mudflap, can be found here.
Skimming the ChangeLog for changes
- use the tool tools/gitlog2changelog.py for generating a local changelog-file, by simply running:
- make changelog
Shell script debugging
Add "-x" to the first line of the shell script:
original:
#!/bin/sh
change to:
#!/bin/sh -x
alternatively add `set -x` to somewhere near the start of the script.
Find the script file to edit with
which script
Python script debugging
Python debugging with pdb
See also:
- pdb Background: https://docs.python.org/3/library/pdb.html
- pdb Tutorial: https://fedoramagazine.org/getting-started-python-debugger/
1. Edit the GRASS python script and add this line to the import section:
import pdb
2. Edit and add this line within the code where to debug:
pdb.set_trace()
3. Run the python script normally, it will stop where pdb.set_trace() was added: r.unpack x60030_2000.green.histo2000_g.pack
GRASS 7.8 (patUTM32):~ > r.unpack x60030_2000.green.histo2000_g.pack
> /home/neteler/software/grass78/dist.x86_64-unknown-linux-gnu/scripts/r.unpack(93)main()
-> diff_result_1 = diff_result_2 = None
3. Now you can either (s)tep through or (n)ext or (r)run the rest (c: continue, q: quit)
(Pdb) s
While "s" will descend in functions, "n" will go to the next line.
To show the source code, use "ll".
See the manual for Debugger Commands
4. To print the content of variables:
(Pdb) s
> /usr/lib64/python3.8/posixpath.py(73)join()
-> path = a
(Pdb) a
a = /grassdata/patUTM32/hist_matching
p = ('..', 'PERMANENT', 'PROJ_INFO')
(Pdb)
Now will likely be able to better find the issues in your Python script.
See also: https://docs.python.org/3/library/pdb.html
wxPython GUI debugging
A) Debug messages:
wxGUI prints debugging messages in five levels (1-5). To redirect these messages to the terminal, run
g.gisenv set=WX_DEBUG=1
B) Using a debugger:
For real debugging of wxgui.py (source code) with gdb or other tools, so you can use something like:
cd grass/src
python gui/wxpython/wxgui.py
or:
python $GISBASE/gui/wxpython/wxgui.py
or with gdb e.g.:
# GRASS GIS session terminal
d.mon start=wx0

# Examine running wxGUI components by htop program and get pid
# Run in another terminal or in terminal tab
gdb --pid $(pgrep -f /gui/wxpython/mapdisp/main.py)
continue

# And then interact with the wxGUI component (d.mon)
# If wxGUI component crash then you get backtrace with gdb bt command
bt
Well, but that's just how to run the Python code directly.
Python debugging with gdb
See https://wiki.python.org/moin/DebuggingWithGdb
Komodo dbgp.client.brk()
from dbgp.client import brk
Python function tracing
Functions can be traced using the 'trace' module. It generates a trace of program execution, and annotated statement coverage and more.
python -m trace --ignore-dir=../lib --trace mymain.py
See also (for example): https://www.tutorialspoint.com/trace-or-track-python-statement-execution-trace
Profiling python scripts
Memory debugging of python scripts
- memray: Memray is a memory profiler for Python
PROJ debugging
See also: https://proj.org/usage/environmentvars.html?highlight=debugging
For unix with a style shell use export:
export PROJ_DEBUG=5
cs2cs ...