GRASS GSoC 2024 Improve user experience in Jupyter Notebooks: Difference between revisions
29riyasaxena (talk | contribs) |
29riyasaxena (talk | contribs) (→Links) |
||
| (26 intermediate revisions by the same user not shown) | |||
| Line 33: | Line 33: | ||
| Bonding Period | | Bonding Period | ||
|| | || | ||
May 1- May 26 | May 1 - May 26 | ||
|| | || | ||
# Initial research | # Initial research | ||
# Proposal | # Proposal discussion with mentor | ||
# Work on this [https://github.com/OSGeo/grass/pull/3468/ PR] | # Work on this [https://github.com/OSGeo/grass/pull/3468/ PR] | ||
|| | || OK | ||
|- | |- | ||
| rowspan="13" | Official Coding Period | | rowspan="13" | Official Coding Period | ||
|- | |- | ||
| '''Week 1''' (May 27 - June 1) || Write initial function for adding button to ''grass.jupyter.InteractiveMap()'' || | | '''Week 1''' (May 27 - June 1) || Write initial function for adding button to ''grass.jupyter.InteractiveMap()'' || OK | ||
|- | |- | ||
| '''Week 2''' (June 2 - June 8) || Add click to see attributes features to the button || | | '''Week 2''' (June 2 - June 8) || Add click to see attributes features to the button || OK | ||
|- | |- | ||
| '''Week 3''' (June 9 - June 15) || Add button to allow users to create drawings in the displayed ''InteractiveMap()'' || | | '''Week 3''' (June 9 - June 15) || Add button to allow users to create drawings in the displayed ''InteractiveMap()'' || OK | ||
|- | |- | ||
| '''Week 4''' (June 16 - June 22) || Add tools to the button to create different drawings || | | '''Week 4''' (June 16 - June 22) || Add tools to the button to create different drawings || OK | ||
|- | |- | ||
| '''Week 5''' (June 23 - June 29) || Add functionality to retrieve points from user drawn drawings and add them to the data, if the user wants || | | '''Week 5''' (June 23 - June 29) || Add functionality to retrieve points from user drawn drawings and add them to the data, if the user wants || OK | ||
|- | |- | ||
| '''Week 6''' (June 30 - July 6) || Speeding up the rendering of ''InteractiveMap()'' by skipping reprojection || | | '''Week 6''' (June 30 - July 6) || Speeding up the rendering of ''InteractiveMap()'' by skipping reprojection || In Progress | ||
|- | |- | ||
|style="background: #ffdead;"| '''Week 7''' (July 7 - July 13) | | style="background: #ffdead;"| '''Week 7''' (July 7 - July 13) | ||
|| | || | ||
# Code refactoring, testing, documentation | # Code refactoring, testing, documentation | ||
# '''Mid-term Evaluation: July 12''' | # '''Mid-term Evaluation: July 12''' | ||
|| | || OK | ||
|- | |- | ||
| '''Week 8''' (July 14 - July 20) || Adding parallelization to ''TimeseriesMap'' and ''SeriesMap'' || | | '''Week 8''' (July 14 - July 20) || Adding parallelization to ''TimeseriesMap'' and ''SeriesMap'' || OK | ||
|- | |- | ||
| '''Week 9''' (July 21 - July 27) || Documentation, testing, writing tutorial || | | '''Week 9''' (July 21 - July 27) || Documentation, testing, writing tutorial || OK | ||
|- | |- | ||
| '''Week 10''' (July 28 - August 3) || Working on a selected stretch goal || | | '''Week 10''' (July 28 - August 3) || <s>Working on a selected stretch goal</s> Worked on Handling Toggle Buttons || OK | ||
|- | |- | ||
| '''Week 11''' (August 4 - August 10) || Working on a selected stretch goal | | '''Week 11''' (August 4 - August 10) || <s>Working on a selected stretch goal</s> Worked on Handling Toggle Buttons || OK | ||
|| | |||
|- | |- | ||
| '''Week 12''' (August 11 - August 17) || Write project summary || | | '''Week 12''' (August 11 - August 17) || Write project summary || OK | ||
|- | |- | ||
| rowspan="2" | Evaluation Period | | rowspan="2" | Evaluation Period | ||
|- | |- | ||
| August 26 - September 2 || Submit code and final evaluation || | | August 26 - September 2 || Submit code and final evaluation || OK | ||
|} | |} | ||
= Reports = | = Reports = | ||
| Line 162: | Line 160: | ||
== Week-12 == | == Week-12 == | ||
# '''Wrote Report''' | |||
# '''Started working on custom projections in <code>InteractiveMap</code>[https://github.com/OSGeo/grass/pull/4204 (PR)]''' | |||
= Final Report = | = Final Report = | ||
'''Title''': Improve GRASS user experience in Jupyter Notebook | '''Title''': Improve GRASS user experience in Jupyter Notebook | ||
''' | '''Organization''': GRASS GIS - OSGeo | ||
| Line 185: | Line 185: | ||
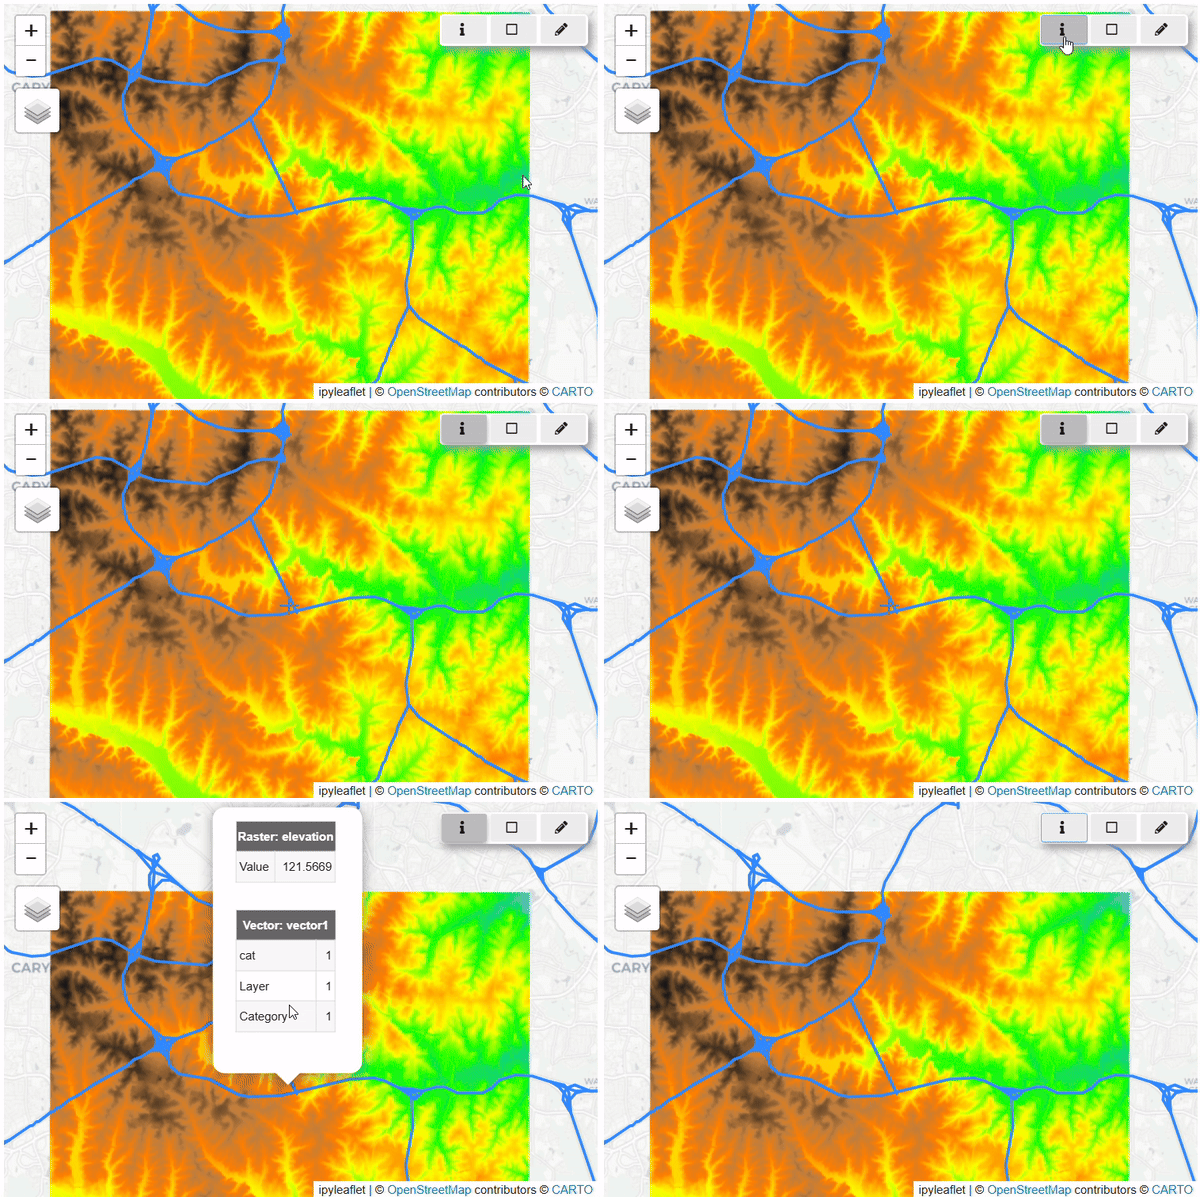
### ''Activate the Query Tool'': Click the '''info''' button (ℹ️) to enable the query mode. | ### ''Activate the Query Tool'': Click the '''info''' button (ℹ️) to enable the query mode. | ||
### ''Select a Point on the Map'': Click on the map to retrieve raster/vector information for that specific point. | ### ''Select a Point on the Map'': Click on the map to retrieve raster/vector information for that specific point. | ||
### ''Deactivate the Tool'': Toggle the button off when you're done. | ### ''Deactivate the Tool'': Toggle the button off when you're done. | ||
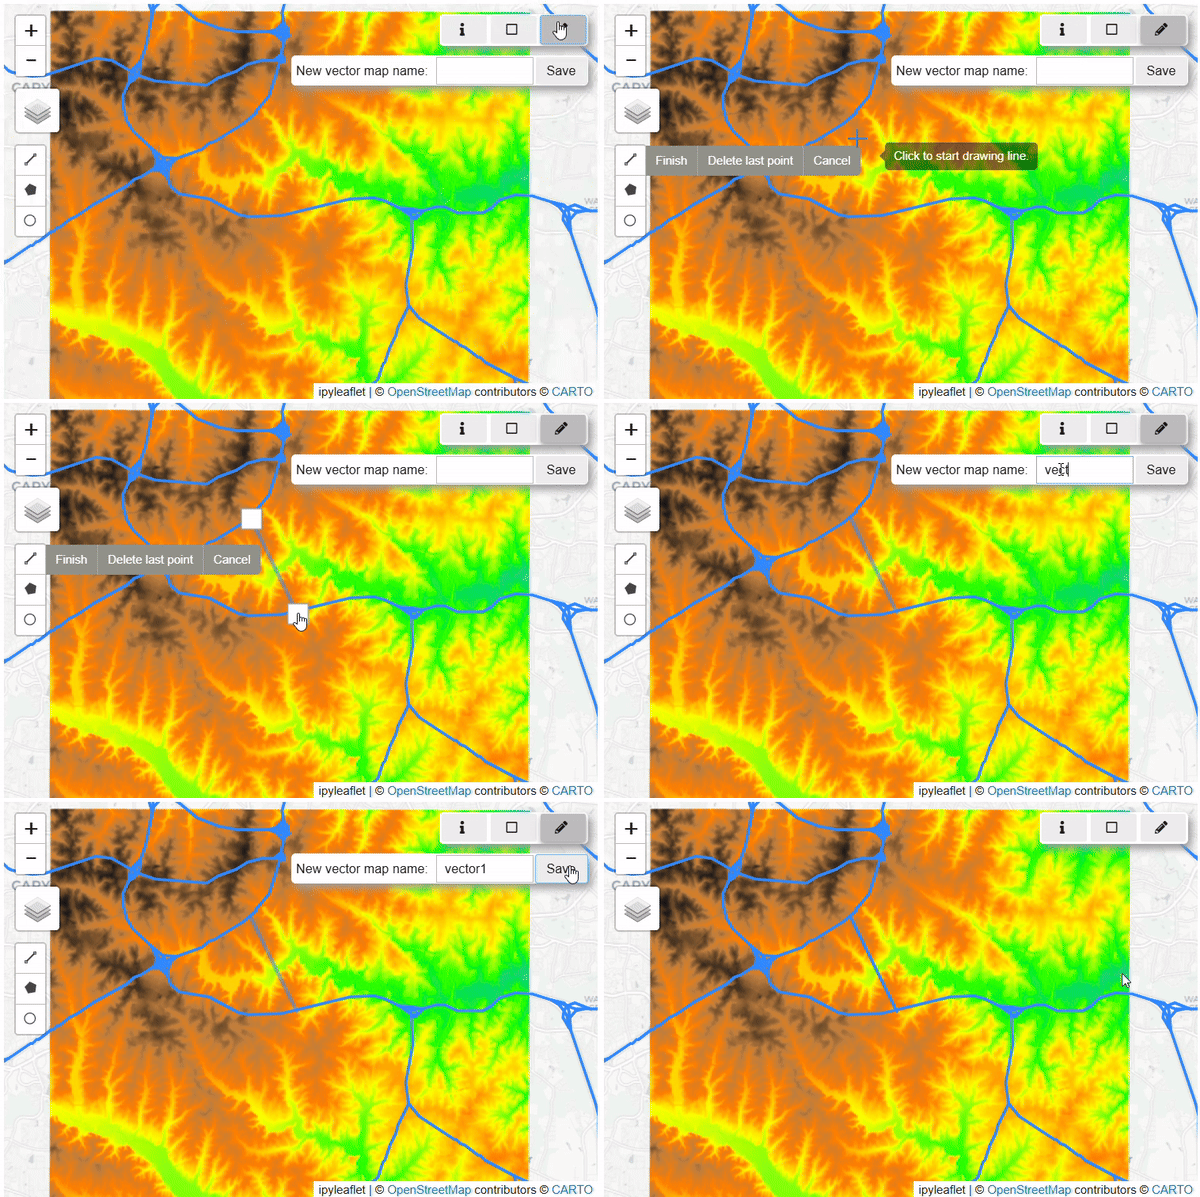
## '''Drawing and Saving Geometries as GRASS Native Vector Maps''' (🖉) | ## '''Drawing and Saving Geometries as GRASS Native Vector Maps''' (🖉) | ||
### ''Activate the Drawing Tool'': Click the '''Pencil''' button (🖉) to start drawing on the map. | ### ''Activate the Drawing Tool'': Click the '''Pencil''' button (🖉) to start drawing on the map. | ||
| Line 191: | Line 191: | ||
### ''Name the Vector Map'': Enter the name for the new vector map in the '''New vector map name''' text box. | ### ''Name the Vector Map'': Enter the name for the new vector map in the '''New vector map name''' text box. | ||
### ''Save the Geometry'': Click the '''Save''' button to add the geometry to the map. | ### ''Save the Geometry'': Click the '''Save''' button to add the geometry to the map. | ||
### ''Finalize and Close'': The geometry is now added as a new layer on the map, and the drawing interface will automatically close. | ### ''Finalize and Close'': The geometry is now added as a new layer on the map, and the drawing interface will automatically close. | ||
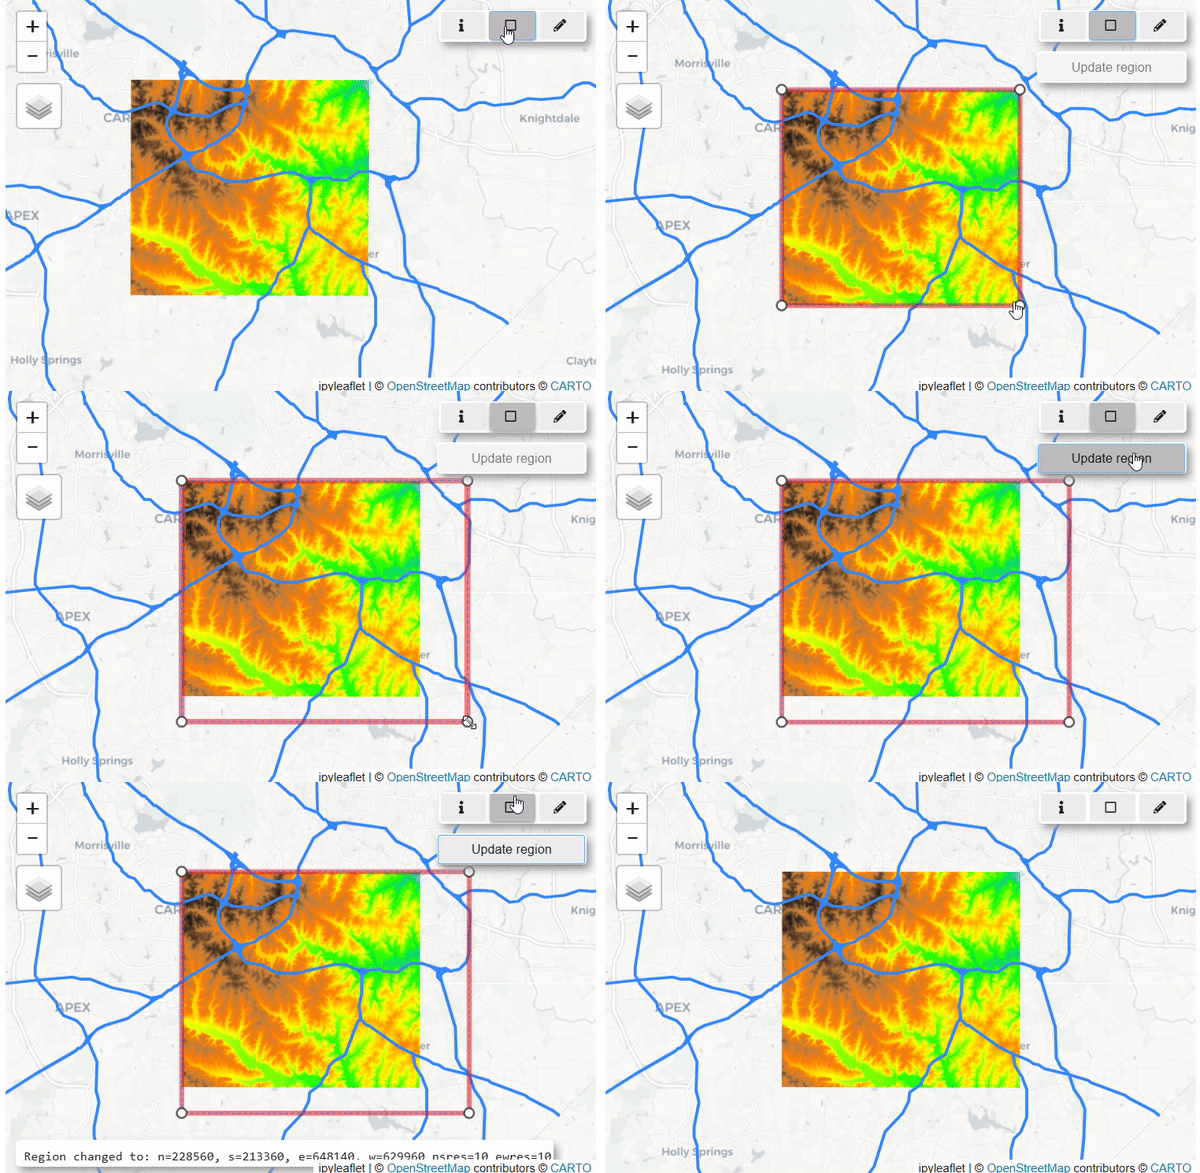
## '''Viewing and Updating the Computational Region''' (◻️) | ## '''Viewing and Updating the Computational Region''' (◻️) | ||
### ''Activate the Computational Region Tool'': Click the '''View/Update Computational Region''' button (◻️). | ### ''Activate the Computational Region Tool'': Click the '''View/Update Computational Region''' button (◻️). | ||
| Line 198: | Line 198: | ||
### ''Update the Region'': Click '''Update Region''' to apply your changes to the computational region. | ### ''Update the Region'': Click '''Update Region''' to apply your changes to the computational region. | ||
### ''Deactivate the Tool'': Toggle the button off when you're done. | ### ''Deactivate the Tool'': Toggle the button off when you're done. | ||
# '''Parallelization in <code>SeriesMap</code> and <code>TimeSeriesMap | # '''Removal of redundancy in the <code>TimeSeriesMap</code> and <code>SeriesMap</code>''': A new class, <code>BaseSeriesMap</code>, has been added to serve as a parent class to both <code>TimeSeriesMap</code> and <code>SeriesMap</code>. This enhancement reduces redundancy and streamlines the codebase. | ||
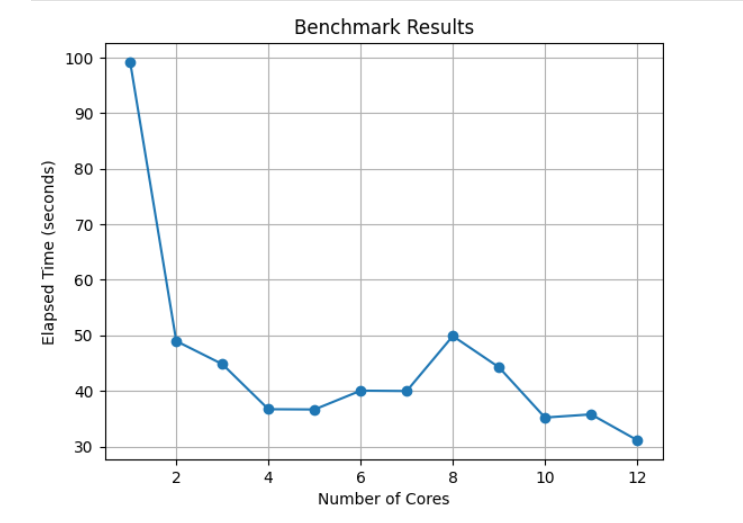
'''Benchmark for <code>TimeSeriesMap</code>''' | # '''Parallelization in <code>SeriesMap</code> and <code>TimeSeriesMap</code>''' | ||
#:*'''Benchmark for <code>TimeSeriesMap</code> and <code>SeriesMap</code>:''' The following tables present the performance results obtained using 1-12 cores, as tested on the examples in <code>[https://github.com/OSGeo/grass/blob/main/doc/notebooks/temporal.ipynb temporal.ipynb]</code> and <code>[https://github.com/OSGeo/grass/blob/main/doc/notebooks/jupyter_tutorial.ipynb jupyter_tutorial.ipynb]</code>. Below is an example of how to reproduce this benchmark: | |||
<syntaxhighlight lang="python"> | |||
cores_range = range(1, 13) | |||
benchmark_results = {} | |||
for cores in cores_range: | |||
gs.run_command("g.gisenv", set=f"NPROCS={cores}") | |||
start_time = time.time() | |||
series = gj.SeriesMap(height=500) | |||
series.add_rasters(["elevation", "elevation_shade", "slope"]) | |||
series.add_vectors(["streams", "streets", "viewpoints"]) | |||
series.d_vect(map="streets") | |||
series.d_barscale() | |||
series.show() # Create Slider | |||
end_time = time.time() | |||
elapsed_time = end_time - start_time | |||
benchmark_results[cores] = elapsed_time | |||
print(f"Cores: {cores}, Time: {elapsed_time:.2f} seconds") | |||
</syntaxhighlight> | |||
<center> | |||
<table class="wikitable"> | |||
<caption>Performance Results - TimeSeriesMap</caption> | |||
<tr> | |||
<th>Cores</th> | |||
<th>1</th> | |||
<th>2</th> | |||
<th>3</th> | |||
<th>4</th> | |||
<th>5</th> | |||
<th>6</th> | |||
<th>7</th> | |||
<th>8</th> | |||
<th>9</th> | |||
<th>10</th> | |||
<th>11</th> | |||
<th>12</th> | |||
</tr> | |||
<tr> | |||
<td>Time (sec)</td> | |||
<td>53.42</td> | |||
<td>26.24</td> | |||
<td>18.99</td> | |||
<td>18.50</td> | |||
<td>15.08</td> | |||
<td>14.04</td> | |||
<td>17.68</td> | |||
<td>15.75</td> | |||
<td>16.00</td> | |||
<td>14.12</td> | |||
<td>14.22</td> | |||
<td>14.76</td> | |||
</tr> | |||
</table> | |||
<table class="wikitable"> | |||
<caption>Performance Results - SeriesMap</caption> | |||
<tr> | |||
<th>Cores</th> | |||
<th>1</th> | |||
<th>2</th> | |||
<th>3</th> | |||
<th>4</th> | |||
<th>5</th> | |||
<th>6</th> | |||
<th>7</th> | |||
<th>8</th> | |||
<th>9</th> | |||
<th>10</th> | |||
<th>11</th> | |||
<th>12</th> | |||
</tr> | |||
<tr> | |||
<td>Time (sec)</td> | |||
<td>4.88</td> | |||
<td>2.47</td> | |||
<td>1.58</td> | |||
<td>1.67</td> | |||
<td>1.74</td> | |||
<td>1.73</td> | |||
<td>1.68</td> | |||
<td>1.64</td> | |||
<td>1.65</td> | |||
<td>1.64</td> | |||
<td>1.62</td> | |||
<td>1.61</td> | |||
</tr> | |||
</table> | |||
</center> | |||
=== Conclusion === | |||
This project has successfully improved the user experience of <code>GRASS GIS</code> in <code>Jupyter Notebook</code>. Significant enhancements have been made to the <code>InteractiveMap</code>, <code>SeriesMap</code>, and <code>TimeSeriesMap</code>. The new features, such as the ''Query Button'', ''View/Update Computational Region Button'', and ''Draw Geometries Button'', have streamlined data querying, visualization, and editing processes. Introducing the <code>BaseSeriesMap</code> has reduced redundancy, and parallelization has substantially improved performance. Benchmark results show notable speed improvements, making <code>GRASS GIS</code> more efficient and user-friendly. These advancements contribute to a more seamless and productive experience for users. | |||
I appreciate the support and opportunity to contribute to GRASS GIS this summer. Thanks to my mentors and the GRASS Development Team for their guidance. Anna Petrasova's contributions were pivotal to the project's success, and I'm grateful for her support. Looking forward to contributing more. | |||
=== Future Work === | |||
# [https://github.com/OSGeo/grass/pull/3793#discussion_r1644111142 Improve the distance used in Query Button functionality]. | |||
# Use [https://ipyleaflet.readthedocs.io/en/latest/controls/geoman_draw_control.html <code>GeomanDrawControl</code>] in the Draw Button functionality. | |||
# Enhanced connectivity with Pandas will enable users to display data with a single command. | |||
# Large, high-resolution image display will be enabled by implementing tiling techniques, reducing memory consumption and enabling smooth rendering of large images. | |||
# Implementing a graphical user interface (GUI) for tool presentation within Jupyter Notebooks would simplify usability and enhance user experience, facilitating smoother workflows within the platform. | |||
=== Links === | |||
Pull requests related to <code>grass.jupyter</code>: | |||
{| class="wikitable" | {| class="wikitable" | ||
! Ttile | |||
! | ! Pull Request | ||
! Status | |||
|- | |- | ||
| | | Create BaseSeriesMap to remove redundancies in SeriesMap and TimeSeriesMap | ||
| [https://github.com/OSGeo/grass/pull/3468 3468] | |||
| <span style="color:#8256d0">Merged</span> | |||
|- | |- | ||
| | | Add Query Button to InteractiveMap | ||
| [https://github.com/OSGeo/grass/pull/3793 3793] | |||
| <span style="color:#8256d0">Merged</span> | |||
|- | |- | ||
| | | Allow Users to view/update computational region | ||
| [https://github.com/OSGeo/grass/pull/3838 3838] | |||
| <span style="color:#8256d0">Merged</span> | |||
|- | |- | ||
| | | Allow users to draw simple geometries and save it as vector | ||
| [https://github.com/OSGeo/grass/pull/4003 4003] | |||
| <span style="color:#8256d0">Merged</span> | |||
|- | |- | ||
| | | Add Parallelization to TimeSeriesMap and SeriesMap | ||
| [https://github.com/OSGeo/grass/pull/4097 4097] | |||
| <span style="color:#8256d0">Merged</span> | |||
|- | |- | ||
|- | |- | ||
| | | Use <code>InteractiveMap</code> with custom projections | ||
| [https://github.com/OSGeo/grass/pull/4204 4204] | |||
| <span style="color:#008000">Open</span> | |||
|- | |- | ||
| | | Add documentation of InteractiveMap Features and Parallelization in jupyter_tutorial.ipynb | ||
| [https://github.com/OSGeo/grass/pull/4164 4164] | |||
| <span style="color:#8256d0">Merged</span> | |||
|- | |- | ||
| | | Modify Descriptions | ||
| [https://github.com/OSGeo/grass/pull/4159 4159] | |||
| <span style="color:#8256d0">Merged</span> | |||
|} | |} | ||
Some additional links: | |||
{| class="wikitable" | {| class="wikitable" | ||
! Ttile | |||
! | ! Link | ||
|- | |- | ||
| | | OSGeo Wiki Page | ||
| [https://grasswiki.osgeo.org/wiki/GRASS_GSoC_2024_Improve_user_experience_in_Jupyter_Notebooks Improve User Experience in Jupyter Notebooks] | |||
|- | |- | ||
| | | Github Fork | ||
| [https://github.com/29riyasaxena/grass/tree/main GitHub Fork] | |||
|- | |- | ||
| | | Example | ||
| [https://github.com/29riyasaxena/grass/blob/main/doc/notebooks/jupyter_tutorial.ipynb <code>jupyter_tutorial</code>] | |||
|} | |||
== Images == | |||
{| style="width: 100%; text-align: center;" | |||
|- | |- | ||
| | | [[File:Grass draw and query.png|thumb|width=385px|height=300px|alt=Draw and Query Functioning|Draw and Query]] | ||
| [[File:Grass update region before.png|thumb|width=385px|height=300px|alt=Shows the original computational region|Original Computational Region]] | |||
| [[File:Grass_update_region_after.png|thumb|width=385px|height=300px|alt=Shows the modified computational region|Modified Computational Region]] | |||
|} | |||
{| style="width: 100%; text-align: center;" | |||
|- | |- | ||
| | | [[File:Grass geometries.png|thumb|alt=Picture showing the various draw controls of the Draw Button|Shows the various draw controls of the Draw Button]] | ||
| [[File:Grass seriesmap.png|thumb|alt=Displays benchmark on SeriesMap|Benchmark on SeriesMap]] | |||
| [[File:Grass timeseriesmap.png|thumb|alt=Displays benchmark on TimeSeriesMap|Benchmark on TimeSeriesMap]] | |||
|} | |||
== Media == | |||
{| style="width: 100%; text-align: center;" | |||
|- | |- | ||
| | | [[File:Grass update region gif.gif|thumb|alt=GIF showing the function of update region button|GIF showing the function of update region button]] | ||
| [[File:Grass gif draw.gif|thumb|alt=GIF showing the working of the Draw Button|Working of the Draw Button]] | |||
| [[File:Grass gif query.gif|thumb|alt=GIF showing the working of the Query Button|Working of the Query Button]] | |||
| | |||
| | |||
| | |||
| | |||
| | |||
| | |||
| | |||
|} | |} | ||
{| style="width:100%;" | |||
| style="width:30%; vertical-align:top;" | [[File:Grass draw geometries.mp4|thumb|alt=Working of Draw Geometries Button|Working of Draw Geometries Button]] | |||
| style="width:30%; text-align:center; vertical-align:top;" | [[File:Grass query.mp4|thumb|alt=Working of Query Button|Working of Query Button]] | |||
| style="width:30%; vertical-align:top;" | [[File:Grass view update region.mp4|thumb|alt=View/Update Region Button Working|Working of View/Update Region Button]] | |||
|} | |||
{{GSoC}} | {{GSoC}} | ||
Latest revision as of 06:58, 25 August 2024
| Student Name | Riya |
| Organization | OSGeo - Open Source Geospatial Foundation |
| Mentor Name | Anna Petrasova, Corey White |
| GitHub Fork | View Repo |
| GSoC proposal | View Proposal |
Abstract
The grass.jupyter.InteractiveMap() tool offers basic map visualization features like zooming and layer addition but suffers from suboptimal rendering speed (approximately 7.55 seconds per loop) and cumbersome data integration, particularly with large datasets. Additionally, its reliance on the Pseudo-Mercator projection limits its versatility. This abstract highlights the need for enhancements to improve rendering efficiency, streamline data integration, and broaden projection support for increased usability and functionality.
Goal
Main Goals:
- Enhance InteractiveMap with interactive data retrieval features, enabling users to query attribute values and draw geometries directly on the map.
- Implement support for custom coordinate reference systems (CRS) in InteractiveMap to eliminate the need for layer reprojection and improve visualization speed.
- Optimize rendering processes for SeriesMap and TimeseriesMap by parallelizing map rendering using standard Python libraries like multiprocessing.
Stretch Goals:
- Improve integration between GRASS and Pandas for smoother data handling and analysis.
- Incorporate tile-based rendering to efficiently display extensive datasets without compromising performance.
- Integrate a graphical user interface (GUI) within a Jupyter Notebook for enhanced user experience and ease of interaction with InteractiveMap functionalities.
Timeline
| Period | Timeline | Tasks | Status |
|---|---|---|---|
| Bonding Period |
May 1 - May 26 |
|
OK |
| Official Coding Period | |||
| Week 1 (May 27 - June 1) | Write initial function for adding button to grass.jupyter.InteractiveMap() | OK | |
| Week 2 (June 2 - June 8) | Add click to see attributes features to the button | OK | |
| Week 3 (June 9 - June 15) | Add button to allow users to create drawings in the displayed InteractiveMap() | OK | |
| Week 4 (June 16 - June 22) | Add tools to the button to create different drawings | OK | |
| Week 5 (June 23 - June 29) | Add functionality to retrieve points from user drawn drawings and add them to the data, if the user wants | OK | |
| Week 6 (June 30 - July 6) | Speeding up the rendering of InteractiveMap() by skipping reprojection | In Progress | |
| Week 7 (July 7 - July 13) |
|
OK | |
| Week 8 (July 14 - July 20) | Adding parallelization to TimeseriesMap and SeriesMap | OK | |
| Week 9 (July 21 - July 27) | Documentation, testing, writing tutorial | OK | |
| Week 10 (July 28 - August 3) | OK | ||
| Week 11 (August 4 - August 10) | OK | ||
| Week 12 (August 11 - August 17) | Write project summary | OK | |
| Evaluation Period | |||
| August 26 - September 2 | Submit code and final evaluation | OK |
Reports
Bonding Period
- Contribution Guidelines: Spent time familiarizing myself with the project's contribution guidelines to ensure that my work aligns with the required standards.
- Introduction: Introduced myself to the discourse mailing list.
- WikiPages Setup: Created and organized my personal WikiPage and the project WikiPage, providing necessary documentation.
- Development Environment Configuration: Successfully set up and configured the development environment to streamline my coding and testing processes.
- GRASS GIS Exploration: Learnt more about GRASS GIS.
- Remove Redundancy in the code: Continued working on the pull request to remove redundancies in the
SeriesMapandTimeSeriesMapmodules opened by me before the Contributor Proposals Opened.
Week-1
- Created the Class
BaseSeriesMap(PR)- The
BaseSeriesMapclass serves as a base class forSeriesMapandTimeSeriesMap. - It eliminates code redundancy and offers a unified interface for rendering images and creating interactive timeline sliders.
- The
- Query Button (PR)
- Enabled users to retrieve the Latitude and Longitude of raster data upon activation of Query Button.
Week-2
- Query Button (PR)
- Added functionality to handle both raster and vector data.
- The button now returns output to the user in the Coordinate Reference System (CRS).
Week-3
- Query Button (PR)
- Added a Popup button to display the queried point.
- Enabled support for multiple raster and vector layers.
- View/Update Computational Region Button (PR)
- Began initial work on this feature, for example, adding the button, getting the region, etc.
Week-4
- Query Button (PR)
- Explored methods to dynamically calculate the query threshold distance.
- Made slight modifications to the display of the Query button.
- View/Update Computational Region Button (PR)
- Attempted to use
ipyleaflet.Rectangleas an alternative toDrawControl, but this method was unsuccessful.
- Attempted to use
Week-5
- Query Button (PR)
- Added test case for query button.
- View/Update Computational Region Button (PR)
- Added a rectangle to display the current computational region when this button is activated.
- User can modify the current computational region by adjusting the rectangle.
Week-6
- Query Button (PR)
- Enhanced the appearance of the popup button that will display the output.
- View/Update Computational Region Button (PR)
- Worked on enhancing the display of the computational region.
Week-7
- Query Button (PR)
- Finalized the appearance of the popup button.
- View/Update Computational Region Button (PR)
- Added functionality for zooming into the computational region.
- Drawing and Saving of Simple Geometries (PR)
- Users can now draw simple geometries in
InteractiveMapand save them as GRASS native vector maps. - Transitioned from
DrawControl(deprecated) toGeomanDrawControlinipyleaflet.
- Users can now draw simple geometries in
Week-8
- Query Button (PR)
- Worked on pylint errors.
- Drawing and Saving of Simple Geometries (PR)
- Discovered limitations of
GeomanDrawControland reverted toDrawControl.
- Discovered limitations of
- Parallelization (PR)
- Began working on parallelization for
TimeseriesMapandSeriesMap.
- Began working on parallelization for
Week-9
- Drawing and Saving of Simple Geometries (PR)
- Updated the display of buttons.
- Parallelization (PR)
- Continued working on parallelization for
TimeseriesMapandSeriesMap.
- Continued working on parallelization for
Week-10
- Drawing and Saving of Simple Geometries (PR)
- Did some final edits in the code.
- Parallelization (PR)
- Added parallelization in the render function for
TimeseriesMapandSeriesMap, and completed this task.
- Added parallelization in the render function for
Week-11
- Managing Multiple Toggle Buttons
- Implemented
InteractiveDrawControllerandInteractiveQueryControllerto handle individual events.
- Implemented
- Modified Tutorials
- Updated Descriptions
Week-12
- Wrote Report
- Started working on custom projections in
InteractiveMap(PR)
Final Report
Title: Improve GRASS user experience in Jupyter Notebook
Organization: GRASS GIS - OSGeo
Abstract
This project introduces three significant enhancements to the InteractiveMap: a Query Button for querying specific points, a View/Update Computational Region Button for directly viewing and updating the computational region, and a Draw Geometries Button for creating and adding simple geometries as GRASS native vector maps. Additionally, the project introduces the BaseSeriesMap to reduce redundancy between SeriesMap and TimeSeriesMap, and adds parallelization to both SeriesMap and TimeSeriesMap for improved performance.
The state of integration BEFORE the start of GSoC
Previously, it was not possible to query vector/raster data, draw geometries, or view the computational region in InteractiveMap. While updating the region was possible, it required running additional commands. Additionally, improving the rendering speed of images in SeriesMap and TimeSeriesMap was not feasible.
The state of integration AFTER GSoC
- Features in
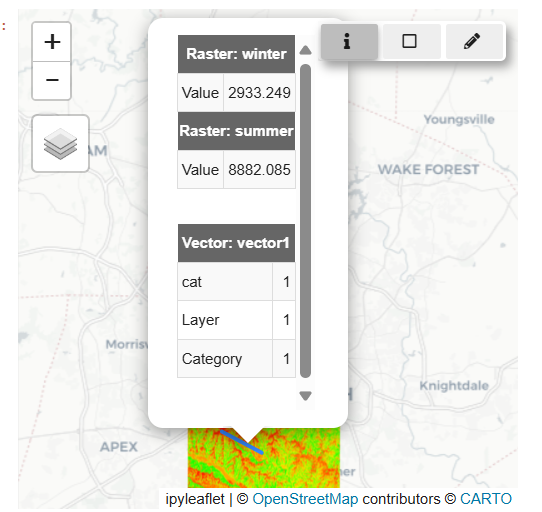
grass.InteractiveMap(): Thegrass.jupyter.interactivemap.pymodule includes three key features: the Query button (ℹ️), the View/Update Computational Region button (◻️), and the Draw Geometries button (🖉).- Querying Raster/Vector Information at a Specific Point (ℹ️)
- Activate the Query Tool: Click the info button (ℹ️) to enable the query mode.
- Select a Point on the Map: Click on the map to retrieve raster/vector information for that specific point.
- Deactivate the Tool: Toggle the button off when you're done.
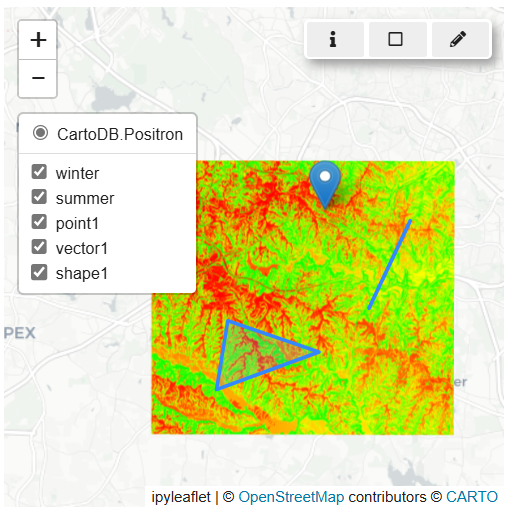
- Drawing and Saving Geometries as GRASS Native Vector Maps (🖉)
- Activate the Drawing Tool: Click the Pencil button (🖉) to start drawing on the map.
- Draw Your Geometry: You can draw a polyline, polygon, or circle marker directly on the map.
- Name the Vector Map: Enter the name for the new vector map in the New vector map name text box.
- Save the Geometry: Click the Save button to add the geometry to the map.
- Finalize and Close: The geometry is now added as a new layer on the map, and the drawing interface will automatically close.
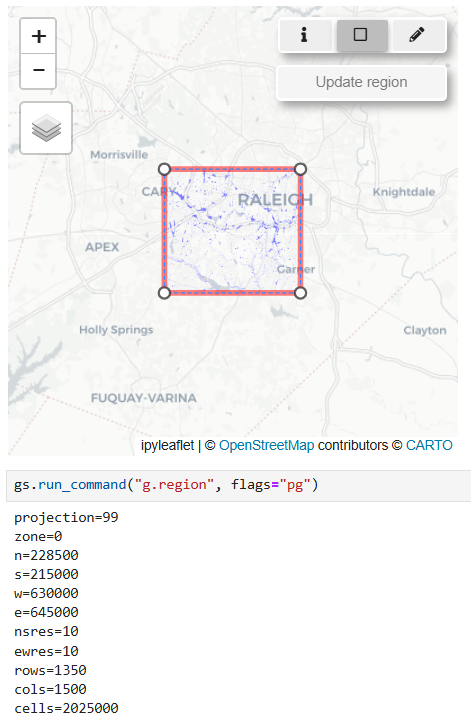
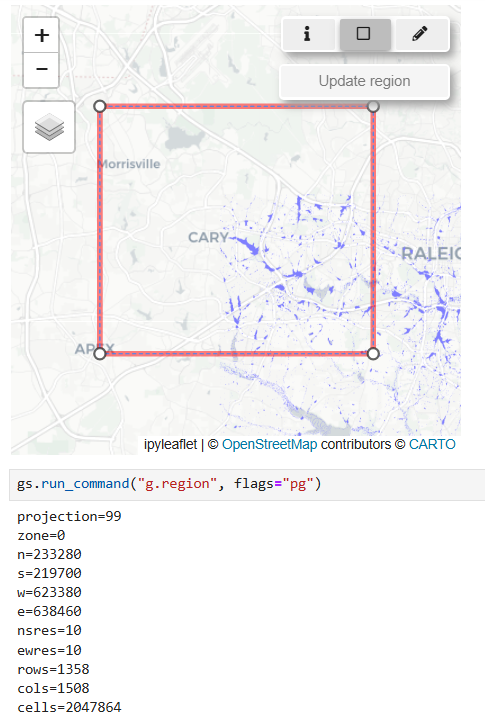
- Viewing and Updating the Computational Region (◻️)
- Activate the Computational Region Tool: Click the View/Update Computational Region button (◻️).
- Visualize the Current Region: The current computational region is displayed as a rectangle on the map.
- Adjust the Region: Move the rectangle to a new location or resize it by dragging its vertices.
- Update the Region: Click Update Region to apply your changes to the computational region.
- Deactivate the Tool: Toggle the button off when you're done.
- Querying Raster/Vector Information at a Specific Point (ℹ️)
- Removal of redundancy in the
TimeSeriesMapandSeriesMap: A new class,BaseSeriesMap, has been added to serve as a parent class to bothTimeSeriesMapandSeriesMap. This enhancement reduces redundancy and streamlines the codebase. - Parallelization in
SeriesMapandTimeSeriesMap- Benchmark for
TimeSeriesMapandSeriesMap: The following tables present the performance results obtained using 1-12 cores, as tested on the examples intemporal.ipynbandjupyter_tutorial.ipynb. Below is an example of how to reproduce this benchmark:
- Benchmark for
cores_range = range(1, 13)
benchmark_results = {}
for cores in cores_range:
    gs.run_command("g.gisenv", set=f"NPROCS={cores}")
    start_time = time.time()
    series = gj.SeriesMap(height=500)
    series.add_rasters(["elevation", "elevation_shade", "slope"])
    series.add_vectors(["streams", "streets", "viewpoints"])
    series.d_vect(map="streets")
    series.d_barscale()
    series.show()  # Create Slider
    end_time = time.time()
    elapsed_time = end_time - start_time
    benchmark_results[cores] = elapsed_time
    print(f"Cores: {cores}, Time: {elapsed_time:.2f} seconds")
| Cores | 1 | 2 | 3 | 4 | 5 | 6 | 7 | 8 | 9 | 10 | 11 | 12 |
|---|---|---|---|---|---|---|---|---|---|---|---|---|
| Time (sec) | 53.42 | 26.24 | 18.99 | 18.50 | 15.08 | 14.04 | 17.68 | 15.75 | 16.00 | 14.12 | 14.22 | 14.76 |
| Cores | 1 | 2 | 3 | 4 | 5 | 6 | 7 | 8 | 9 | 10 | 11 | 12 |
|---|---|---|---|---|---|---|---|---|---|---|---|---|
| Time (sec) | 4.88 | 2.47 | 1.58 | 1.67 | 1.74 | 1.73 | 1.68 | 1.64 | 1.65 | 1.64 | 1.62 | 1.61 |
Conclusion
This project has successfully improved the user experience of GRASS GIS in Jupyter Notebook. Significant enhancements have been made to the InteractiveMap, SeriesMap, and TimeSeriesMap. The new features, such as the Query Button, View/Update Computational Region Button, and Draw Geometries Button, have streamlined data querying, visualization, and editing processes. Introducing the BaseSeriesMap has reduced redundancy, and parallelization has substantially improved performance. Benchmark results show notable speed improvements, making GRASS GIS more efficient and user-friendly. These advancements contribute to a more seamless and productive experience for users.
I appreciate the support and opportunity to contribute to GRASS GIS this summer. Thanks to my mentors and the GRASS Development Team for their guidance. Anna Petrasova's contributions were pivotal to the project's success, and I'm grateful for her support. Looking forward to contributing more.
Future Work
- Improve the distance used in Query Button functionality.
- Use
GeomanDrawControlin the Draw Button functionality. - Enhanced connectivity with Pandas will enable users to display data with a single command.
- Large, high-resolution image display will be enabled by implementing tiling techniques, reducing memory consumption and enabling smooth rendering of large images.
- Implementing a graphical user interface (GUI) for tool presentation within Jupyter Notebooks would simplify usability and enhance user experience, facilitating smoother workflows within the platform.
Links
Pull requests related to grass.jupyter:
| Ttile | Pull Request | Status |
|---|---|---|
| Create BaseSeriesMap to remove redundancies in SeriesMap and TimeSeriesMap | 3468 | Merged |
| Add Query Button to InteractiveMap | 3793 | Merged |
| Allow Users to view/update computational region | 3838 | Merged |
| Allow users to draw simple geometries and save it as vector | 4003 | Merged |
| Add Parallelization to TimeSeriesMap and SeriesMap | 4097 | Merged |
Use InteractiveMap with custom projections
|
4204 | Open |
| Add documentation of InteractiveMap Features and Parallelization in jupyter_tutorial.ipynb | 4164 | Merged |
| Modify Descriptions | 4159 | Merged |
Some additional links:
| Ttile | Link |
|---|---|
| OSGeo Wiki Page | Improve User Experience in Jupyter Notebooks |
| Github Fork | GitHub Fork |
| Example | jupyter_tutorial
|
Images
 |
 |
 |
 |
 |
 |
Media
 |
 |
 |