GRASS and Paraview: Difference between revisions
(new) |
(added https://pyvista.org/) |
||
| (18 intermediate revisions by 5 users not shown) | |||
| Line 1: | Line 1: | ||
= 3D visualization of GRASS data with Paraview= | = 3D visualization of GRASS data with Paraview= | ||
Download Paraview at www.paraview.org (available for Linux, MacOSX and MS-Windows) | Download Paraview at http://www.paraview.org (available for Linux, MacOSX and MS-Windows) ([http://www.paraview.org/paraview/project/imagegallery.php screenshot gallery]) | ||
* See also the [[GRASS and VTK]] wiki page. | |||
== 2D/3D Raster/voxel export == | == 2D/3D Raster/voxel export == | ||
GRASS GIS is one of the few GIS with volume data support. Here data are stored as a 3D raster with a unit volume called a voxel (volume pixel). [[Voxel]]s are designed to support for example representations of trivariate continuous fields. The latest version of GRASS7 supports space time voxel cubes that have time as the third dimension. | |||
* 2D raster maps: {{cmd|r.out.vtk}} | * 2D raster maps: {{cmd|r.out.vtk}} | ||
* 3D raster maps: {{cmd|r3.out.vtk}} | * 3D raster (voxel) maps: {{cmd|r3.out.vtk}} | ||
* Raster color table export: {{AddonCmd|r.colors.out_vtk}} | |||
* 3D raster (voxel) and space time voxel maps as netCDF: r3.out.netcdf | |||
== 2D/3D Vector export == | == 2D/3D Vector export == | ||
| Line 14: | Line 20: | ||
== Visualization == | == Visualization == | ||
Start Paraview, load | Start Paraview, load VTK data, and choose the correct readers : for example "Legacy VTK file"....it is fairly intuitive to use. | ||
In the Properties section click the Apply button, next in the Display section set "Surface" in Representation menu, and set the name of the file that you had load on the Color menu. Then with Edit menu you can set the color scale. | |||
In Paraview you have many filtes to process the data. A useful filter is "Cell data to point data". In the "Filters" drop-down menu you can find it in the "Alphabetical" list. | |||
''(don't hesitate to expand this part)'' | |||
paraview --data=/tmp/threelayer.vtk | |||
[[Image:LausanneDemoDataset3dParaview_4.png|thumb|center|400px|3D groundwater flow]] | |||
[[Image:LausanneDemoDataset3dParaview_10.png|thumb|center|400px|3D groundwater flow]] | |||
== RGB visualization == | |||
Data export with {{cmd|r.out.vtk}}: | |||
r.out.vtk input=dsm_s_michele elevation=dsm_s_michele \ | |||
rgbmaps=ofd_s_michele.red,ofd_s_michele.green,ofd_s_michele.blue \ | |||
out=s_michele_color.vtk | |||
Load into Paraview: | |||
paraview --data=s_michele_color.vtk | |||
* In Paraview, click "Apply" | |||
* Select the "Display" tab and choose "Color by" to switch from input scalars to rgb scalars | |||
* Disable the "Map Scalars" check button in the display tab to avoid the use of a lookup table | |||
[[Image:Paraview fondazione mach 3D.png|thumb|center|400px|Fondazione Mach - S. Michele (Italy) area shown in ParaView]] | |||
== Shown as stereo anaglyphs == | |||
paraview --stereo --data=s_michele_color.vtk | |||
* In Paraview, click "Apply" | |||
* Select the "Display" tab and choose "Color by" to switch from input scalars to rgb scalars | |||
* Disable the "Map Scalars" check button in the display tab to avoid the use of a lookup table | |||
[[Image:Paraview fondazione mach ortho 3D.png|thumb|center|400px|Fondazione Mach - S. Michele (Italy) area shown in ParaView's stereo mode]] | |||
== Creating Stereo anaglyphs == | == Creating Stereo anaglyphs == | ||
| Line 22: | Line 63: | ||
= See also = | = See also = | ||
* | * https://pyvista.org/ | ||
[[Category: Visualization]] | |||
[[Category: Documentation]] | |||
[[Category: FAQ]] | |||
[[Category: Linking to other languages]] | |||
[[Category: Tutorial]] | |||
[[Category: 3D]] | |||
[[Category: VTK]] | |||
Latest revision as of 13:20, 15 January 2025
3D visualization of GRASS data with Paraview
Download Paraview at http://www.paraview.org (available for Linux, MacOSX and MS-Windows) (screenshot gallery)
- See also the GRASS and VTK wiki page.
2D/3D Raster/voxel export
GRASS GIS is one of the few GIS with volume data support. Here data are stored as a 3D raster with a unit volume called a voxel (volume pixel). Voxels are designed to support for example representations of trivariate continuous fields. The latest version of GRASS7 supports space time voxel cubes that have time as the third dimension.
- 2D raster maps: r.out.vtk
- 3D raster (voxel) maps: r3.out.vtk
- Raster color table export: r.colors.out_vtk
- 3D raster (voxel) and space time voxel maps as netCDF: r3.out.netcdf
2D/3D Vector export
- 2D/3D vector maps: v.out.vtk
Visualization
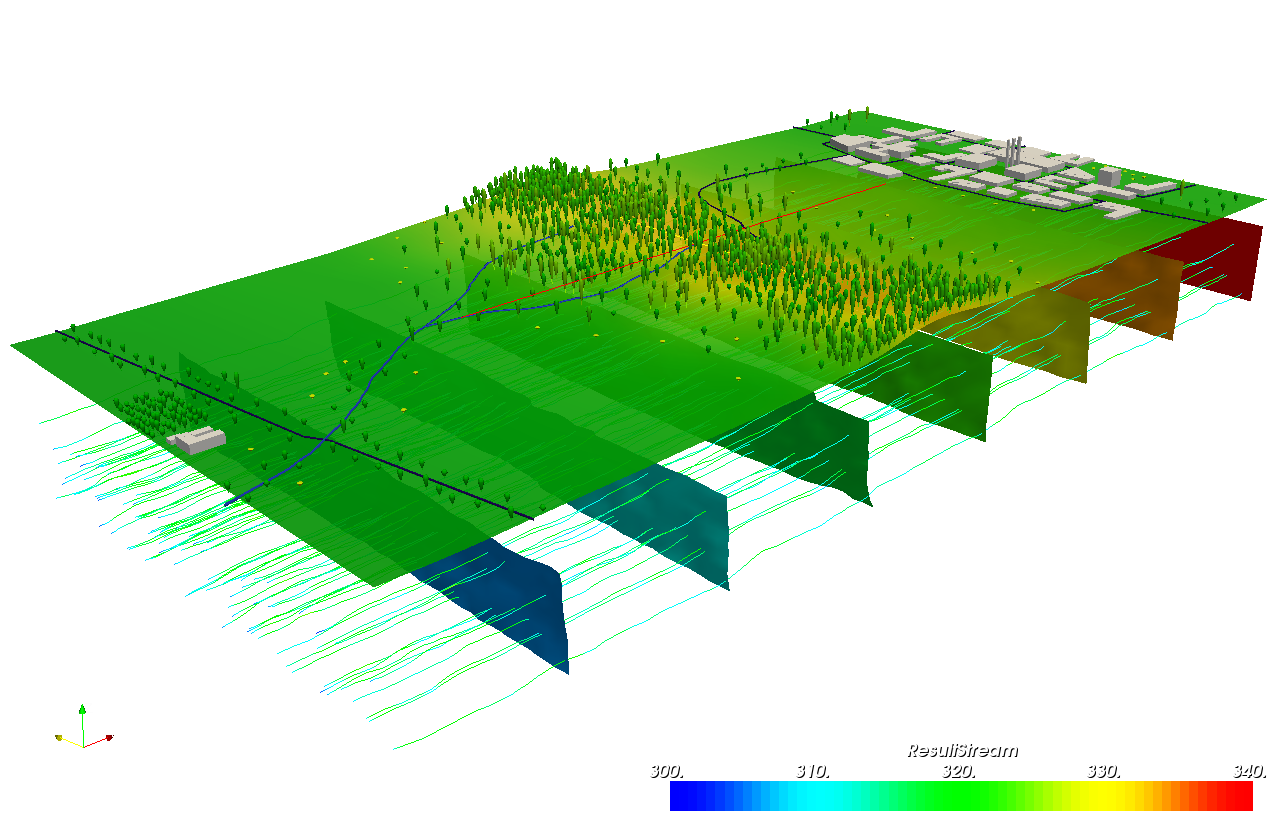
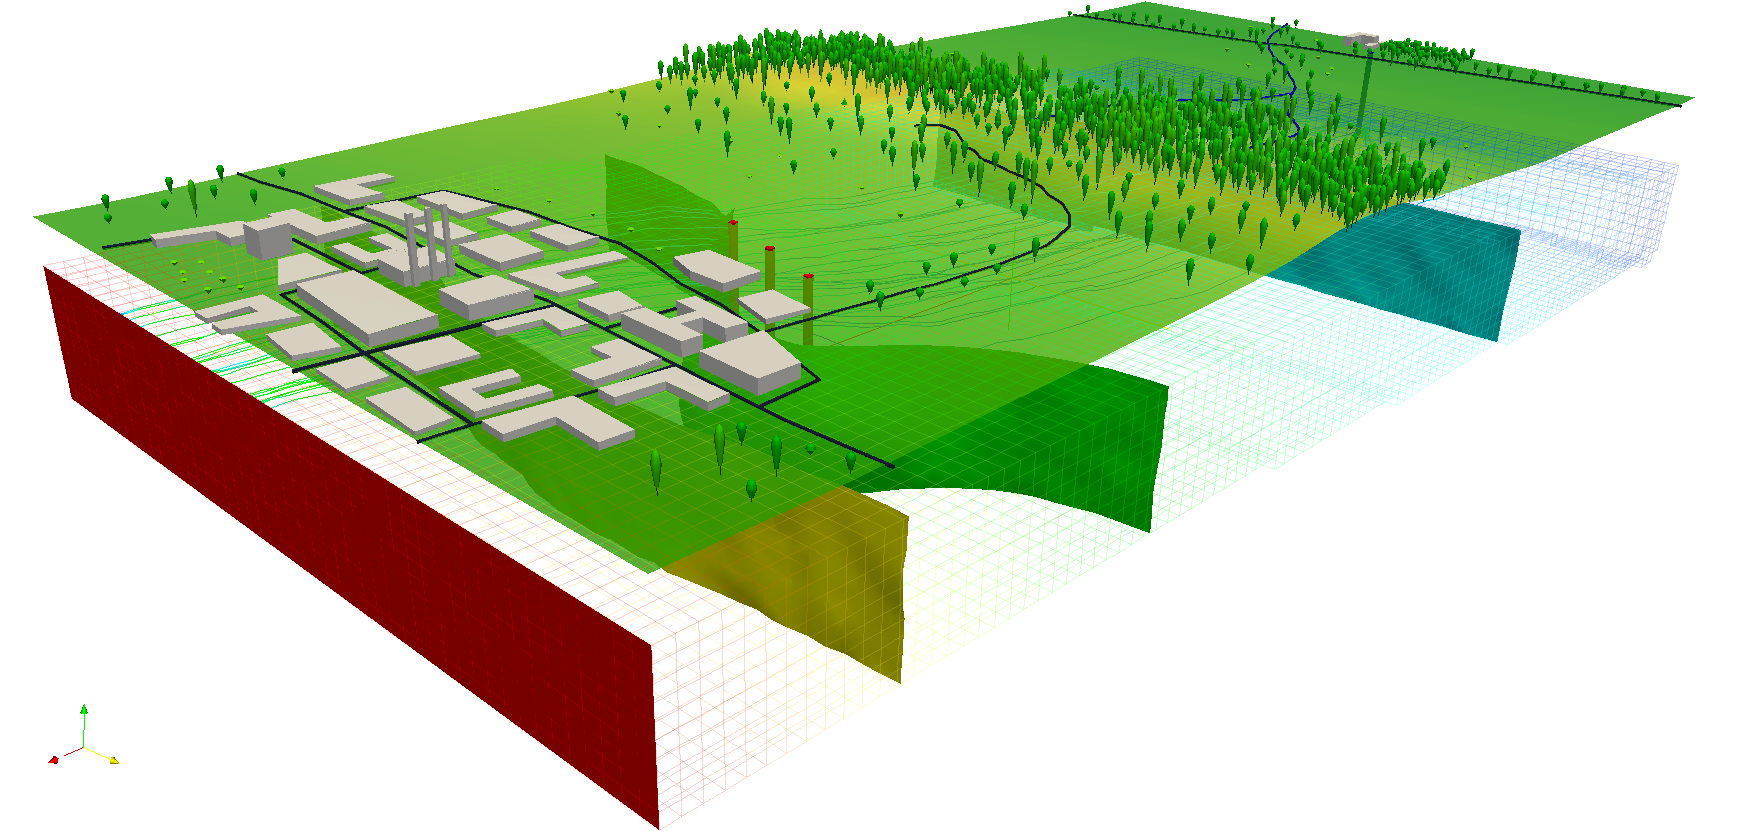
Start Paraview, load VTK data, and choose the correct readers : for example "Legacy VTK file"....it is fairly intuitive to use. In the Properties section click the Apply button, next in the Display section set "Surface" in Representation menu, and set the name of the file that you had load on the Color menu. Then with Edit menu you can set the color scale. In Paraview you have many filtes to process the data. A useful filter is "Cell data to point data". In the "Filters" drop-down menu you can find it in the "Alphabetical" list. (don't hesitate to expand this part)
paraview --data=/tmp/threelayer.vtk


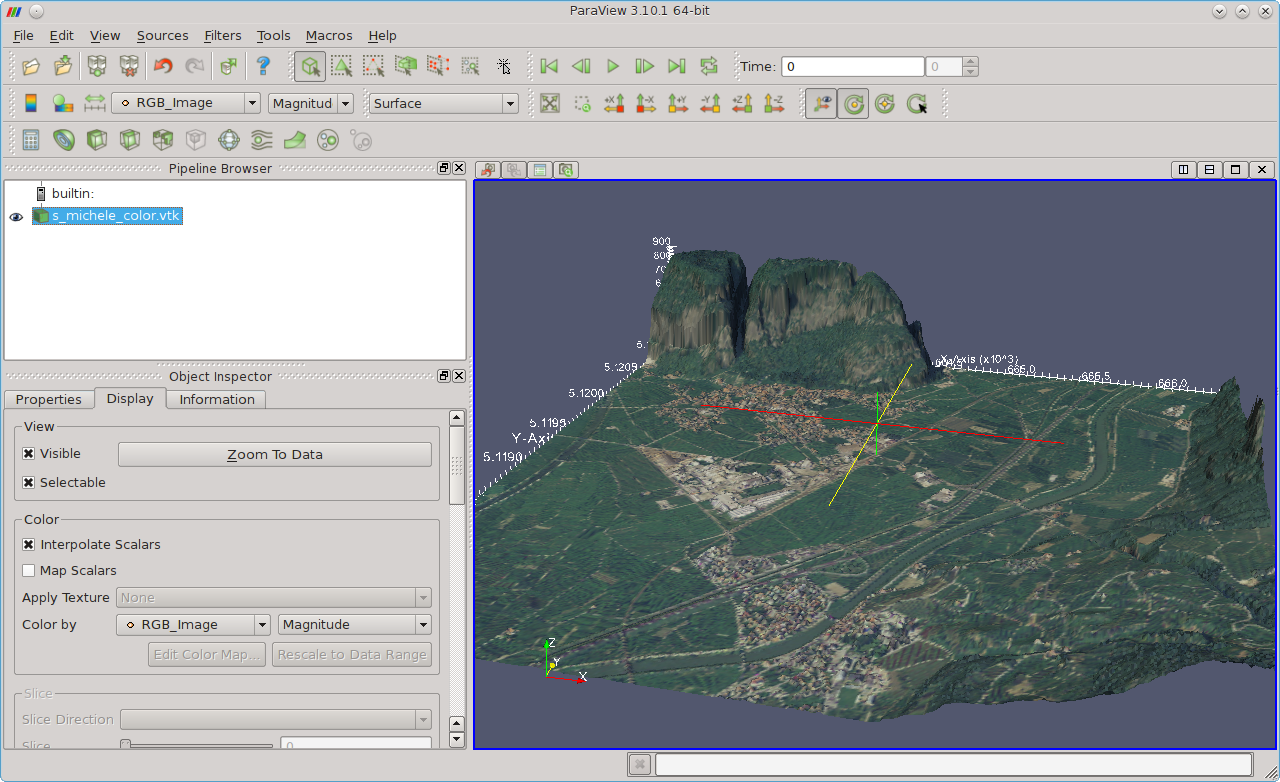
RGB visualization
Data export with r.out.vtk:
r.out.vtk input=dsm_s_michele elevation=dsm_s_michele \
          rgbmaps=ofd_s_michele.red,ofd_s_michele.green,ofd_s_michele.blue \
          out=s_michele_color.vtk
Load into Paraview:
paraview --data=s_michele_color.vtk
- In Paraview, click "Apply"
- Select the "Display" tab and choose "Color by" to switch from input scalars to rgb scalars
- Disable the "Map Scalars" check button in the display tab to avoid the use of a lookup table

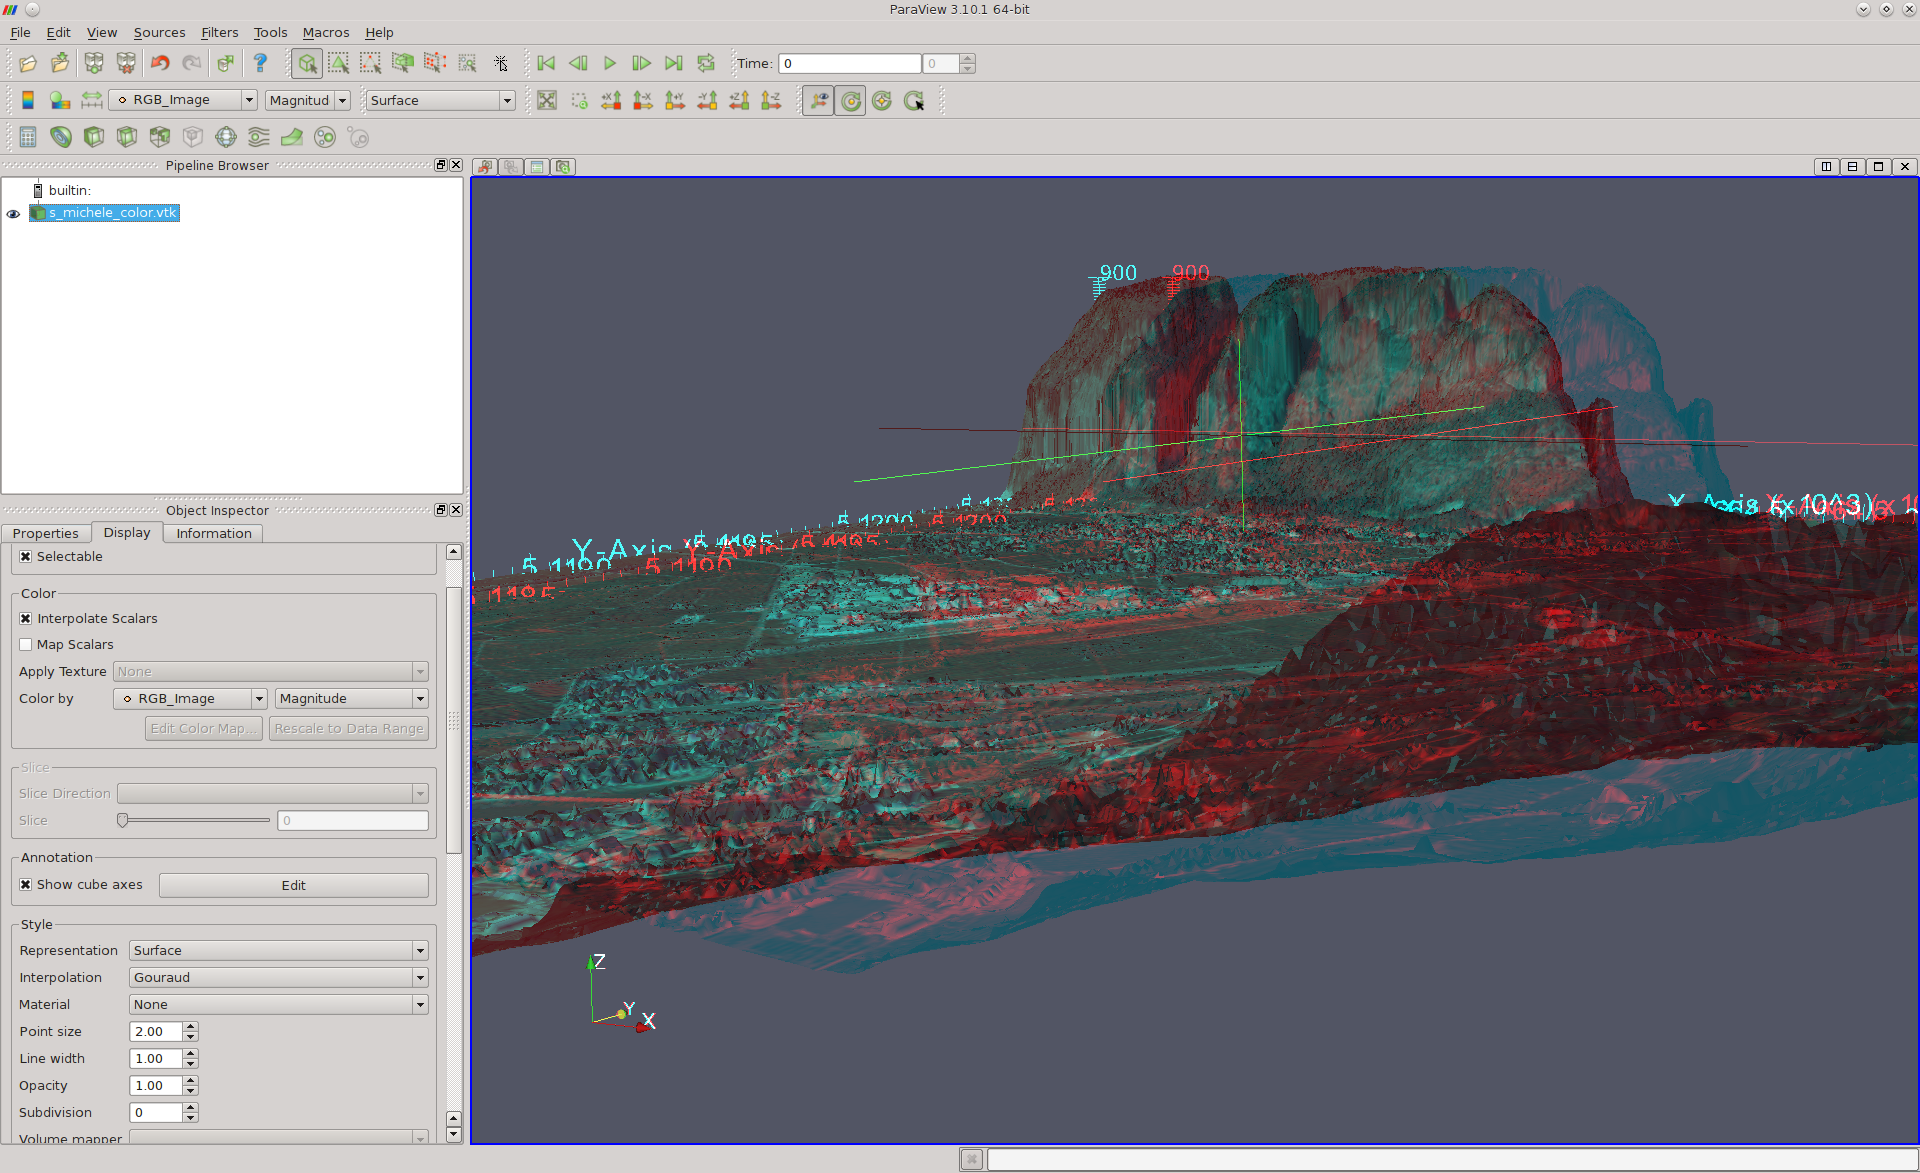
Shown as stereo anaglyphs
paraview --stereo --data=s_michele_color.vtk
- In Paraview, click "Apply"
- Select the "Display" tab and choose "Color by" to switch from input scalars to rgb scalars
- Disable the "Map Scalars" check button in the display tab to avoid the use of a lookup table

Creating Stereo anaglyphs
- see Stereo anaglyphs