WxNviz: Difference between revisions
Jump to navigation
Jump to search
| Line 42: | Line 42: | ||
# List of [http://trac.osgeo.org/grass/query?status=assigned&status=new&status=reopened&order=priority&col=id&col=summary&col=status&col=owner&col=type&col=priority&col=milestone&keywords=~wxNviz open] and [http://trac.osgeo.org/grass/query?status=assigned&status=closed&order=priority&col=id&col=summary&col=status&col=owner&col=type&col=priority&col=milestone&keywords=~wxNviz closed] tickets | # List of [http://trac.osgeo.org/grass/query?status=assigned&status=new&status=reopened&order=priority&col=id&col=summary&col=status&col=owner&col=type&col=priority&col=milestone&keywords=~wxNviz open] and [http://trac.osgeo.org/grass/query?status=assigned&status=closed&order=priority&col=id&col=summary&col=status&col=owner&col=type&col=priority&col=milestone&keywords=~wxNviz closed] tickets | ||
# Adding vector data crashes wxGUI on Mac | # Adding vector data crashes wxGUI on Mac | ||
# Rendering at fine resolution works only when changing viewing position or clicking the buttons that increase the numbers for perspective, twist, height and z-exag. Moving sliders does the required change but there is no redraw to full resolution | # Rendering at fine resolution works only when changing viewing position or clicking the buttons that increase the numbers for perspective, twist, height and z-exag. Moving sliders does the required change but there is no redraw to full resolution | ||
Revision as of 16:36, 18 August 2011
Back to wxGUI page.
See also wxGUI.Nviz manual page.
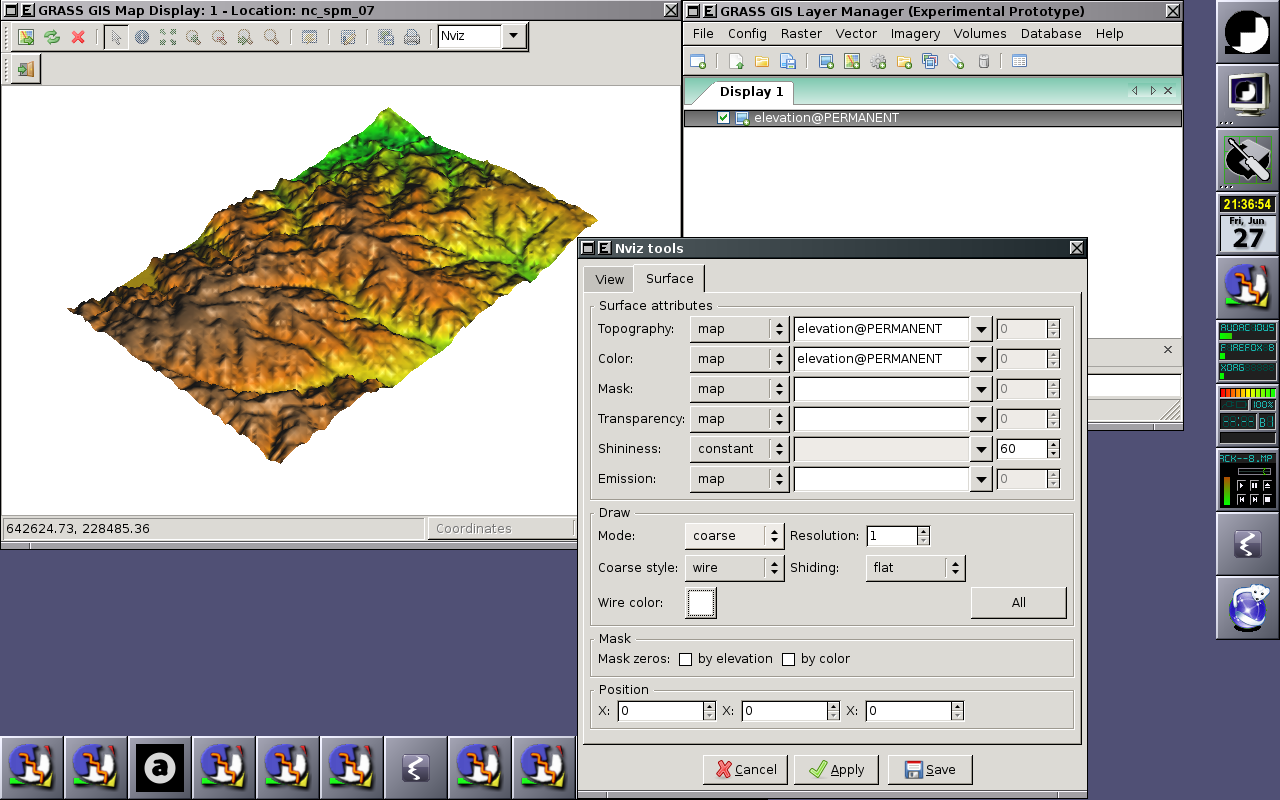
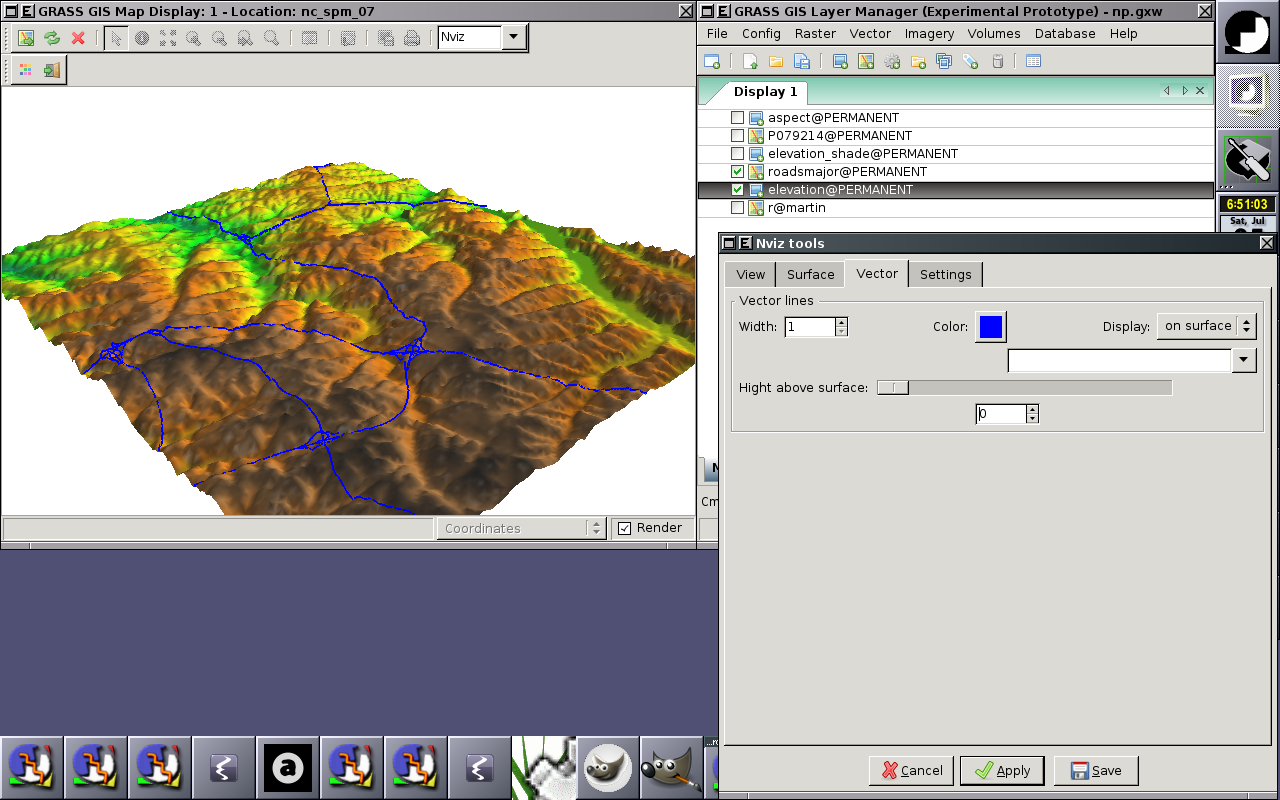
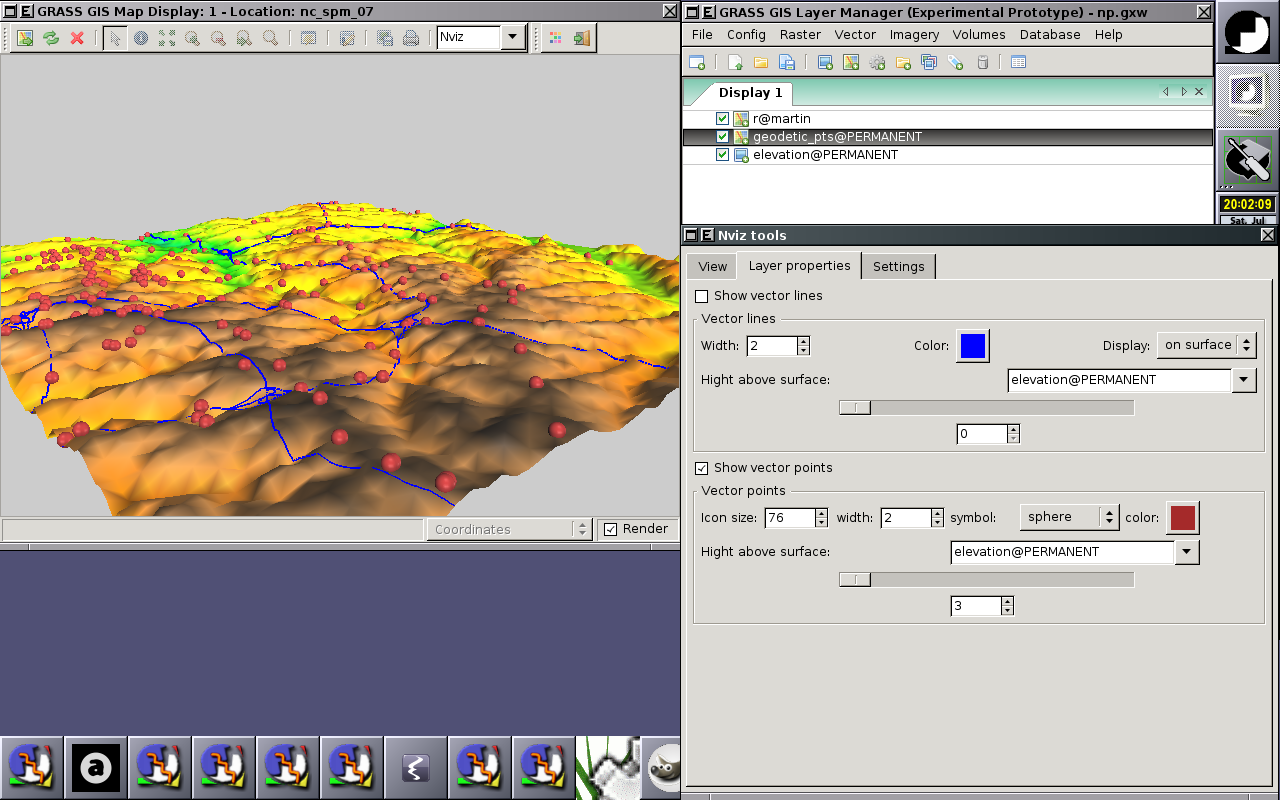
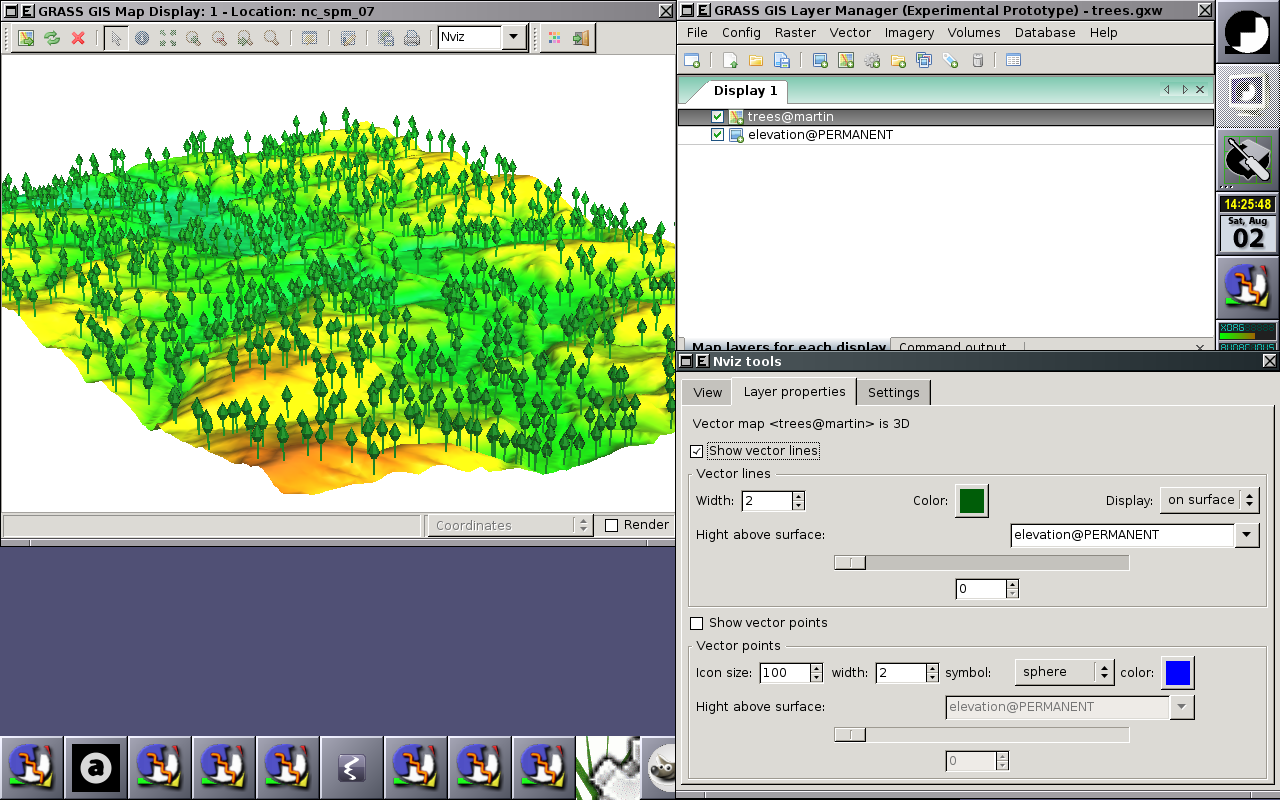
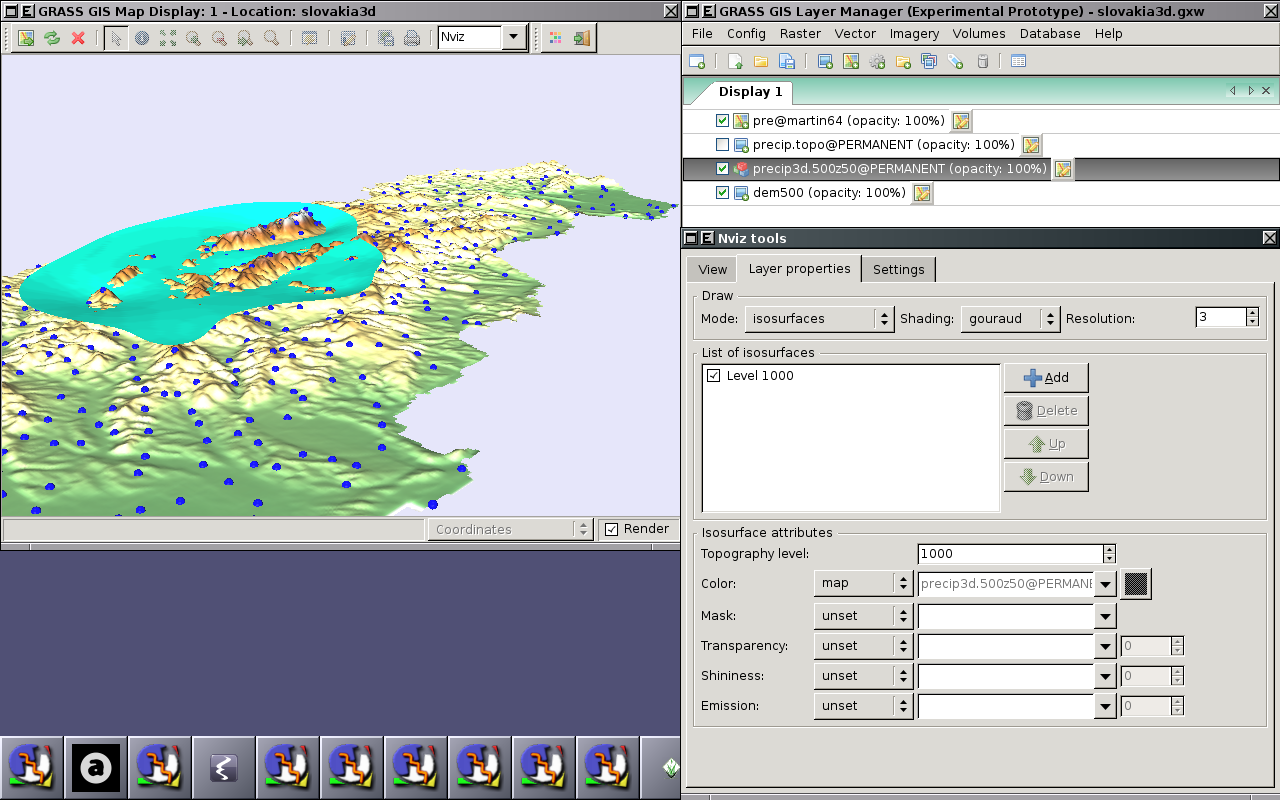
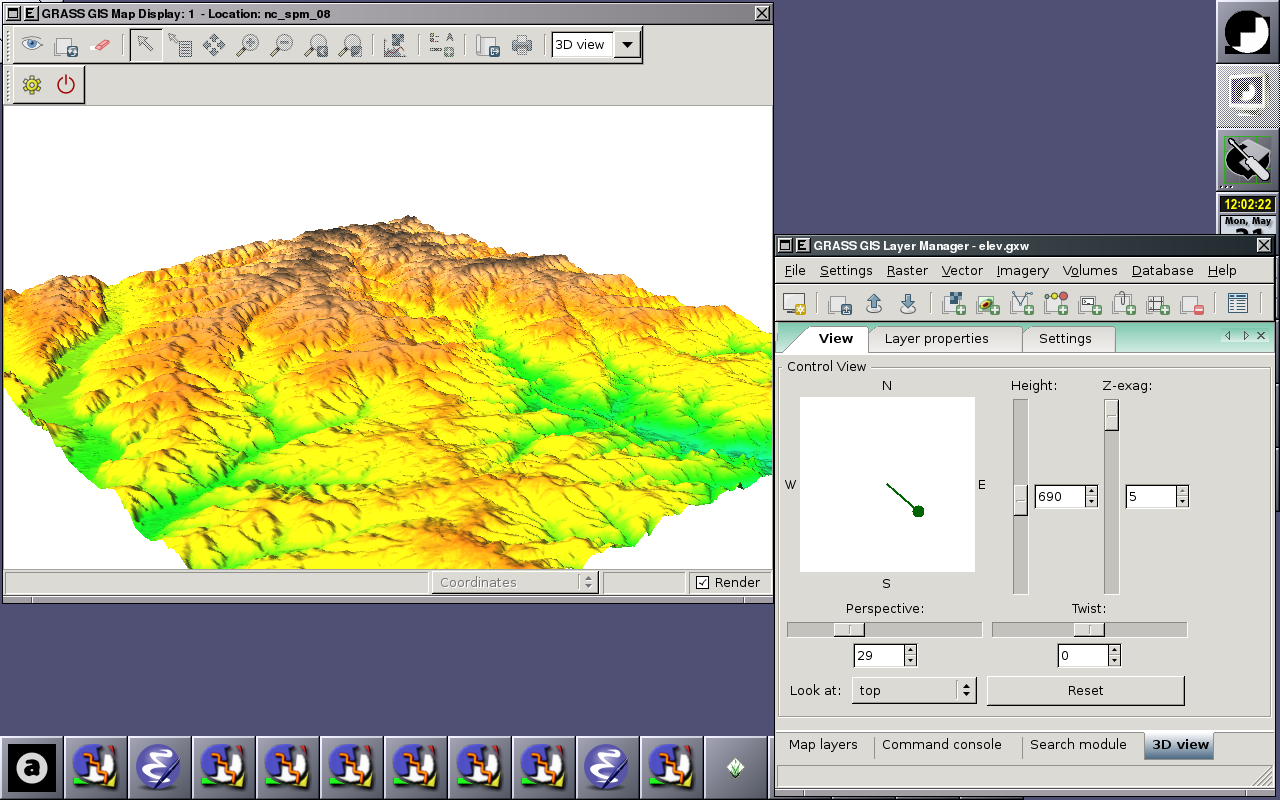
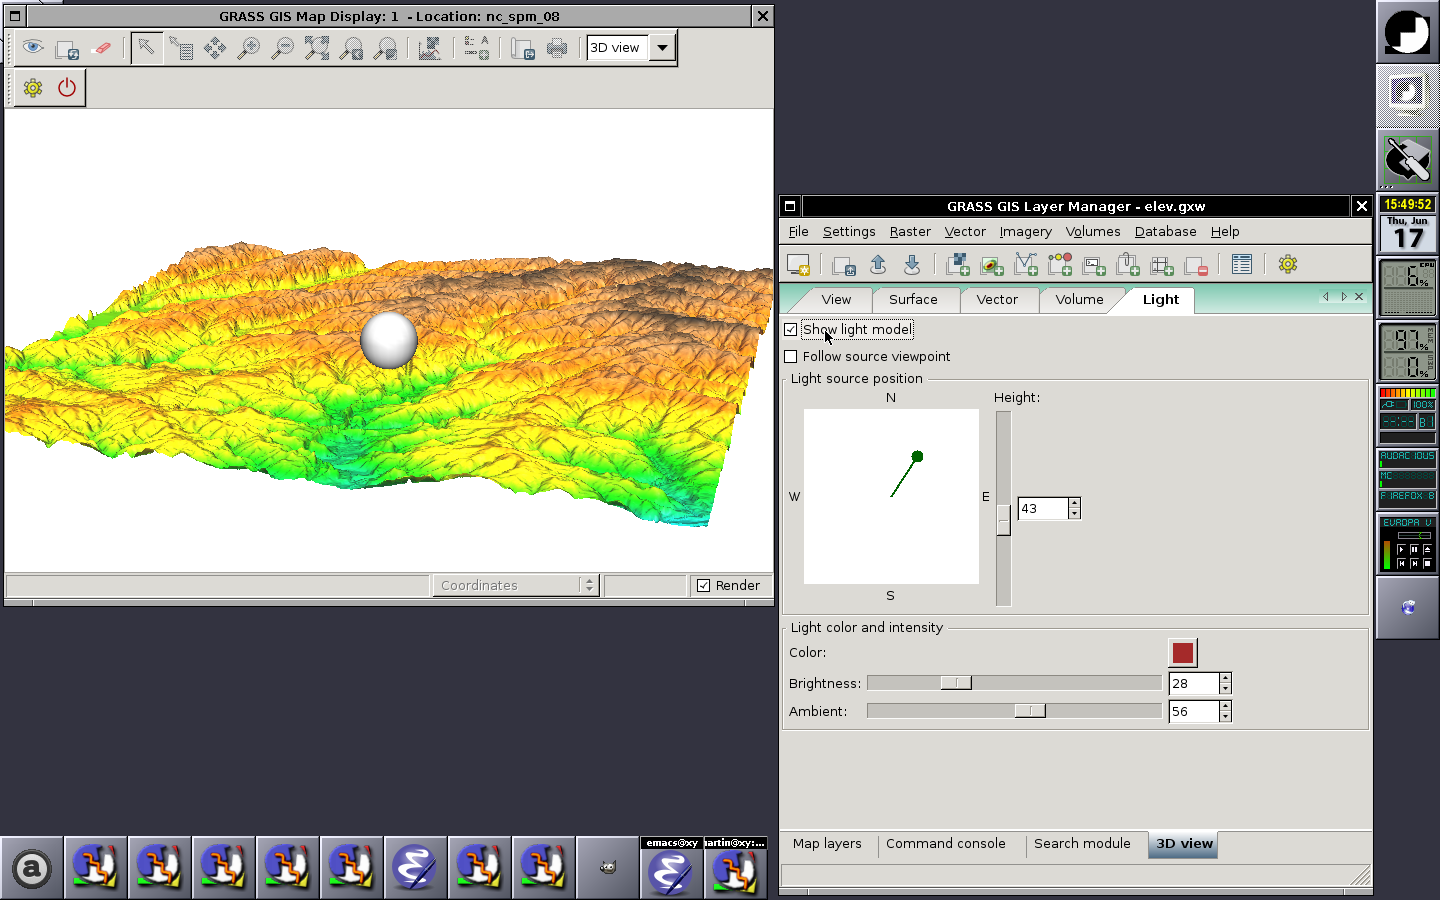
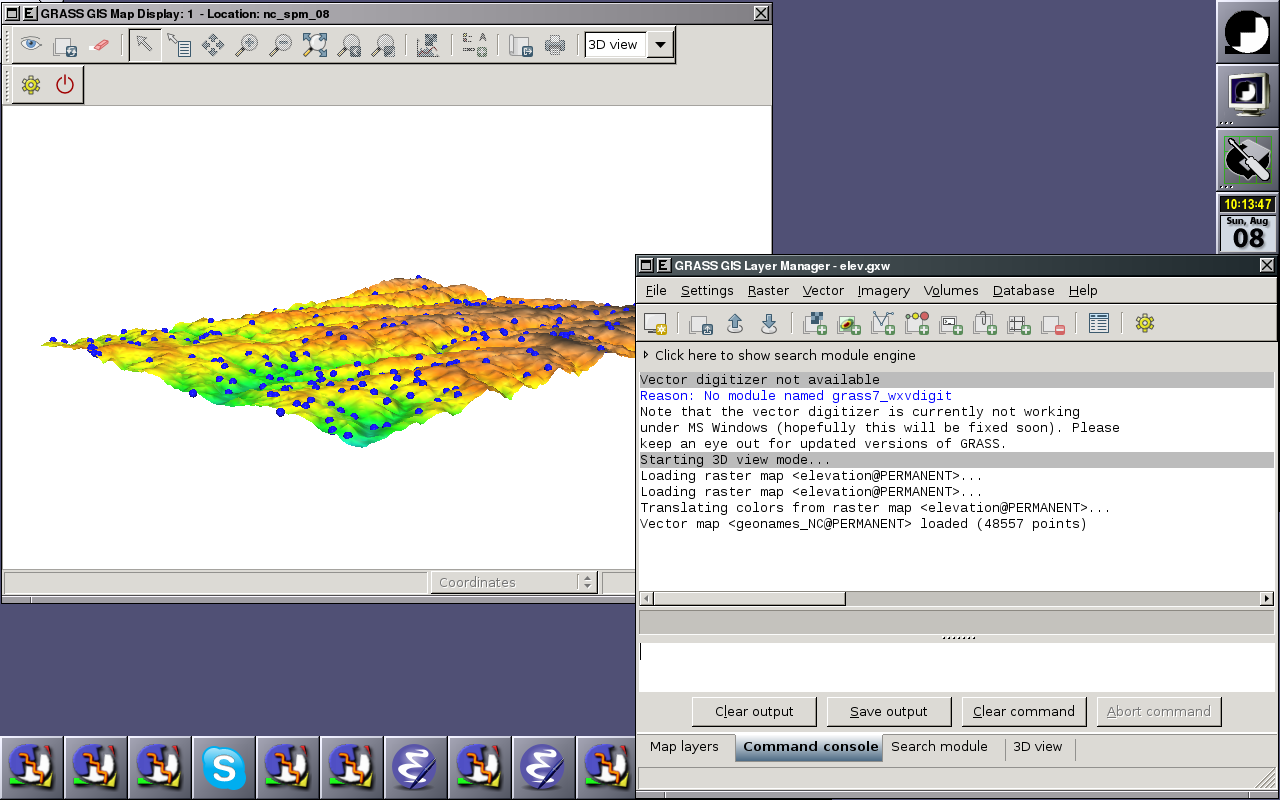
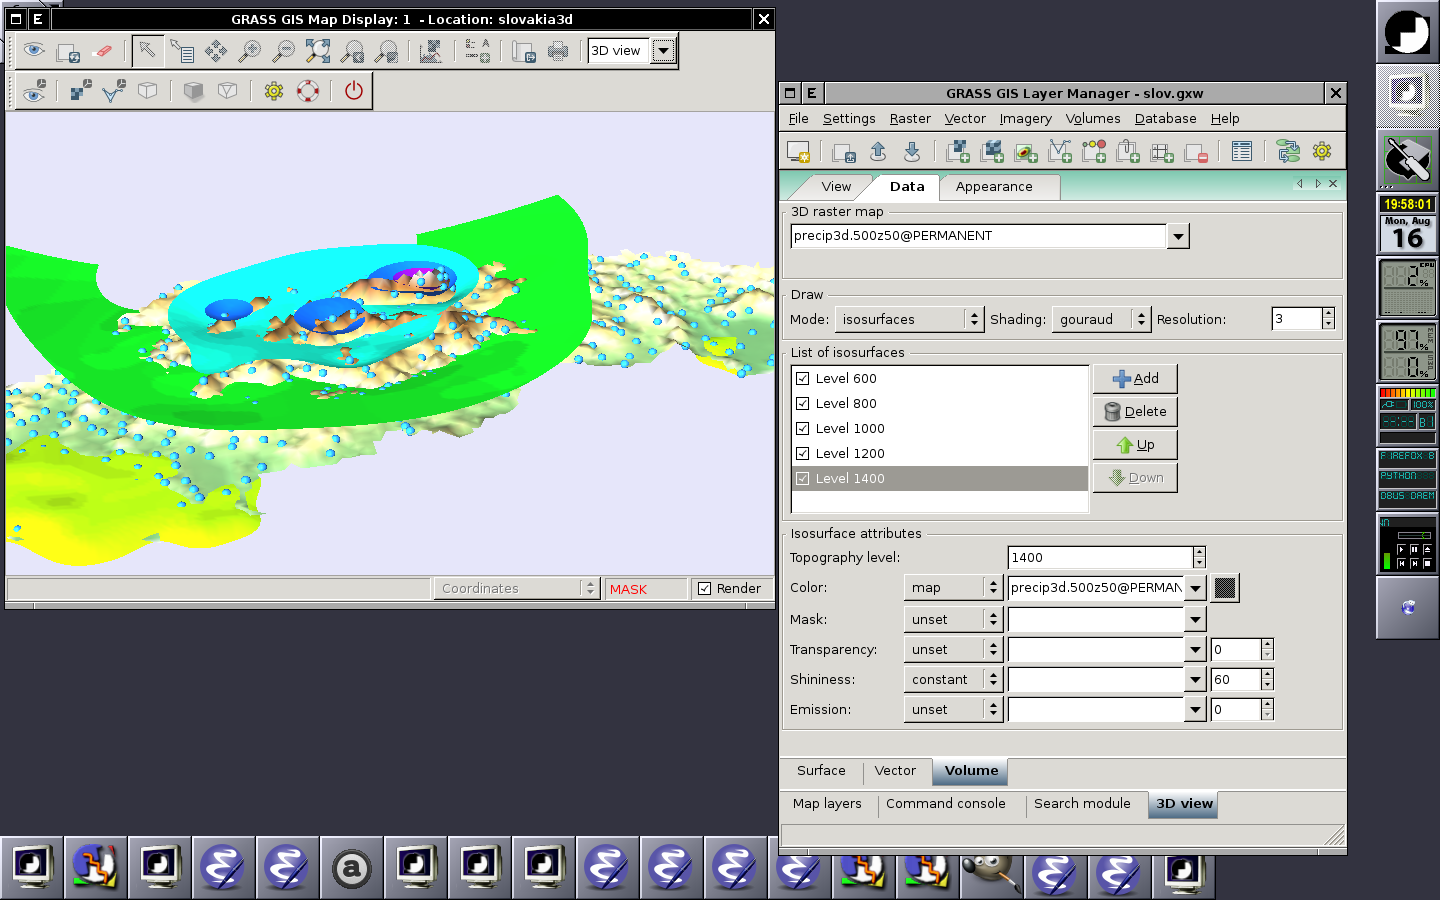
wxNviz is a wxGUI extension which allows users to realistically render multiple surfaces (raster data) in a 3D space, optionally using thematic coloring, draping 2D vector data over the surfaces, displaying 3D vector data in the space, and visualization of volume data (3D raster data).
Screenshots
Video tutorials
Ideas
- Fog support (see [1], [2], [3])
- Vertical labels (take from geonames.org point data): like in http://tev.fbk.eu/marmota/blog/?p=82
- Second interactive light source for isosurface visualization
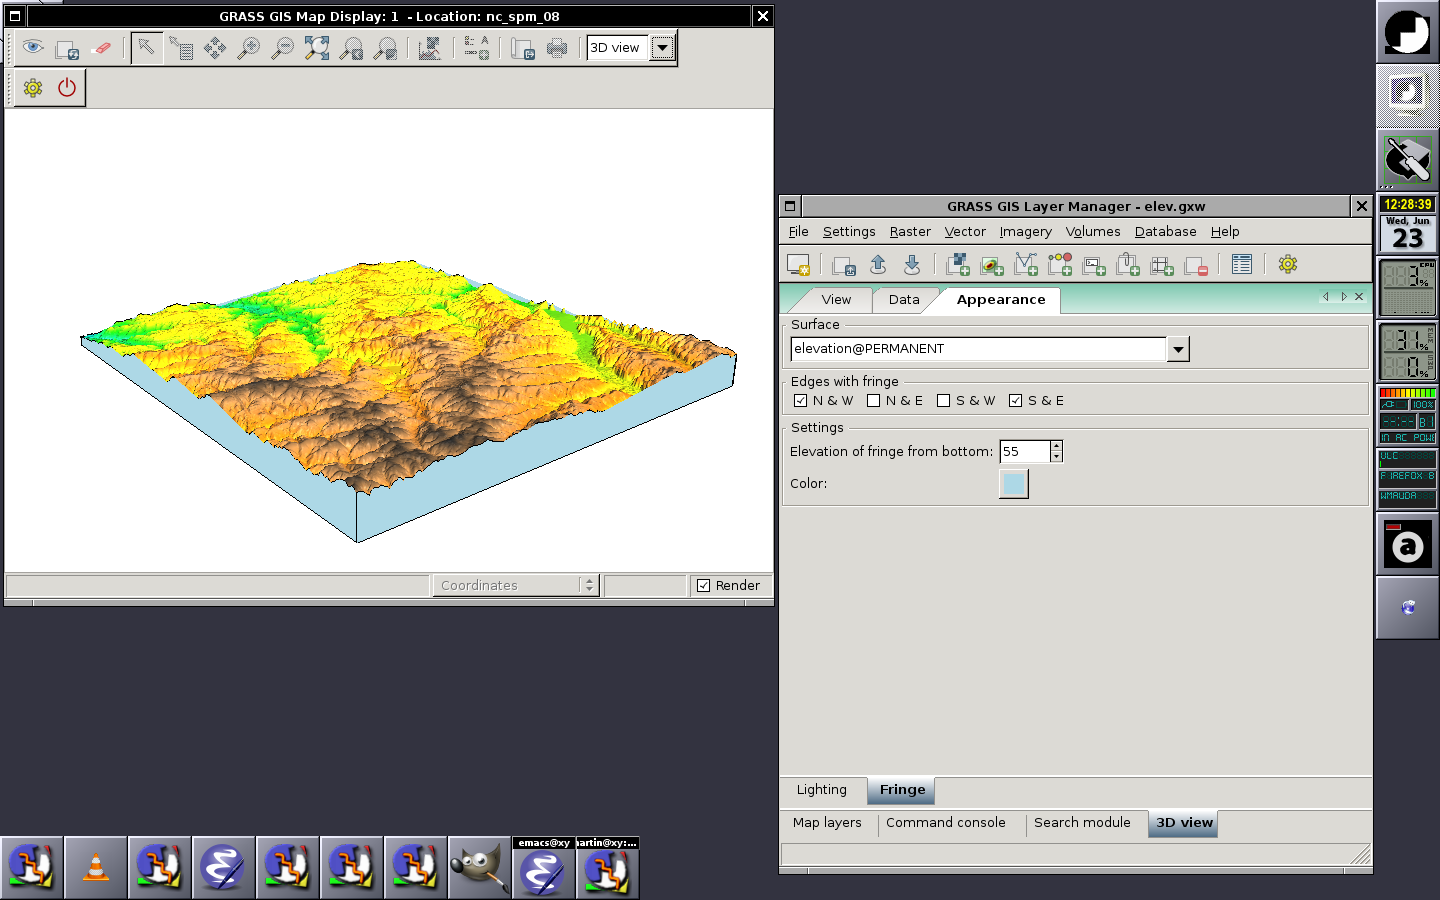
- Tick marks and coordinate values to x,y,z axis when drawing fringe
Known issues
- List of open and closed tickets
- Adding vector data crashes wxGUI on Mac
- Rendering at fine resolution works only when changing viewing position or clicking the buttons that increase the numbers for perspective, twist, height and z-exag. Moving sliders does the required change but there is no redraw to full resolution
- Viewing height sometimes sets to 1 after switching to 2D and back to 3D View (or with the simultaneous 2D view - very nice feature) and even after View is reset, it keeps getting back at 1 each time the slider is touched
- Hopefully fixed in r46208
- Typing in the height or z-exag numbers and ENTER does not do anything but the typed number gets accepted after clicking on the increase/decrease button, it is not possible to set the height value beyond the initial maximum
- Adding fringe just flashes it but it does not stay
- Isosurfaces tested with Nags Head time series data (I will provide link) don't seem to be working, after setting 3D region and adding 3D raster nothing gets drawn, when moving the related DEM around only line rectangle shows instead of a box.
- Adding draw, draw current and clear button may be useful
