Extrude 2D polygons to 3D: Difference between revisions
m (→See also) |
|||
| Line 82: | Line 82: | ||
[[Category: FAQ]] | [[Category: FAQ]] | ||
[[Category: 3D]] | |||
Revision as of 09:11, 11 February 2013
Creating a 3D city model
You can create a 3D city model easily in GRASS GIS even if building heights are not available using v.extrude. We'll just assume a constant building height (otherwise you can use individual heights stored in the attribute table for the respective building).
Here an example with OpenStreetMap (OSM) data:
# first reproject OSM data from LatLong to metric projection, e.g. UTM32N:
ogr2ogr -t_srs epsg:32632 polygons_UTM32.shp polygons.shp

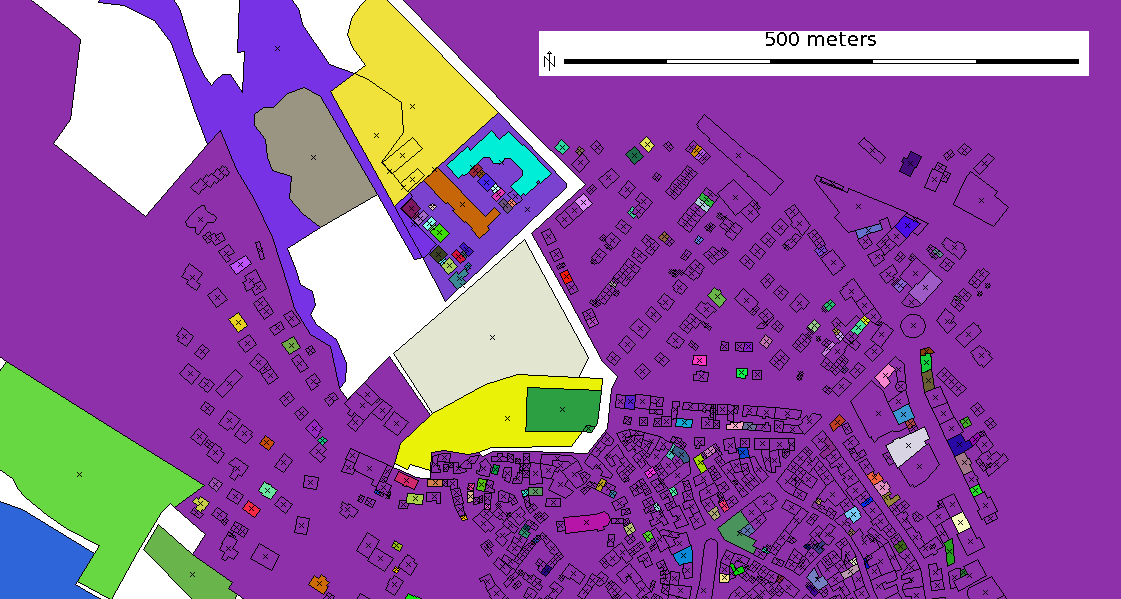
OSM map import and building extraction into new map
Import into a metric GRASS location (here: UTM32N), extract the buildings and extrude them to 3D:
v.in.ogr polygons_UTM32.shp out=oberursel2D

# colorize a bit
v.colors oberursel2D column=cat color=random
d.mon x0
d.vect -a oberursel2D
d.barscale -mt

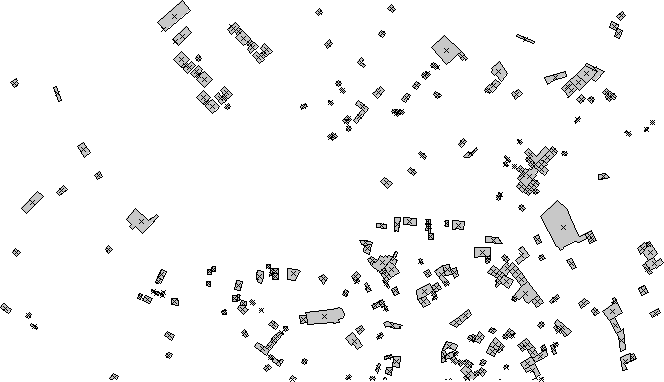
# extract the buildings into a new map (use db.connect -p to see which driver you are using):
### statement for DBF driver:
v.extract oberursel2D out=oberursel2D_small where="tags LIKE 'building'"

### statement for SQLite driver:
v.extract oberursel2D out=oberursel2D_small where="tags LIKE '%building%'"

We see that a lot of buildings are actually NOT tagged as buildings. You may fix that at http://www.openstreetmap.org/
Alternative: use v.db.addcol to add an "area double precision" column and upload the area sizes in (square)meters with v.to.db. Then use v.extract to extract all areas over, say, 200 m^2. However, better fix the OSM map!
Extruding building polygons to 3D
# extrude 2D building polygons to 3D, here with a constant height (you can indicate an attribute column for individual heights):
v.extrude oberursel2D_small out=oberursel3D height=20 elevation=srtm

# check that the 'areas' have become type 'faces':
v.info oberursel3D
Ready! Note that you can make use of individual heights when stored in the attribute table for the respective building since v.extrude supports also that.
Extra ideas
To make the visualization more realistic, use the building footprint area to assign a more realistic (assumed) building height. This can done with v.db.update rather easily by applying a series of range formulas.
Visualization
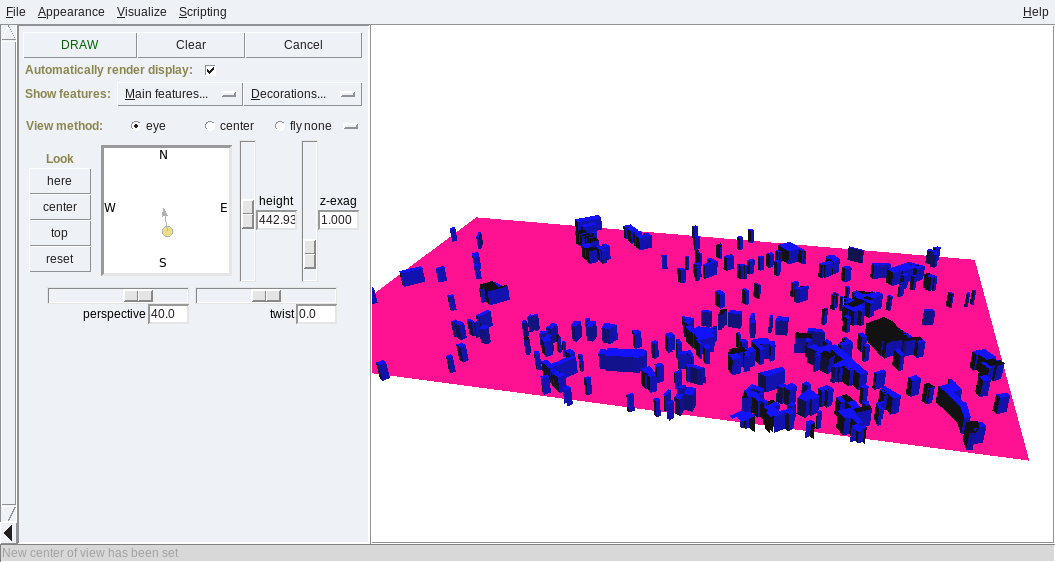
Now we can visualize them:
# set computation region to map:
g.region vect=oberursel3D

# generate a pseudo-DEM (if you have a real DEM, use the 'elevation=' parameter in v.extrude above):
r.mapcalc "mydem = 0.0"

# visualize in 3D:
nviz elevation=mydem vect=oberursel3D

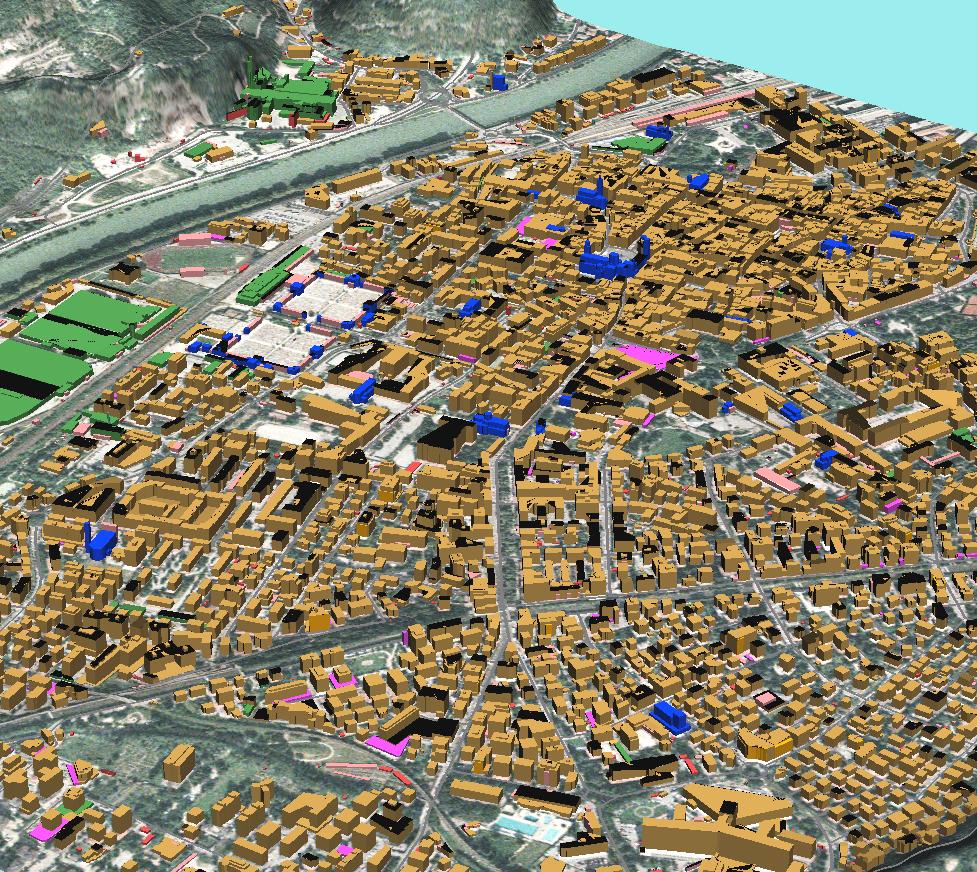
Example of City of Trento
This map has been created from data provided by the municipality of Trento which includes individual building heights.
