Zonal statistics: Difference between revisions
Jump to navigation
Jump to search
(highlight relevant modules) |
m (simplify description) |
||
| Line 17: | Line 17: | ||
* {{cmd|r.univar}}: univariate and zonal raster statistics | * {{cmd|r.univar}}: univariate and zonal raster statistics | ||
* {{cmd|v.rast.stats}}: calculates univariate statistics from a raster map based on vector polygons and uploads statistics to new attribute columns | * {{cmd|v.rast.stats}}: calculates univariate statistics from a raster map based on vector polygons and uploads statistics to new attribute columns | ||
* {{cmd|v.vect.stats}}: count points in areas, calculate statistics from point attributes | * {{cmd|v.vect.stats}}: count points in areas, calculate statistics from point attributes | ||
=== Example === | === Example === | ||
Latest revision as of 11:32, 5 April 2017
GRASS GIS offers support for zonal statistics

Single maps
- r.clump: finds all areas of contiguous raster cell category values in the input raster map and assigns a unique category value to each such area ("clump") in the resulting output raster map. This can be used to calculate statistics based on the clumps instead of individual raster cells.
- r.report: report generator in various units
- r.neighbors: makes each cell category value a function of the category values assigned to the cells around it, and stores new cell values in an output raster map layer.
- v.neighbors: makes each cell value a function of the attribute values assigned to the vector points or centroids around it, and stores new cell values in an output raster map layer.
Multiple maps
- r.univar: univariate and zonal raster statistics
- v.rast.stats: calculates univariate statistics from a raster map based on vector polygons and uploads statistics to new attribute columns
- v.vect.stats: count points in areas, calculate statistics from point attributes
Example
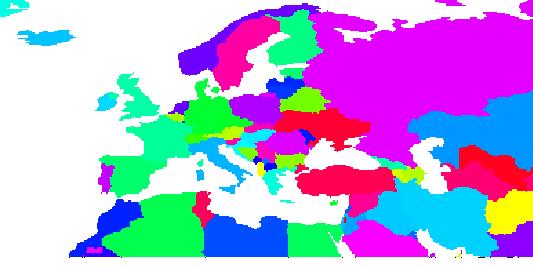
Task: calculate average temperature per country. Available maps: SHAPE file of countries, raster map of temperature.
Solution: First set the computational region to the vector map along with the desired raster resolution. Then convert the vector country map to raster using v.to.rast. Then run r.univar which offers zonal statistics using the country map on top of the temperature raster map. The command optionally outputs the result as table output format instead of standard output format.