GRASS and Paraview: Difference between revisions
Jump to navigation
Jump to search
(+RGB visualization) |
(+ Paraview RGB screenshot) |
||
| Line 18: | Line 18: | ||
paraview --data=/tmp/threelayer.vtk | paraview --data=/tmp/threelayer.vtk | ||
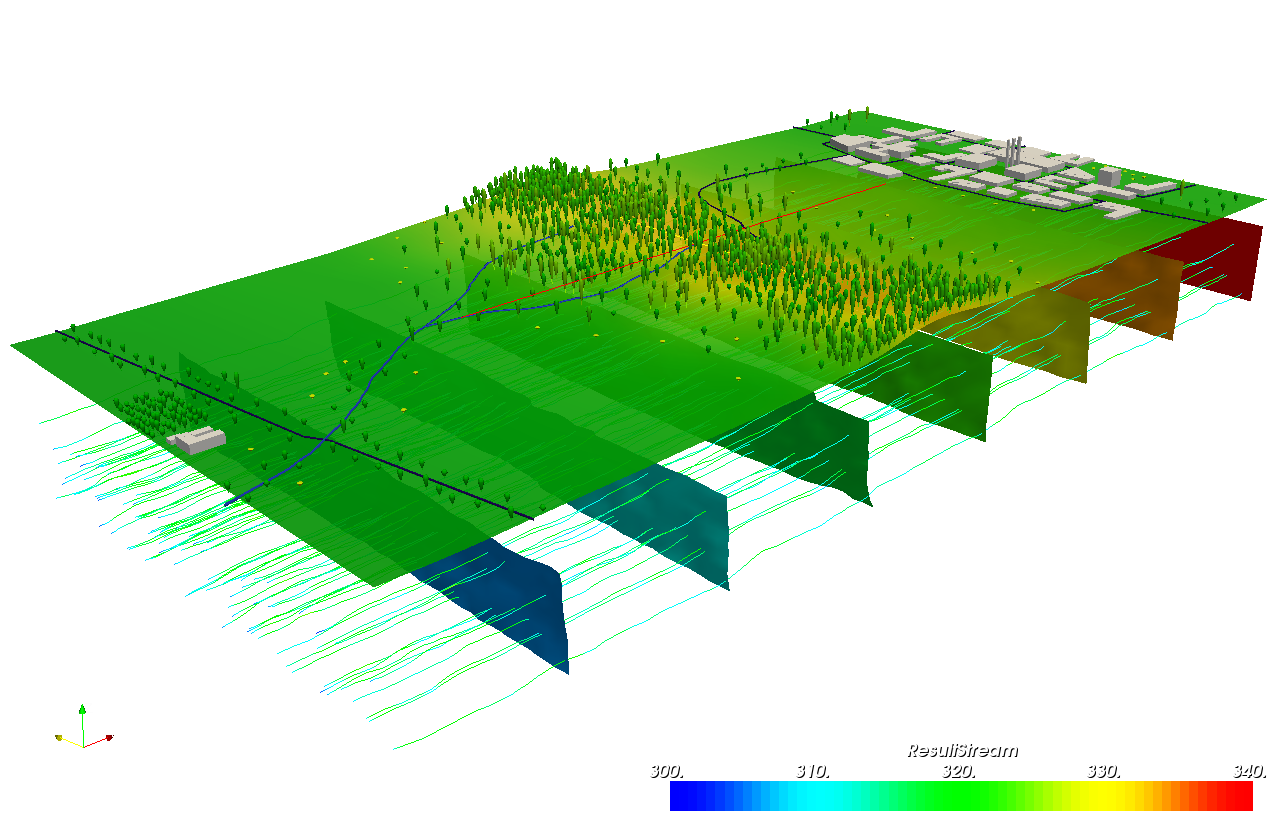
[[Image:LausanneDemoDataset3dParaview_4.png|thumb|center| | [[Image:LausanneDemoDataset3dParaview_4.png|thumb|center|400px|3D groundwater flow]] | ||
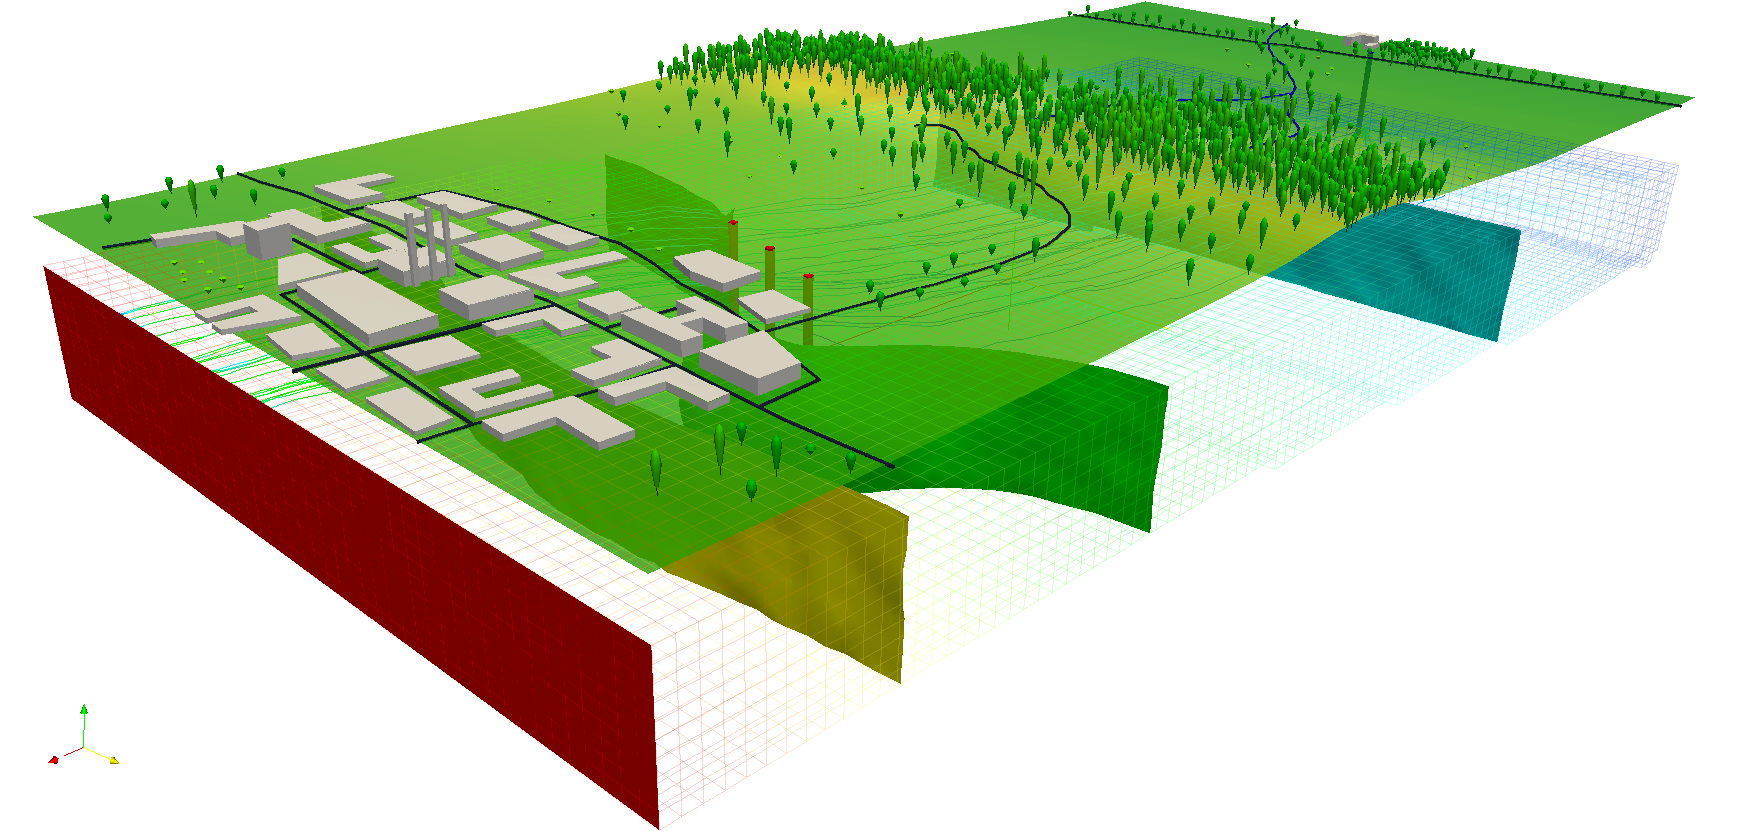
[[Image:LausanneDemoDataset3dParaview_10.png|thumb|center| | [[Image:LausanneDemoDataset3dParaview_10.png|thumb|center|400px|3D groundwater flow]] | ||
== RGB visualization == | == RGB visualization == | ||
| Line 35: | Line 35: | ||
* Select the "Display" tab and choose "Color by" to switch from input scalars to rgb scalars | * Select the "Display" tab and choose "Color by" to switch from input scalars to rgb scalars | ||
* Disable the "Map Scalars" check button in the display tab to avoid the use of a lookup table | * Disable the "Map Scalars" check button in the display tab to avoid the use of a lookup table | ||
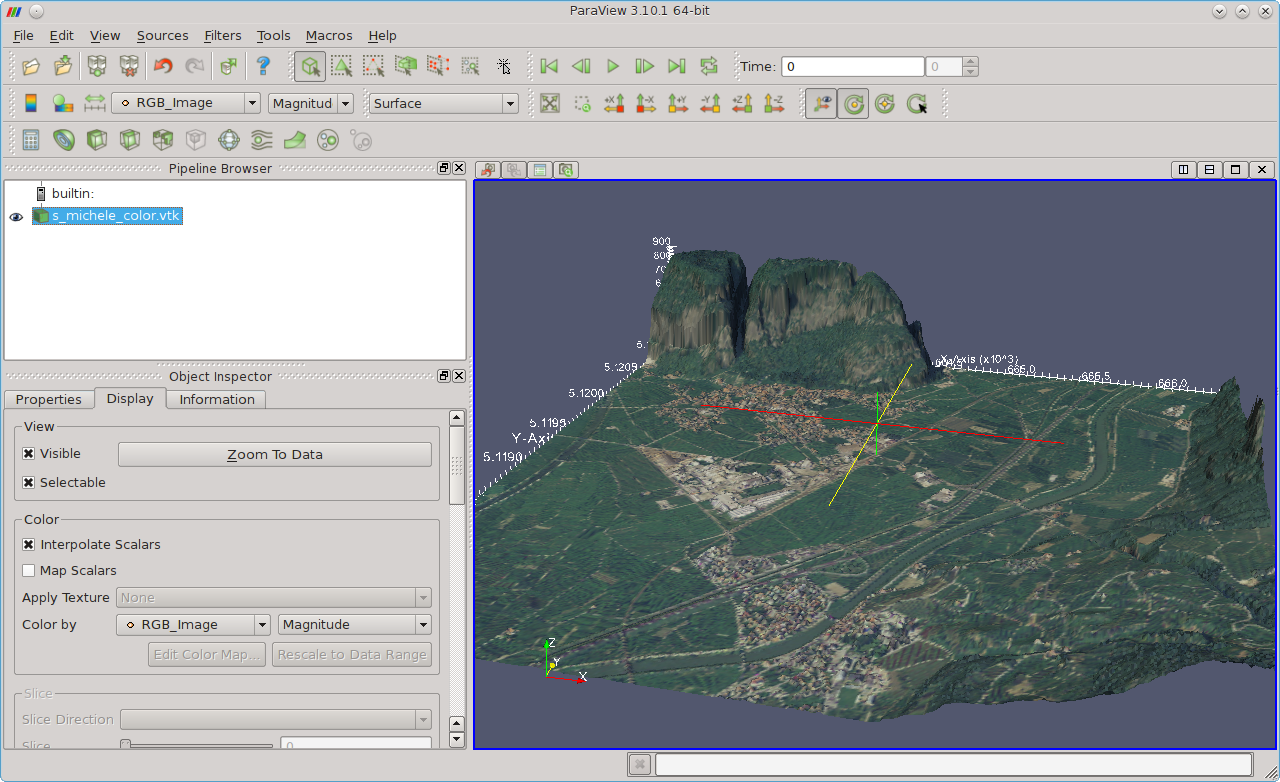
[[Image:Paraview fondazione mach 3D.png|thumb|center|400px|Fondazione Mach - S. Michele (Italy) area shown in ParaView]] | |||
== Creating Stereo anaglyphs == | == Creating Stereo anaglyphs == | ||
Revision as of 13:38, 11 January 2012
3D visualization of GRASS data with Paraview
Download Paraview at http://www.paraview.org (available for Linux, MacOSX and MS-Windows) (screenshot gallery)
2D/3D Raster/voxel export
- 2D raster maps: r.out.vtk
- 3D raster maps: r3.out.vtk
2D/3D Vector export
- 2D/3D vector maps: v.out.vtk
Visualization
Start Paraview, load the VTK data,... it is fairly intuitive to use. (don't hesitate to expand this part)
paraview --data=/tmp/threelayer.vtk


RGB visualization
Data export with r.out.vtk:
r.out.vtk input=dsm_s_michele elevation=dsm_s_michele \
          rgbmaps=ofd_s_michele.red,ofd_s_michele.green,ofd_s_michele.blue \
          out=s_michele_color.vtk
Load into Paraview:
paraview --data=s_michele_color.vtk
- In Paraview, click "Apply"
- Select the "Display" tab and choose "Color by" to switch from input scalars to rgb scalars
- Disable the "Map Scalars" check button in the display tab to avoid the use of a lookup table

Creating Stereo anaglyphs
- see Stereo anaglyphs
See also
- GRASS 3D Workshop -- 3D data visualization with VTK: PDF handouts (S. Gebbert)
- Video tutorials: r3.out.vtk Tutorial in four parts (S. Gebbert)
- GRASS and VTK related screenshots (S. Gebbert)