Voxel: Difference between revisions
m (→Visualization) |
|||
| Line 39: | Line 39: | ||
[[Image:LausanneDemoDataset3dParaview_10.png|thumb|center|400px|3D groundwater flow]] | [[Image:LausanneDemoDataset3dParaview_10.png|thumb|center|400px|3D groundwater flow]] | ||
=== See also === | |||
* [[Help with 3D]] | |||
[[Category: Documentation]] | |||
[[Category: Visualization]] | |||
[[Category: Voxel]] | |||
Revision as of 12:53, 30 November 2012
3D raster map (voxel) processing in GRASS
GRASS GIS is one of the few GIS with volume data support. Here data are stored as a 3D raster with a unit volume called a voxel (volume pixel). Voxels are designed to support for example representations of trivariate continuous fields.
Import or creating of volumes
From 3D point data:
You can import 3D ASCII raster data in GRASS voxel format using r3.in.ascii or r3.in.xyz (in GRASS 6 an Addon). Note:
- For r3.in.ascii the data need to be plain and properly ordered value data with a header (see the manual for the format).
- In case of regular 3D data (x,y,z,value) in a CSV style file, use r3.in.xyz with method "mean". This only works properly when one value falls into a target voxel.
From 2D raster maps:
You can also create a volume raster model based on 2D raster data by converting 2D raster slices into 3D raster or a 3D volume map based on 2D elevation and value raster maps.
See the raster3dintro for more details.
Voxel operations
Powerful 3D map algebra is implemented in r3.mapcalc.
A 3D groundwater flow model is implement in r3.gwflow.
Cross-sections can be generated with r3.cross.rast.
Voxels can be interpolated from 3D point dat from v.vol.rst.
Voxel statistics
Volume statistics can be calculated with r3.stats and r3.univar.
Visualization
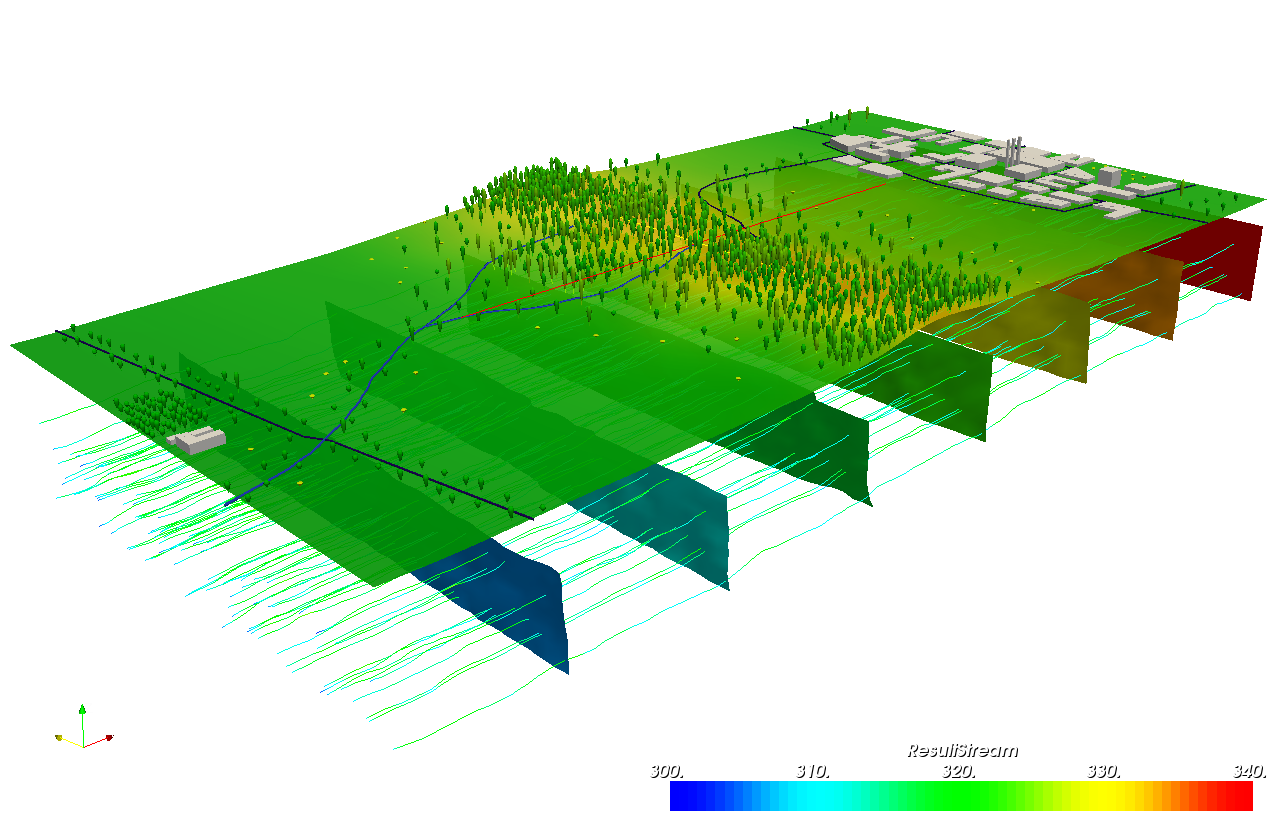
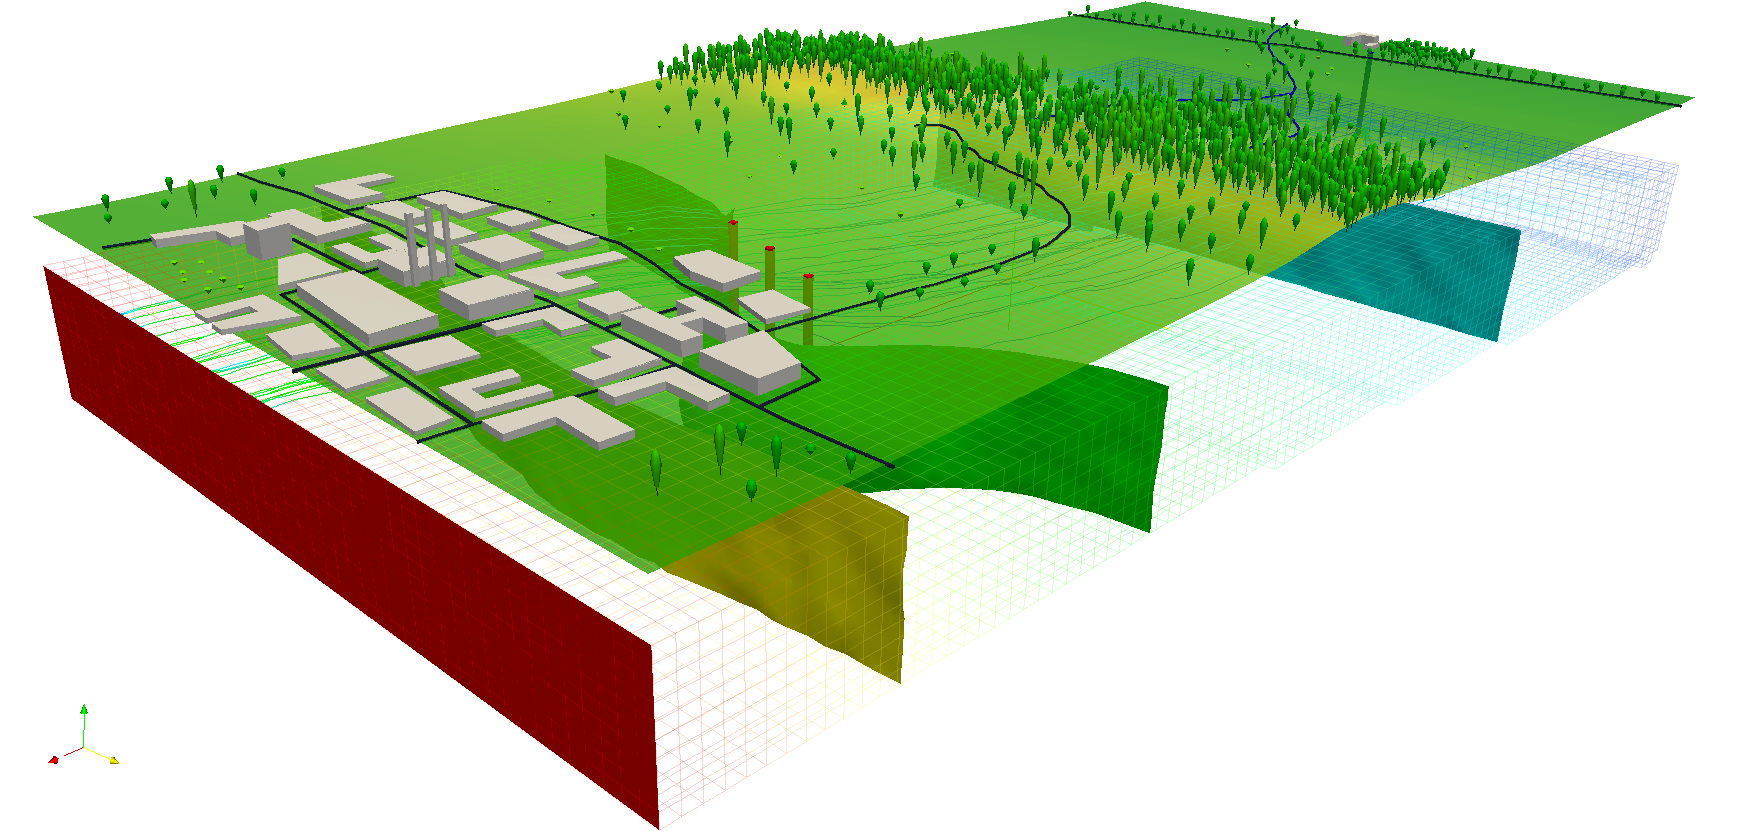
The nviz viewer supports voxel visualization. As an alternative, you can use the external Paraview application, see GRASS and Paraview:

