WxGUI Interactive Scatter Plot Tool: Difference between revisions
No edit summary |
|||
| Line 4: | Line 4: | ||
This tool has been developed within Google Summer of Code 2013, see related [[GRASS GSoC 2013 GRASS GIS Interactive Scatter Plot Tool|wiki page]] for details. | This tool has been developed within Google Summer of Code 2013, see related [[GRASS GSoC 2013 GRASS GIS Interactive Scatter Plot Tool|wiki page]] for details. | ||
=== The Tool | === The Tool Description === | ||
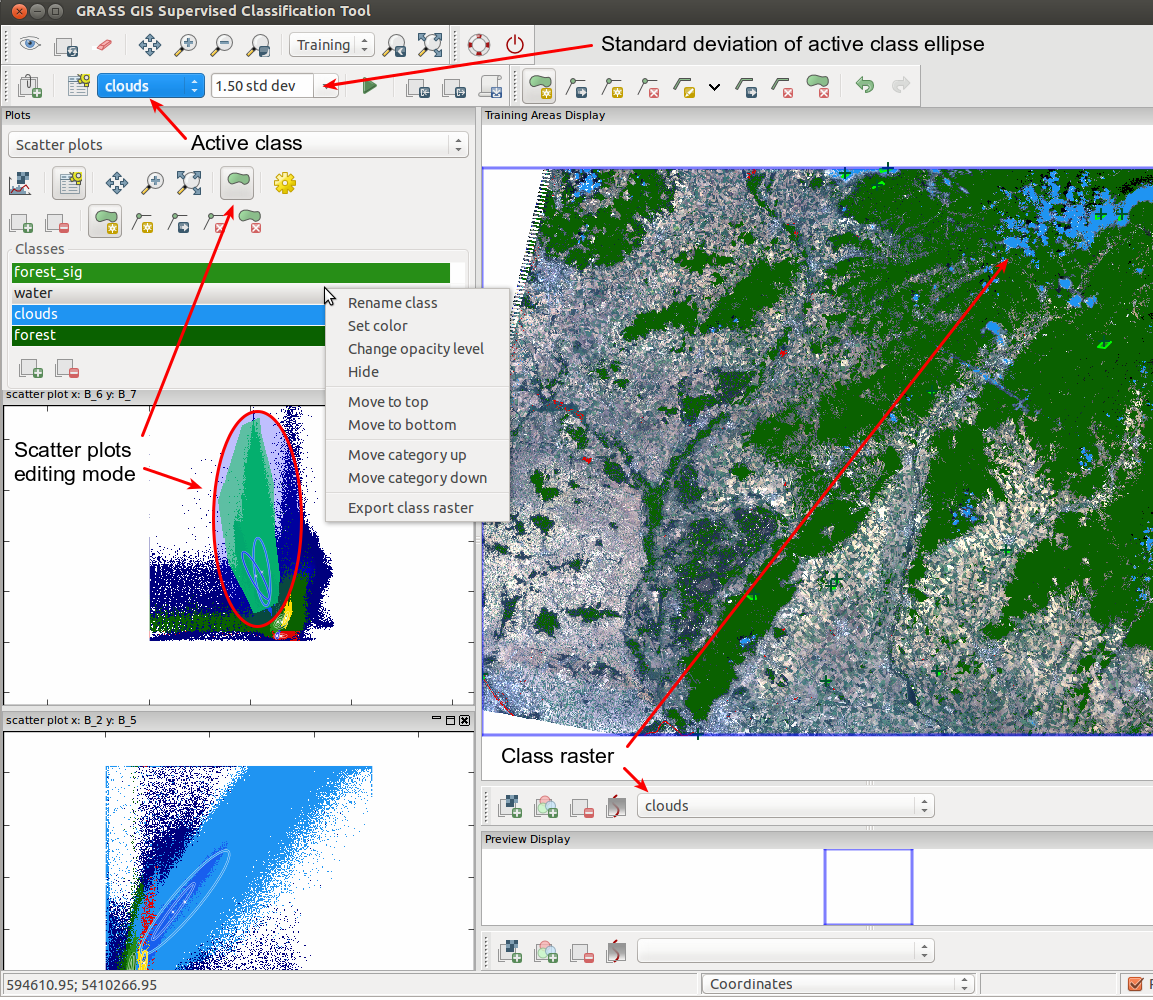
This image describes the tool controls layout: | |||
<center> | <center> | ||
{| | {| | ||
|- | |- | ||
| [[Image:Iclass scatter plot.png|700px|thumb|The | | [[Image:Iclass scatter plot.png|700px|thumb|The tool layout in [[wxGUI Supervised Classification Tool]]]] | ||
|- | |- | ||
|} | |} | ||
</center> | </center> | ||
==== Editing mode ==== | |||
If editing mode is activated (the green polygon tool in toolbar), the areas which were selected in the scatter plots are highlighted. In the image you can see this area for scatter plot of bands B_6 B_7 inside the ellipse. Opacity and color of the selected area can be set in settings. The area corresponds to the active class (in this case clouds). Selected areas are subset of areas, which belongs to the category. | |||
In the editing mode it is possible to select certain area by the polygon, which can be created and edited by tools in editing toolbar. After the area is selected, we can include or exclude it into active category by clicking on the first (plus) respectively second (minus) tool in the editing toolbar. In mapwindow corresponding pixels are shown by the class raster representing selected areas in scatter plots. In this case we can see clouds class raster (blue), forest class raster (green) and water class raster (red). | |||
== Video tutorial == | == Video tutorial == | ||
Revision as of 12:02, 23 September 2013
Note: This wxGUI extension is available only in GRASS 7.
This tool has been developed within Google Summer of Code 2013, see related wiki page for details.
The Tool Description
This image describes the tool controls layout:
 |
Editing mode
If editing mode is activated (the green polygon tool in toolbar), the areas which were selected in the scatter plots are highlighted. In the image you can see this area for scatter plot of bands B_6 B_7 inside the ellipse. Opacity and color of the selected area can be set in settings. The area corresponds to the active class (in this case clouds). Selected areas are subset of areas, which belongs to the category.
In the editing mode it is possible to select certain area by the polygon, which can be created and edited by tools in editing toolbar. After the area is selected, we can include or exclude it into active category by clicking on the first (plus) respectively second (minus) tool in the editing toolbar. In mapwindow corresponding pixels are shown by the class raster representing selected areas in scatter plots. In this case we can see clouds class raster (blue), forest class raster (green) and water class raster (red).
Video tutorial
The tutorial shows quick classification of clouds, forest and water using this tool. Analyzed rasters are from landsat satellite. In analyzed imagery group there was included 8 bit bands 1-7 and first two rasters from i.pca module which was applied on the bands. There are open scatter plot for all landsat bands combinations (total 21) and one scatter plot showing the pca bands (the first one). Region was set to full resolution of the data which has 7221 rows and 8211 cols.