GRASS Debugging: Difference between revisions
(→Using GDB: compile time help) |
(→Using gdb on command line: add a little more) |
||
| Line 21: | Line 21: | ||
=== Using gdb on command line === | === Using gdb on command line === | ||
* | |||
* Running a program inside [http://en.wikipedia.org/wiki/Gdb GDB] works (installation of GDB required :-) | |||
: (e.g. on [http://www.debian.org Debian GNU/Linux]: apt-get install gdb) | : (e.g. on [http://www.debian.org Debian GNU/Linux]: apt-get install gdb) | ||
* Use the exact module name on the command line (at the GRASS prompt) without arguments. Put any command line arguments on the <tt>(gdb)</tt> command line after the word ''run''. | |||
gdb `which v.in.ogr` | gdb `which v.in.ogr` | ||
run "out= | run "out=some_map dsn="PG:dbname=postgis user=me" olayer=postgislayer" | ||
* when it crashes, | |||
* type < | * when it crashes, type "<tt>bt full</tt>" for a full backtrace | ||
* type < | * type "<tt>l</tt>" to list where in the source code it got to | ||
* type "<tt>frame 2</tt>" to switch to the second level function (see the backtrace), there you can again type "<tt>l</tt>" to see where it got up to. | |||
or you can optionally add arguments to gdb directly on the commandline: | or you can optionally add arguments to gdb directly on the commandline: | ||
| Line 33: | Line 38: | ||
''Attaching to child process'': use "attach < | * ''Attaching to child process'': | ||
: use "<tt>attach <pid></tt>" to attach to an existing process (needed for DBMI debugging etc). | |||
=== Using gdb within GNU Emacs === | === Using gdb within GNU Emacs === | ||
Revision as of 08:19, 15 October 2007
The following hints assume to work on a working-copy of the GRASS CVS directory.
Additionally it is good to have set the debbugging symbols during compile-time. Do not strip the libraries or use optimization in the compile. see INSTALL and doc/debugging.txt in the source code for more information.
Setting GRASS-environment variables (numbers: 1-5)
g.gisenv set="DEBUG=1"
- A higher debug level means you see more messages.
- These messages are always present regardless of compiler settings.
Using GDB
Compile Time Setup
To add debugging information into the built binary, add -g to the CFLAGS arguments.
CFLAGS="-ggdb -Wall -Werror-implicit-function-declaration" ./configure ...
Do not use -O for optimization and do not strip the binaries with LDFLAGS="-s".
Using gdb on command line
- Running a program inside GDB works (installation of GDB required :-)
- (e.g. on Debian GNU/Linux: apt-get install gdb)
- Use the exact module name on the command line (at the GRASS prompt) without arguments. Put any command line arguments on the (gdb) command line after the word run.
 gdb `which v.in.ogr`
 run "out=some_map dsn="PG:dbname=postgis user=me" olayer=postgislayer"
- when it crashes, type "bt full" for a full backtrace
- type "l" to list where in the source code it got to
- type "frame 2" to switch to the second level function (see the backtrace), there you can again type "l" to see where it got up to.
or you can optionally add arguments to gdb directly on the commandline:
gdb --args v.in.ogr out=bla dsn="PG:dbname=postgis user=me" olayer=postgislayer
- Attaching to child process:
- use "attach <pid>" to attach to an existing process (needed for DBMI debugging etc).
Using gdb within GNU Emacs
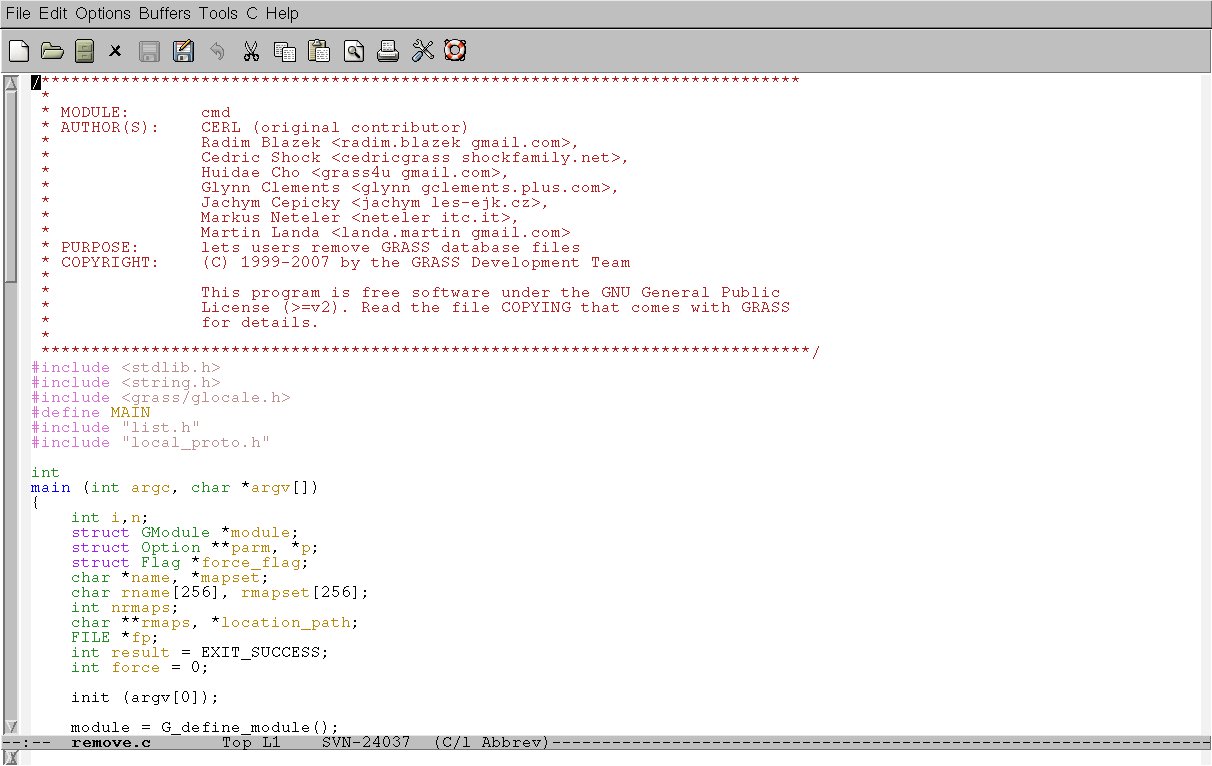
- start GNU Emacs within GRASS session, e.g.
emacs general/manage/cmd/remove.c

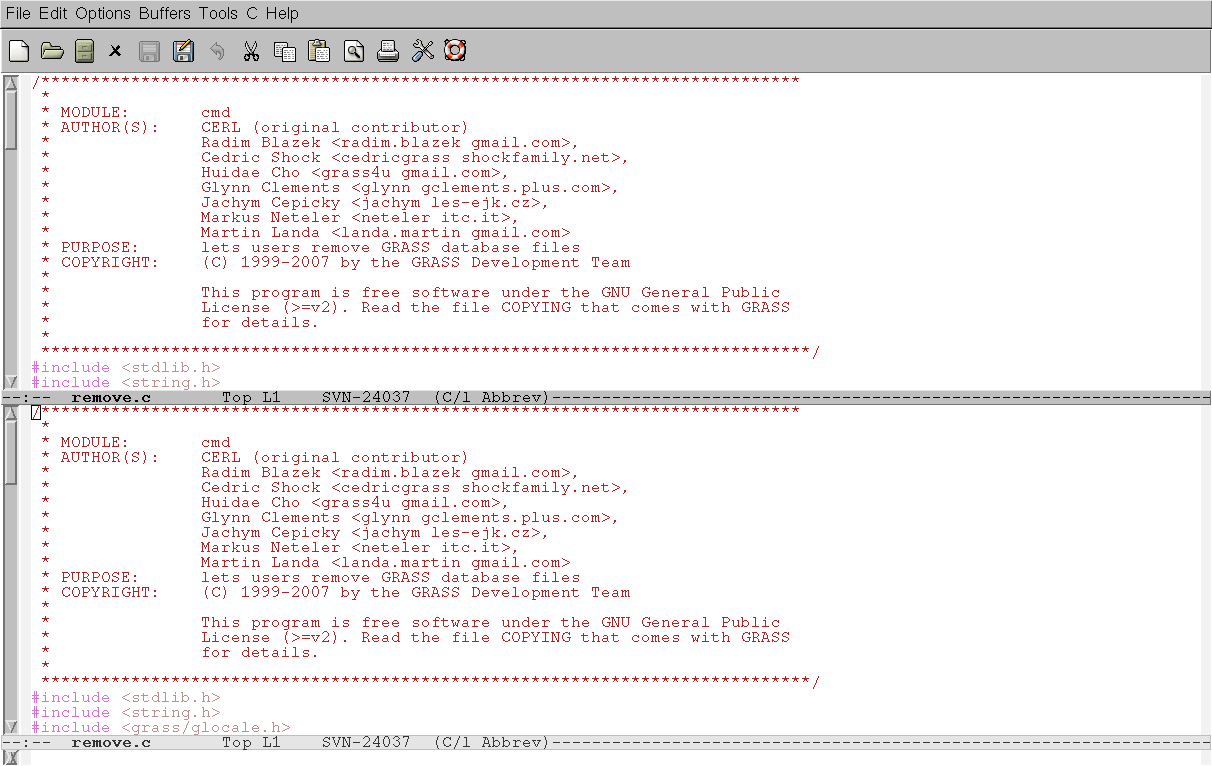
- create second buffer by C-x 2

- move cursor to the second buffer by C-x o, then M-x gdb, Enter
- type module name which you would like to debug, e.g. g.remove, Enter
- now you can use gdb inside GNU Emacs
Using DDD (gdb graphical frontend)
- running a program inside DDD works (installation of ddd and gdb required :-), (on Debian GNU/Linux: apt-get install gdb ddd)
ddd `which v.in.ogr`
http://mpa.itc.it/markus/grass61/debugging/crash_1_small.jpg
- Run (from main menu PROGRAM): "out=bla dsn="PG:dbname=postgis user=me" olayer=postgislayer"
http://mpa.itc.it/markus/grass61/debugging/ddd_1_small.jpg
- run with parameters
- when it crashes, use the UP menu item to trace back
http://mpa.itc.it/markus/grass61/debugging/ddd_2_going_up_small.jpg
- reach the line where it crashed
- set a breakpoint, then run again to stop before the crash
http://mpa.itc.it/markus/grass61/debugging/ddd_3_breakpoint_small.jpg
- right mouse button on variables permits to display them etc.
http://mpa.itc.it/markus/grass61/debugging/ddd_4_displ_vars_small.jpg
- figure out why it crashed there. This requires PATIENCE. But you will nearly save the world if you identify the problem :-)
Using kdbg (gdb graphical frontend)
- kdbg is not unlike DDD, but it's a KDE application.
- Use is similar to DDD.
- Start with (within GRASS):
kdbg `which g.module`
- Fill in command line arguments with menu item Execution->Arguments.
- Open the View->Locals window.
- Click the Run icon (or Execution->Run) and see where it breaks.
- Set pause-points by clicking a red stop-sign to the left of the "+" on a line of the source code. From there you can step through instructions.
- Explore the values of variables in the locals window.
Using strace
- running the command through strace could give you another hint what is going wrong somewhere.
- for example: strace v.in.ogr out=bla dsn="PG:dbname=postgis user=me" olayer=postgislayer
Skimming ChangLog for changes
- use the tool cvs2cl.pl for generating a local changelog-file