WxGUI Map Swipe
Introduction
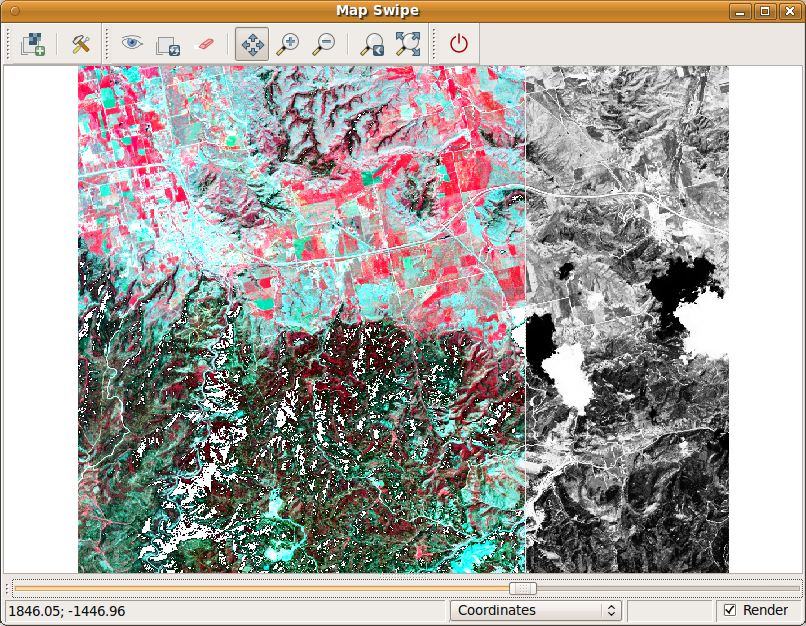
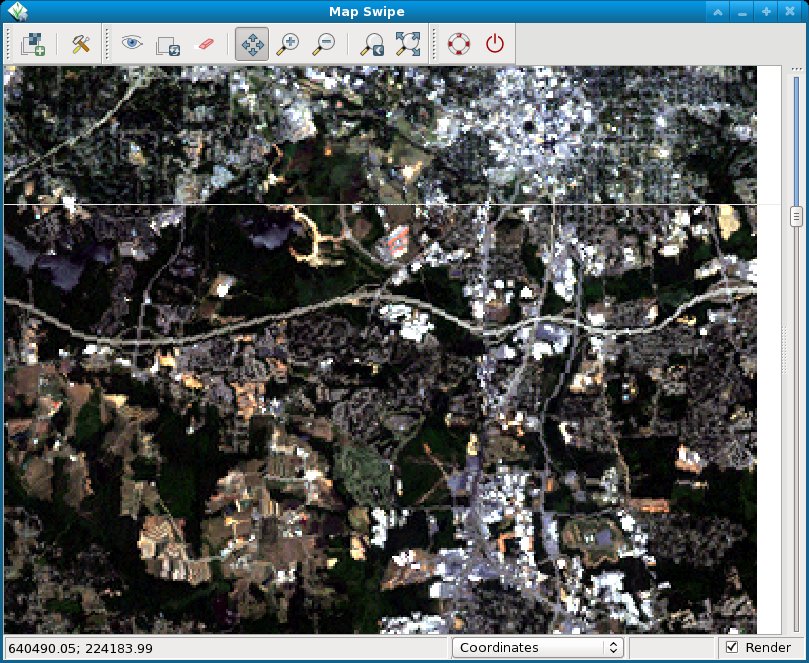
The Map Swipe is a wxGUI application which allows GRASS users to interactively compare two raster maps of the same area by revealing different parts of the raster maps. It is useful e.g. for comparing raster maps from different time periods. See also the manual.
The Map Swipe is available in GRASS 7 from the menu
- File → Map Swipe
and will be backported to GRASS 6 after some testing.

Implemented features:
- orientation of the swipe line can be changed (horizontal or vertical)
- zooming, panning
- maps are loaded automatically when opening Map Swipe with two selected raster maps in Layer Manager
- save display to graphic file
- new 'mirror' mode added - two synchronized maps side by side
- added text label with the name of currently displayed map
Possible enhancements:
- add simplified layer manager for each window so that you can add any maps (raster/vector) - would it be useful?
Paulo van Breugel: rather then splitting the area between the two maps, the same area is shown for both maps. The display of two (or more) maps are synchronized so moving or zooming one map will move / zoom the other map too. This makes it easier to see changes between two maps in detail (similar to MirrorMap plug-in for QGIS). See also ticket 1669.Add option to export the display to graphics file (PNG)- add your idea here
Simple testing with sample data
You can use the North Carolina sample dataset (download) for this test:
# set computation region
g.region rast=lsat7_2002_10 -p

# create RGB composites, first color-balance:
i.landsat.rgb b=lsat5_1987_10@landsat g=lsat5_1987_20@landsat r=lsat5_1987_30@landsat
r.composite b=lsat5_1987_10@landsat g=lsat5_1987_20@landsat r=lsat5_1987_30@landsat out=lsat5_1987.rgb

i.landsat.rgb b=lsat7_2002_10 g=lsat7_2002_20 r=lsat7_2002_30
r.composite b=lsat7_2002_10 g=lsat7_2002_20 r=lsat7_2002_30 out=lsat7_2002.rgb

# .. now load the two RGB composites into the "Map Swipe" tool.

Disaster analysis
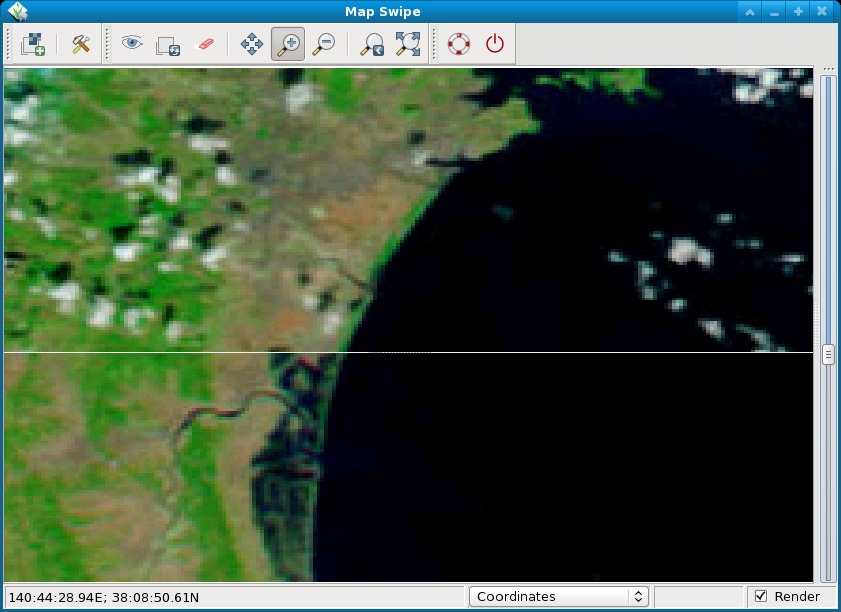
The Map swipe tool is particularly interesting for pre and post disaster analysis of satellite or other images.
Screenshot of map comparison:
