Cartography
GRASS GIS and Cartography
- For graphical examples, see the cartography screenshots page
Using ps.map as cartographic engine
- WxGUI Cartographic Composer is an graphical user interface to ps.map.
- Example showing all standard vareas fill pattern hatches. (Spearfish dataset)
- ps.map example demonstrating a scripted flood risk map
- Thematic maps of Belgium
- Create graph paper ready for printing.
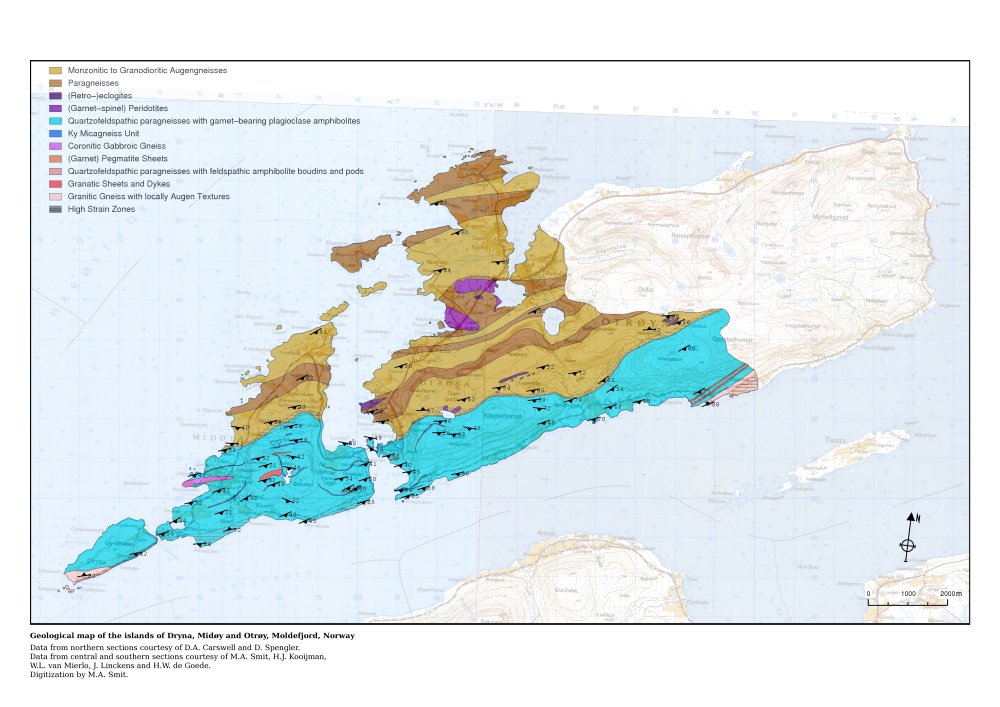
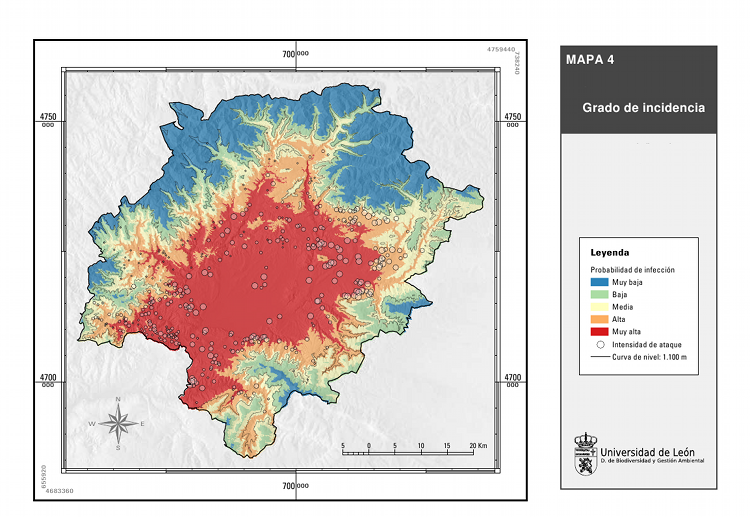
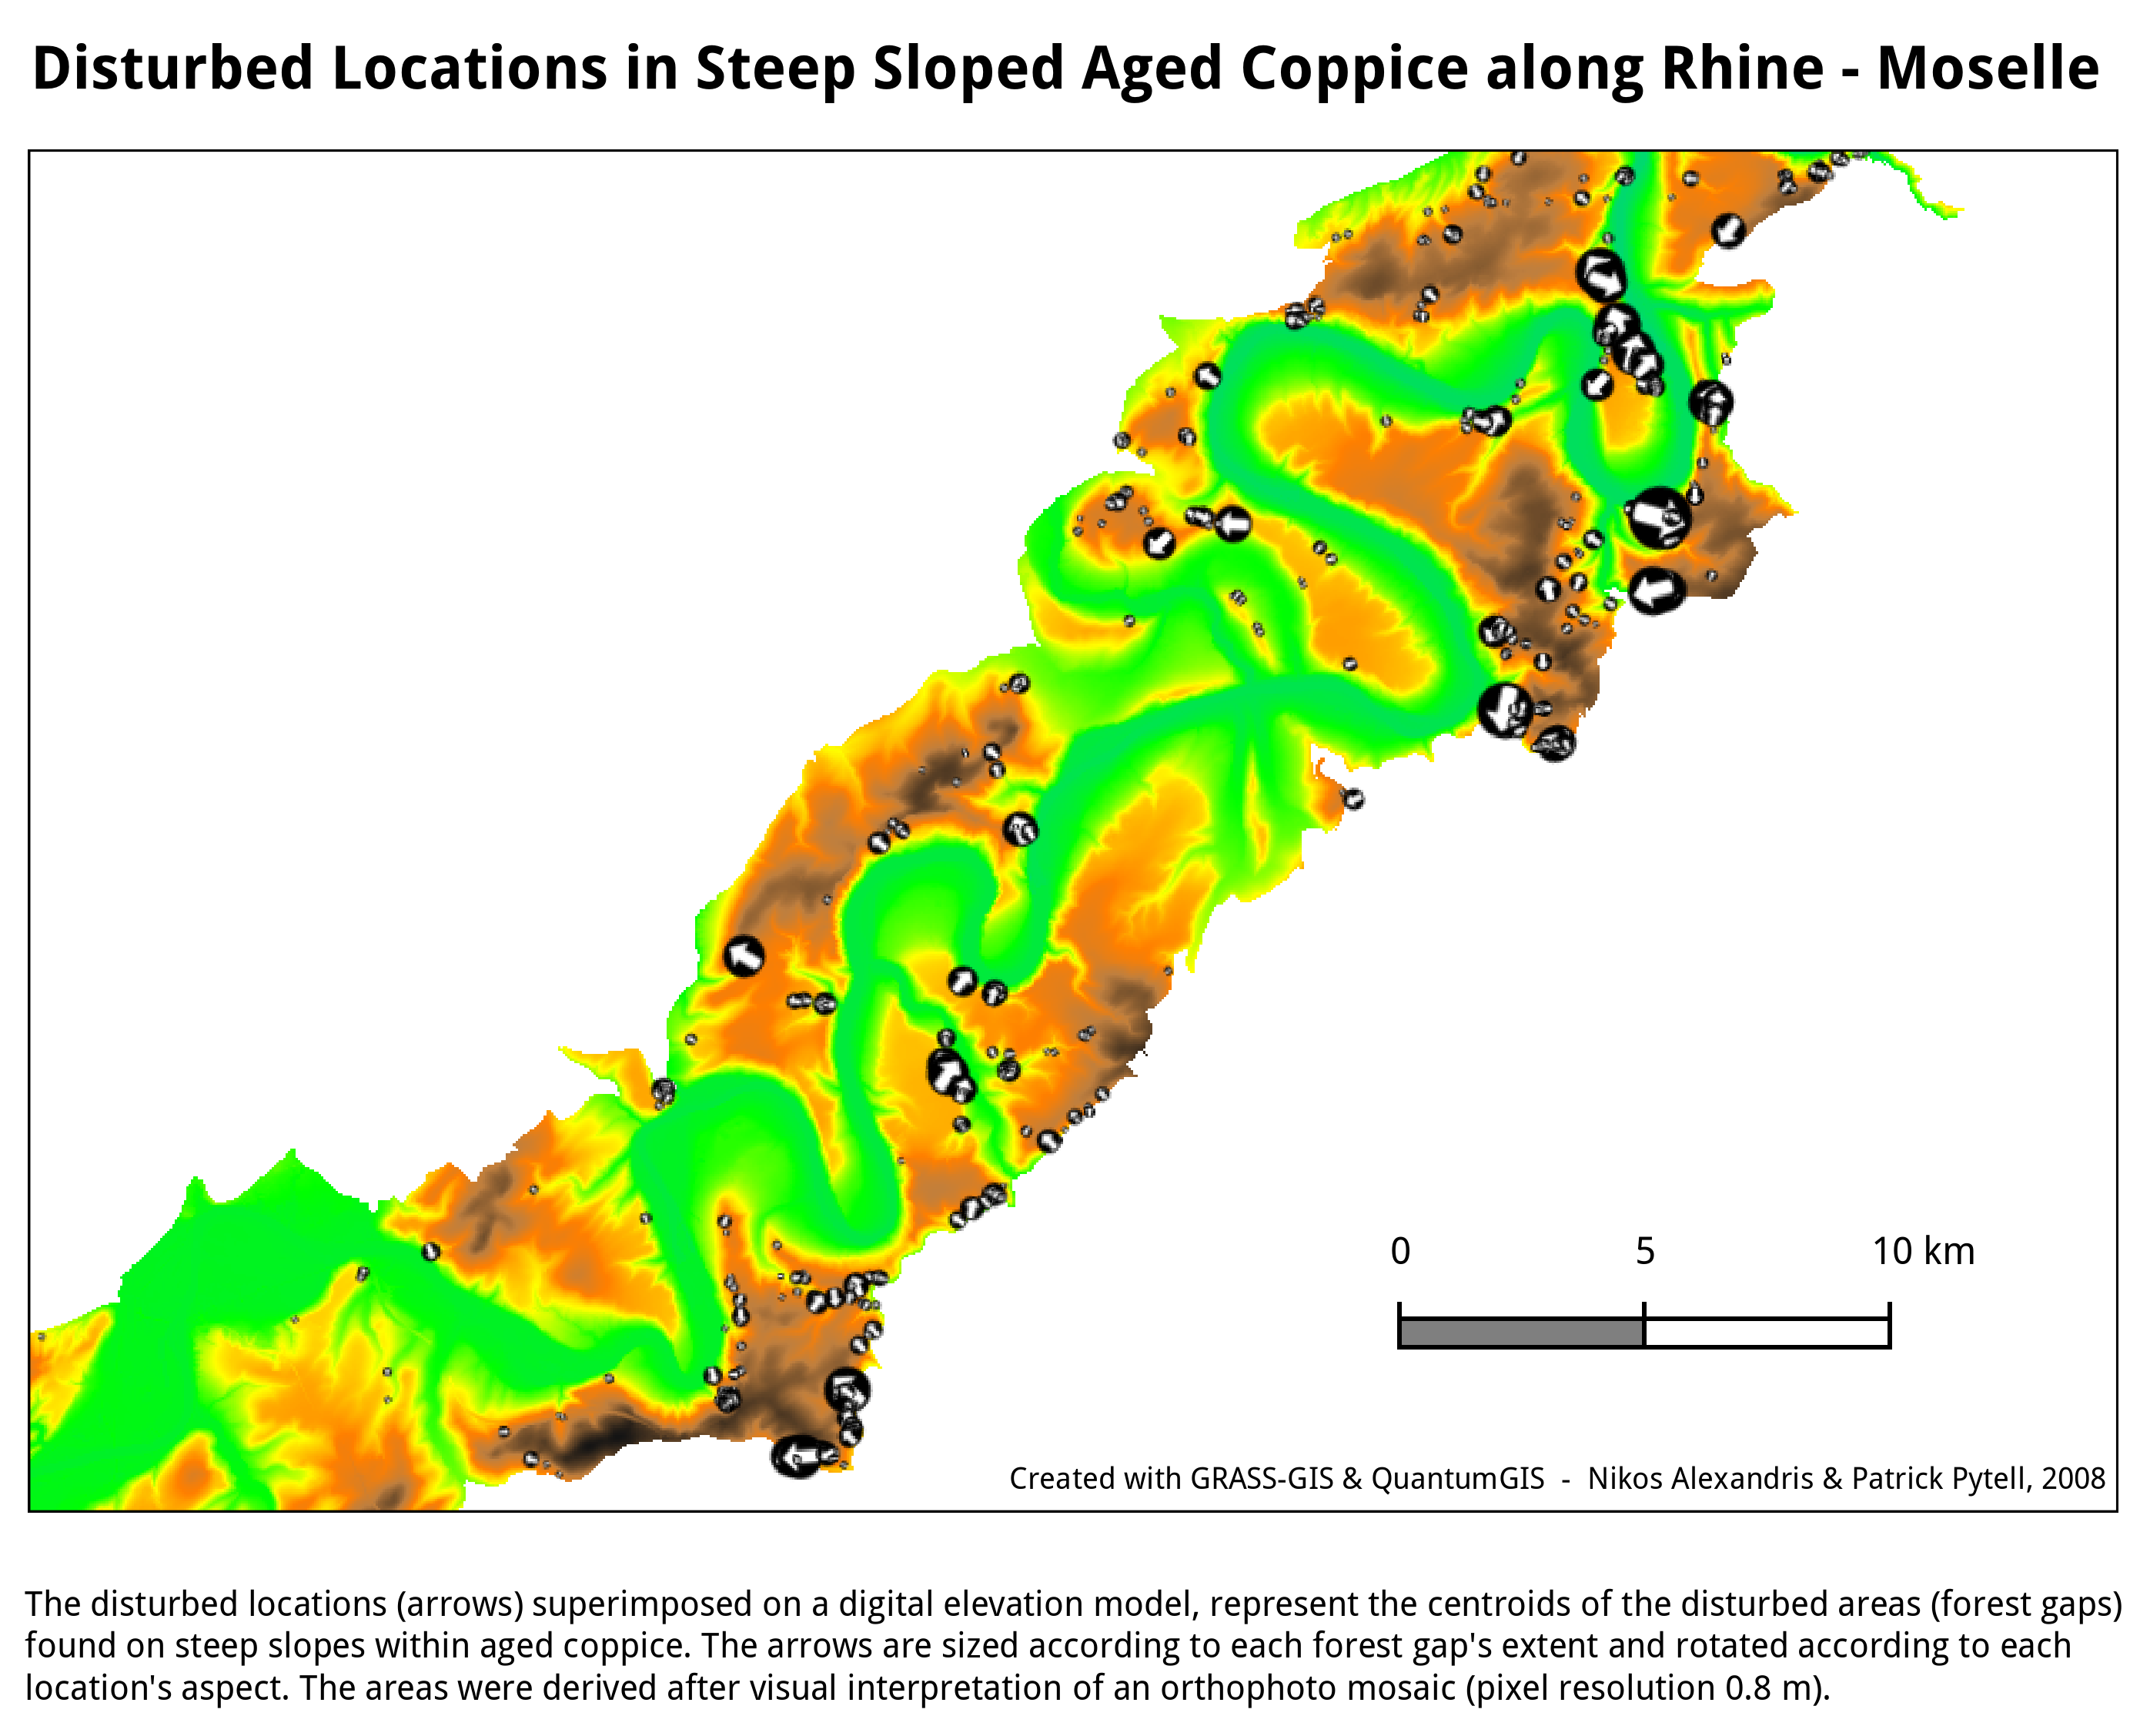
- Some screenshots:
Display monitors
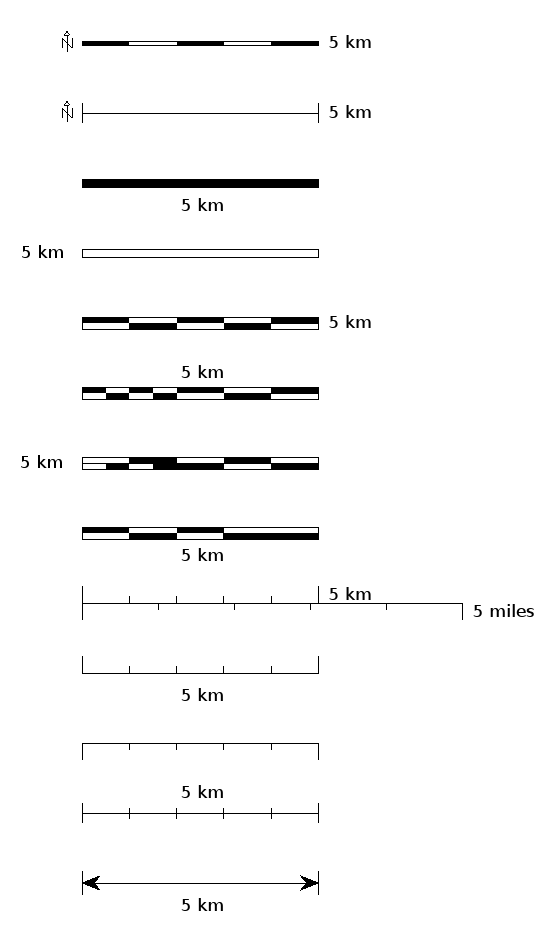
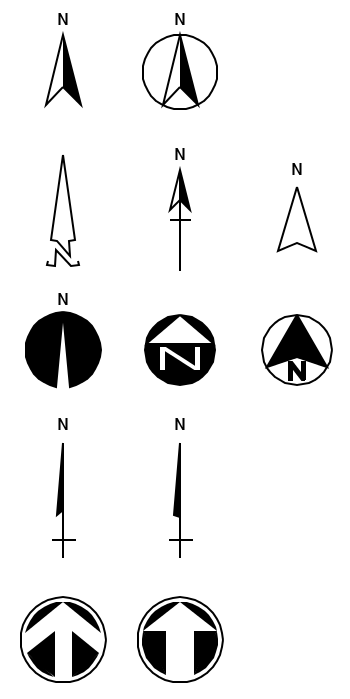
In addition to the hardcopy plots you can make with the ps.map command and its wxGUI Cartographic Composer), in GRASS 7 the d.barscale module can draw a number of styles of bar scale and north arrows directly in the live GIS display monitor; in GRASS 6.4.3+ the north arrows can be drawn on the monitor with the d.graph module or the d.mark addon module and the appropriate symbol (available with true-north rotation and line thickness settings). Style, text placement (or none), distance units, color, font, and fontsize can be controlled. Here are some examples:
Using GMT
See also
- GIS Concepts#Geodesy and Cartography
- Marine Science#Mapping and Cartography
- Getting Real: Reflecting on the New Look of National Park Service Maps - nice paper about realistic cartography
