GRIB
GRIB data
Meteorological data from the WMO is supplied in the GRIB format. See the GDAL GRIB format page
Newer versions of GDAL can read this data (i.e. newer than the 1.5 branch; SVN trunk is best), and it can be imported with r.in.gdal.
It often contains a small number of cells but many many bands (layers).
View band metadata with gdalinfo.
Processing
A mini-tutorial follows.
Data downloaded from http://gribs.ocens.net
wget "http://gribs.ocens.net/TasmanSea.wind.grb.bz2"
The data is in Lat/Lon on a Sphere. It is not quite correct to import into a Lat/Lon WGS84 location, but the resolution is so crude that you might be able to hold your nose and do so anyway.
- There may be a cell-registration bug: (grid vs cell-center convention) cells all offset to the east and south?
Convert latest u,v components of wind to GeoTiff (not really needed, but easier to debug) and import into GRASS:
No-data (NULL) values are flagged as "9999" in the file.
$ gdal_translate -b 1 -a_nodata 9999 TasmanSea.wind.grb  TasmanSea.wind.u_wind_latest.tif
$ gdal_translate -b 2 -a_nodata 9999 TasmanSea.wind.grb  TasmanSea.wind.v_wind_latest.tif

r.in.gdal in=TasmanSea.wind.u_wind_latest.tif \
  out=TasmanSea.wind.u_wind_latest -o
r.in.gdal in=TasmanSea.wind.v_wind_latest.tif \
  out=TasmanSea.wind.v_wind_latest -o
or import into GRASS directly:
r.in.gdal in=TasmanSea.wind.grb band=1 out=TasmanSea.wind.u_wind_latest
r.in.gdal in=TasmanSea.wind.grb band=2 out=TasmanSea.wind.v_wind_latest
r.null TasmanSea.wind.u_wind_latest setnull=9999
r.null TasmanSea.wind.v_wind_latest setnull=9999
Convert U,V velocity component maps into magnitide,direction maps for use with d.rast.arrow:
g.copy TasmanSea.wind.u_wind_latest,U_map
g.copy TasmanSea.wind.v_wind_latest,V_map

g.region rast=TasmanSea.wind.u_wind_latest -p
r.mapcalc 'magnitude = sqrt(U_map^2 + V_map^2)'
r.mapcalc 'direction = atan(U_map, V_map)'
Display:
d.mon x0
r.colors magnitude col=bcyr
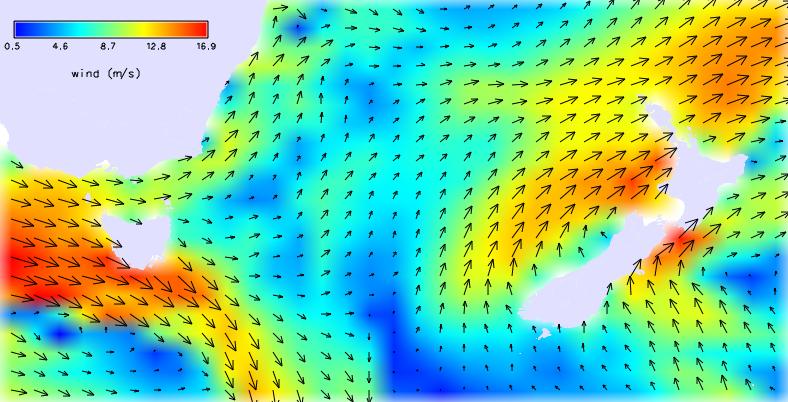
d.rast magnitude
d.vect admin98 type=area fcol=225:225:255 color=none

d.rast.arrow map=direction type=grass  magnitude_map=magnitude \
  grid=none arrow=black

d.legend map="magnitude" at=90.3,94.7,1.8,26.5
echo "wind (m/s)" | d.text color=black at=13.8,80.6 size=3 align=lc
Export to a PNG image using the Cairo driver:
d.out.file -c TasmanSea_winds_latest
Resulting image:
