GRIB
- see also the Meteorology wiki page
GRIB data
Meteorological data from the WMO is supplied in GRIB format. See the GDAL GRIB format page.
- Some data available here:
Newer versions of GDAL can read this data (i.e. newer than the 1.5 branch; SVN trunk is best), and it can be imported with r.in.gdal.
It often contains a small number of cells but many many bands (layers).
View band metadata with gdalinfo.
Processing
A mini-tutorial follows.
The data is in Lat/Lon on a Sphere. It is not quite correct to import into a Lat/Lon WGS84 location, but the resolution is so crude that you might be able to hold your nose and do so anyway.
- There is a cell-registration bug in GDAL: (grid vs cell-center convention) cells are all offset to the east and south by half a cell. You can fix this by hand with r.region
- Currently band metadata is not automatically copied with the import. Add it in manually with "r.support history=".
Convert latest u,v components of wind to GeoTiff (not really needed, but easier to debug) and import into GRASS:
No-data (NULL) values are flagged as "9999" in the file.
$ gdal_translate -b 1 -a_nodata 9999 TasmanSea.wind.grb  TasmanSea.wind.u_wind_latest.tif
$ gdal_translate -b 2 -a_nodata 9999 TasmanSea.wind.grb  TasmanSea.wind.v_wind_latest.tif

r.in.gdal in=TasmanSea.wind.u_wind_latest.tif \
  out=TasmanSea.wind.u_wind_latest -o
r.in.gdal in=TasmanSea.wind.v_wind_latest.tif \
  out=TasmanSea.wind.v_wind_latest -o
or import into GRASS directly:
r.in.gdal in=TasmanSea.wind.grb band=1 out=TasmanSea.wind.u_wind_latest
r.in.gdal in=TasmanSea.wind.grb band=2 out=TasmanSea.wind.v_wind_latest
r.null TasmanSea.wind.u_wind_latest setnull=9999
r.null TasmanSea.wind.v_wind_latest setnull=9999
Convert U,V velocity component maps into magnitide,direction maps for use with d.rast.arrow:
g.copy TasmanSea.wind.u_wind_latest,U_map
g.copy TasmanSea.wind.v_wind_latest,V_map

g.region rast=TasmanSea.wind.u_wind_latest -p
r.mapcalc 'magnitude = sqrt(U_map^2 + V_map^2)'
r.colors magnitude col=bcyr
r.support magnitude units="m/s"
r.mapcalc 'direction = atan(U_map, V_map)'
Convert m/s to knots:
r.mapcalc 'magnitude_kts = magnitude * 3600/1852.0'
r.support magnitude_kts units="knots"
r.colors magnitude_kts col=bcyr
Display:
d.mon x0
r.colors magnitude col=bcyr
d.rast magnitude
d.vect admin98 type=area fcol=225:225:255 color=none

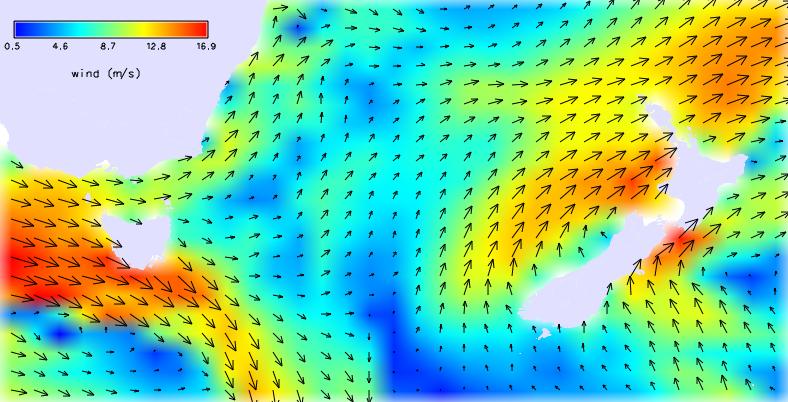
d.rast.arrow map=direction type=grass  magnitude_map=magnitude \
  grid=none arrow=black

d.legend map="magnitude" at=90.3,94.7,1.8,26.5
echo "wind (m/s)" | d.text color=black at=13.8,80.6 size=3 align=lc
Export to a PNG image using the Cairo driver:
d.out.file -c TasmanSea_winds_latest
Resulting image:
Create contours
Create smooth contour lines at 5 knot intervals. First resample to a higher raster resolution with r.resamp.interp so the lines come out smooth.
g.region res=0:15 -p
r.resamp.interp in=magnitude_kts out=magnitude_kts.resamp15m.cube method=bicubic
r.contour in=magnitude_kts.resam15m.cube out=latest_wind_5ms step=5
