Ps.output: Difference between revisions
⚠️Ejtizado (talk | contribs) |
|||
| (171 intermediate revisions by 2 users not shown) | |||
| Line 1: | Line 1: | ||
The '''ps.out''' try to update the standard postscript output of Grass adding new features to design borders, graticules, categorized legends, etc | The '''ps.out''' try to update the standard postscript output of Grass adding new features to design borders, graticules, categorized legends, etc | ||
'''This is in progress and not all features are yet uploaded in ''addons''. ''' | |||
== Command line flags == | == Command line flags == | ||
'''-d ''' Draw a 1x1 cm grid on paper to help the placement of the elements of the map. | '''-d ''': Draw a 1x1 cm grid on paper to help the placement of the elements of the map. | ||
'''-e''' | '''-e''': Create an output file for embedding into another ''ps.out'' map | ||
'''-g''' Use the extended PostScript of Ghostscript (for transparent colors only) | '''-g''': Use the extended PostScript of Ghostscript (for transparent colors only) | ||
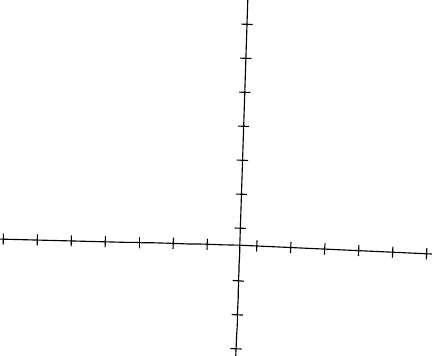
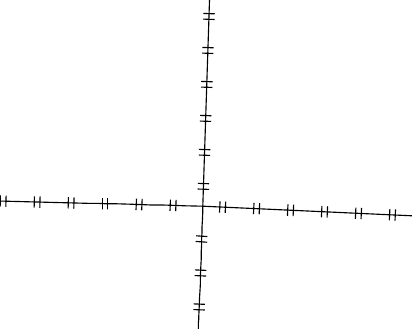
'''-s''' Draw the small digit in the coordinate numbers to lower instead upper | '''-s''': Draw the small digit in the coordinate numbers to lower instead upper position. | ||
<gallery perrow=" | <gallery caption="Sample gallery" widths="100px" heights="100px" perrow="3"> | ||
File:ps_out_grid.png|A4 paper with flag -d | File:ps_out_grid.png|A4 paper with flag -d | ||
File:ps_out_digit_upper.png|coordinate | File:ps_out_digit_upper.png|coordinate | ||
| Line 19: | Line 21: | ||
== Generic Instructions == | == Generic Instructions == | ||
=== | === Parameters === | ||
==== dimen ==== | |||
Define a dimension. Accepted units are: | |||
*; ''unitless'' : e.g. 123. The dimension is the ''number'' by 1/72". | |||
*; inch : e.g. 1.2inch. | |||
*; milimeters : e.g. 2.3mm. | |||
*; centimeters : e.g. 1.4cm. | |||
*; percentage : e.g. 50%.<br>The position is relative to the size and position of the map in the paper being ''0%'' the left or bottom corner. | |||
==== color ==== | |||
Define a color. Accepted formats are: | |||
*; standard GRASS name : e.g. indigo. | |||
*; R<tt>:</tt>G<tt>:</tt>B : e.g. 200:123:90 | |||
=== dimen === | *; user name : e.g. red5.<br>Defined in ''palette'' block | ||
All formats can add '$(0-1)' to define the opacity of the color (alpha channel); e.g., indigo$.75 or 200:120:120$.2 | |||
==== number ==== | |||
==== text ==== | |||
=== Blocks of instructions === | |||
A ''block'' begin with the keywords and finish with keyword ''end'' | |||
==== font ==== | |||
Define the characteristic of a font. | |||
; name (text) : Name of font. | |||
; size (dimen) : Size of font. | |||
; extend (dimen): Expand the width of font. | |||
; color (color) : Color of font. | |||
; outline yes|no : Outline of the font. | |||
==== line ==== | |||
Define the characteristic of a line. | |||
; width (dimen) : Width of line. | |||
; color (color) : Color of line. | |||
; style solid|dashed|dotted|dashdotted|(n1n2...) : Style of line. | |||
; cap butt|round|extended_butt : Cap | |||
; extended type step [voffset height width] : Extended style of line for use mainly with rects.<br> ''type'' = arrow, bar, circled_semi, double_bar, point, rombo, square, triangle, xcross, zigzag (you can use only the first char; and uppercase for filled version).<br> ''step'' = (dimen).<br> ''voffset'' = (dimen).<br> ''height'' = (dimen).<br> ''width'' = (dimen). | |||
; baseline (y|n) : Work with the ''extended'' option to define if the baseline is drawn. | |||
<gallery caption="Sample gallery" widths="200px" heights="200px" perrow="4"> | |||
File:ps.out_linex_A.png|extended arrow 1mm | |||
File:ps.out_linex_B.png|extended bar 1mm | |||
File:ps.out_linex_C.png|extended circled_semi 1mm | |||
File:ps.out_linex_D.png|extended double_bar 1mm | |||
File:ps.out_linex_P.png|extended point 1mm | |||
File:ps.out_linex_R.png|extended rombo 1mm | |||
File:ps.out_linex_S.png|extended square 1mm | |||
File:ps.out_linex_X.png|extended xcros 1mm | |||
</gallery> | |||
==== fill ==== | |||
Define the characteristic of a fill area. | |||
; color (color) : Fill color. | |||
; pat (file) : Fill pattern. | |||
; lwidth (dimen) : Line width of the fill pattern. | |||
; scale (number) : Scale of the fill pattern. | |||
; limit (dimen) : Limit the fill to the border with a width of ''dimen''. | |||
==== frame ==== | |||
Define the characteristic of a frame. | |||
; where (dimen.1 dimen.2) : Position of frame. | |||
; offset (number.1 number.2) : Fine x and y adjust of the position of frame. | |||
; ref right|left|center upper|lower|center : Position is relative to the ''ref''. | |||
; border (dimen) : Width of the border line | |||
; color (color) : Color of the border line. | |||
; fcolor (color) : Fillcolor of the frame. | |||
; rotate (dimen) : <u>todo</u> | |||
==== legend ==== | |||
; lpos (number): Position in legend<br>Codes: -1, no show in legend; 0 automatic position; > 0 horizontal position. | |||
; cols (number.1 [number.2]): Organize legend in ''number.1'' cols with a optional span of ''number.2'' | |||
; interline (dimen): Set partial legend interline | |||
== Map paper == | == Map paper == | ||
| Line 31: | Line 142: | ||
=== paper === | === paper === | ||
Size of paper. | |||
; paper [A0-6|B0-6|Legal|Ledger|Tabloid|Executive|Folio] : Type of paper (default A4). | |||
; color (color) : Paper color. | ; color (color) : Paper color. | ||
| Line 49: | Line 159: | ||
; font : Block ''font''. Set the default font of the map. | ; font : Block ''font''. Set the default font of the map. | ||
; draw : Block ''draw''. | ; draw : Block ''draw''. Free draw as watermarks, before any feature of the map is drawn (see ''draw''). | ||
=== scale === | === scale === | ||
Simple command to define the scale of the map | Scale of the map. | ||
Simple line command to define the scale of the map. The default is adjust map to the paper dimensions. If the remaining dimensions of the paper not permit the scale, ''ps.out'' adjust the scale to a new value that it fit in the paper. | |||
; scale 1:(number) : Scale of map, | ; scale 1<tt>:</tt>(number) : Scale of map.<br>For example, ''scale 1:500000'' to rescale maparea dimensions. | ||
=== maparea === | === maparea === | ||
Define specific dimensions of the map (default defined by command ''scale'') | |||
; maparea : Define characteristics of the map area. | |||
; | ; border (dimen) : Width of the border map.<br>Usefull with ''in'' and ''out'' formats of the ''grid'' and ''geogrid'', ignored in ''iho'' and ''can'' formats. | ||
; | ; color (color) : Border color- | ||
; | ; fcolor (color) : Fillcolor of the map area. | ||
; top (dimen), bottom (dimen) : | ; width (dimen), height (dimen) : Dimensions of the map. | ||
; top (dimen), bottom (dimen) : Position of the top-left corner of the map. | |||
; draw : Block ''draw''.<br>Draw onto the map but before the grid lines, vpoints and vlabels are drawn; i.e. this map elements are drawn over the draw elements. | |||
=== palette === | === palette === | ||
== Common elements | <u>testing</U> | ||
; palette | |||
; light (color text) : | |||
; dark (color text) : | |||
; wheel (number text) : | |||
; monochrome (color number text) : | |||
; complementary (color number text) : | |||
; analogous (color number text) : | |||
; gradient (color.1 color.2 number text) : | |||
; binary (color name) : | |||
; sequential (color.1 color.2 number text) : | |||
; qualitative (number text) : | |||
; diverging (color.1 color.2 number text) : | |||
== Common elements == | |||
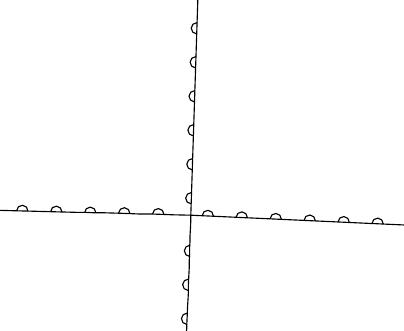
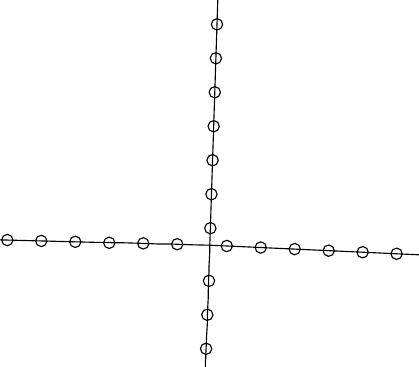
=== grid and geogrid === | === grid and geogrid === | ||
Draw a | Draw a border around the map. | ||
<gallery caption=" | ; grid|geogrid : | ||
File:ps_out_iho.png|iho | |||
File:ps_out_can.png|can | |||
File:ps_out_in.png |in | ; format in|out|+out|can|iho : Type of border (see examples). | ||
File:ps_out_out.png|+out | |||
; major (number|angle) : Block ''line''. Usually, ''number'' is merters and ''angle'' only in ''geogrid''. | |||
; minor (number|angle) : Block ''line''. Usually, ''number'' is merters and ''angle'' only in ''geogrid''. | |||
; subminor (number) : ''number'' of subdivisons of the minor divisions. | |||
; trim (number) : Cut trailing zeros. | |||
; font : Block ''font''. | |||
; fcolor (color) : Color of the border. | |||
; cross (number) : Replace lines by cross | |||
<gallery caption="Sample gallery" widths="200px" heights="150px" perrow="3"> | |||
File:ps_out_iho.png|format iho | |||
File:ps_out_can.png|format can | |||
File:ps_out_in.png |format in | |||
File:ps_out_out.png|format +out | |||
File:ps_out_out1.png|typical map border | File:ps_out_out1.png|typical map border | ||
File:ps_out_out2.png|typical map border with ''subminor 5'' and ''fcolor blue'' | File:ps_out_out2.png|typical map border with ''subminor 5'' and ''fcolor blue'' | ||
| Line 98: | Line 261: | ||
=== scalebar === | === scalebar === | ||
Maximun 5 scalebars in each map. | Set a scalebar on the map.<br>Maximun 5 scalebars in each map. | ||
; scalebar I|l|s|S|f|F : Define the type of scalebar (I: inner, l: line, s/S: simple, f/F: fill). | |||
; length (number) : Length of the scale. | |||
; units meters|m|kilometers|km|feet|ft|miles|mil|nautical_miles|nm ([text]) : Unit of the length and ''text' to label the units. | |||
; major (number.1 [number.2]) : Define the ''number.1'' of subdivisions and each ''number.2'' set the labels. | |||
; minor (number.1 [number.2]) : Define the ''number.1'' of subdivisions and each ''number.2'' set the labels. | |||
; frame : Block ''frame'' | |||
; font : Block ''font'' | |||
; fcolor (color) : Fillcolor. | |||
; height (dimen) : Height of the bar or ticks. | |||
; zero yes|no : Set position relative to zero value of the scalebar. | |||
<gallery caption="Scalerbar styles" widths="200px" heights="50px" perrow="3"> | <gallery caption="Scalerbar styles" widths="200px" heights="50px" perrow="3"> | ||
File:ps_out_scalebar_s.png|s | File:ps_out_scalebar_s.png|scalebar s | ||
File:ps_out_scalebar_S.png|S | File:ps_out_scalebar_S.png|scalebar S | ||
File:ps_out_scalebar_I.png|I (uppercase i) | File:ps_out_scalebar_I.png|scalebar I (uppercase i) | ||
File:ps_out_scalebar_f.png|f | File:ps_out_scalebar_f.png|scalebar f | ||
File:ps_out_scalebar_F.png|F | File:ps_out_scalebar_F.png|scalebar F | ||
File:Ps.out_scalebar_l.png|scalebar l (downcase L) | |||
File:ps_out_scalebar_3.png|Multiple scalebars zero centered with ''zero yes'' | File:ps_out_scalebar_3.png|Multiple scalebars zero centered with ''zero yes'' | ||
</gallery> | </gallery> | ||
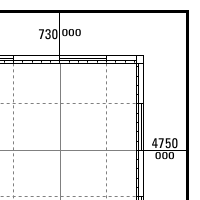
=== note === | === note === | ||
Write special text or free text on any place of the paper with frame (also ''draw'' permit write free-text in paper). | |||
Maximun 20 notes by map. | Maximun 20 notes by map. | ||
<gallery caption="Note keywords and free text" widths=" | |||
File:ps_out_note_ml.png | | ; note <tt>:</tt>file|<tt>:</tt>maplimits|<tt>:</tt>dimen|<tt>:</tt>scale (text)|(text) : Type of note and text to show.<br>When free text, use '|' to break lines and '.' as first character to center line. | ||
File:ps_out_note_dimen.png| | |||
File:ps_out_note_scale.png | |||
File:ps_out_note_free.png | ; text (text) : Another roption to enter the same as inline note text; | ||
File:ps_out_note_freec.png | |||
File:ps_out_note_scaler.png | ; frame : Block ''frame''. | ||
; font : Block ''font''. | |||
; width (dimen) : Width of note. | |||
; angle (number) : ''number'' of degrees to rotate (do not work fine). | |||
<gallery caption="Note keywords and free text" widths="200px" heights="100px" perrow="3"> | |||
File:ps_out_note_ml.png |note :maplimits<br/> frame [...]<br/>end | |||
File:ps_out_note_dimen.png|note :dimen<br/> frame [...]<br/>end | |||
File:ps_out_note_scale.png|note :scale<br/> frame [...]<br/>end | |||
File:ps_out_note_free.png|note free text|in multiple lines<br/> frame [...]<br/>end | |||
File:ps_out_note_freec.png|note .free text|.in multiple [...]<br/> frame [...]<br/>end | |||
File:ps_out_note_scaler.png|note :scale scale<br/> frame [...]<br> angle 90<br/>end | |||
</gallery> | </gallery> | ||
=== draw === | === draw === | ||
Simple script language to draw predefined postscript code. | |||
; draw [none|paper|maparea|free] : | |||
''paper'': before any map feature is drawn (equivalent to place inside ''paper'' block); <br> | |||
''maparea'' before the last elements of the map (equivalent to place inside ''mapare'' block) ; <br> | |||
''none'': draw over all elements of the map but only in the map area; and <br> | |||
''free'': after all map features are drawn in any place of the paper; and ''none''. | |||
<gallery caption="Sample gallery" widths=" | |||
File:ps_out_north1.png |north 700000 4700000 | ; --- : | ||
<gallery caption="Sample gallery" widths="200px" heights="100px" perrow="3"> | |||
File:ps_out_north1.png |<source lang="text">north 700000 4700000</source> | |||
File:ps_out_north2.png |north 5cm 16.5cm - | File:ps_out_north2.png |north 5cm 16.5cm - | ||
File:ps_out_maplimits.png|maplimits | File:ps_out_maplimits.png|maplimits | ||
| Line 143: | Line 351: | ||
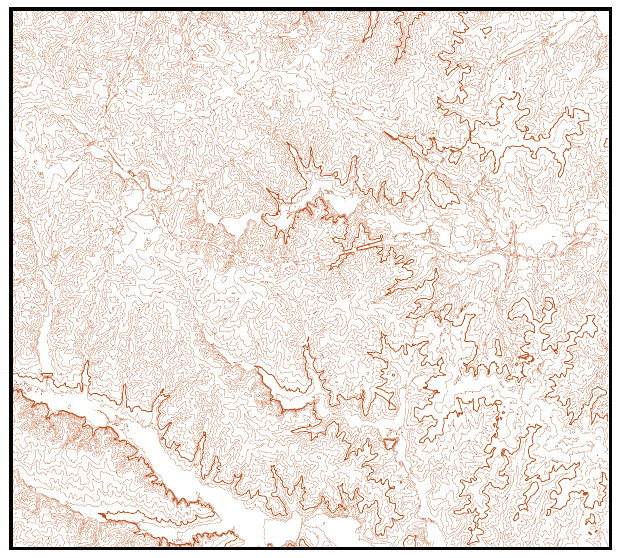
=== raster === | === raster === | ||
Draw one or two raster maps on the maparea. | |||
; raster (raster|raster.1 raster.2|raster.R raster.G raster.B|<tt>:</tt>group) : The ''raster'' value is the raster mapname, two raster maps ''raster.1'' or color and ''raster.2'' or shade to draw as relief map, three maps ''raster.R'', ''raster.G'' and ''raster.B'' to draw as RGB, or a groupname (leader by ':') with tree RGB maps. | |||
''<u>The next commands are optionals</u>'': | |||
</ | |||
; hillshade yes|no : Use when draw a shaded raster to draw hillshade.<br>See http://grass.osgeo.org/wiki/Ps.out_Making_maps#The_second_output | |||
; grey yes|no : Store and draw the rasters in grey scale (small size of file).<br>The conversion follows the NTSC video standard. | |||
; | ; maskcell (raster.1 [raster.2]) : Set the ''raster.1'' map to use as mask (independent of the mask set in GRASS with [[r.mask]]) and, optionally, the ''raster.2'' map uses as background.<br>The background ''raster.2'' is painted in grey scale (NTSC) and tinted with ''maskcolor''. | ||
; | ; maskcolor (color|none) : Set the ''color'' of the mask area.<br>If a raster map as background is set then it's drawn with a scale white-maskcolor. | ||
; | ; outline : Block ''line''. Outline of categories. | ||
; | ; setcolor null|default|(number) (color) : Replace the color of the cat ''number'' area with a new color.<br>Multiple ''setcolor'' are possibles. | ||
; | <gallery caption="Sample gallery" widths="200px" heights="200px" perrow="3"> | ||
File:ps_out_raster1.png|<div>raster elevation<br>end</div> | |||
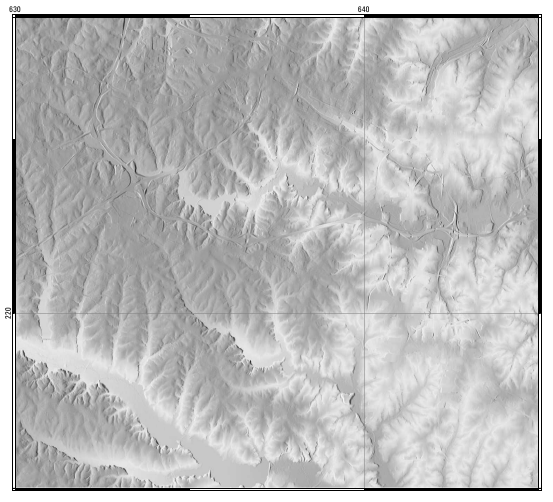
File:ps_out_raster2.png|<div>raster elevation elevation_shade<br>end</div> | |||
File:ps_out_raster3.png|<div>raster lsat5.5 lsat5.4 lsat5.3<br>end</div> | |||
File:ps_out_raster_mask1.png|<div>raster elevation<br> maskcell urban_neg<br> maskcolor indigo<br>end</div> | |||
File:ps_out_raster_mask2.png|<div>raster elevation elevation_shade<br> maskcell urban_neg elevation<br>end</div> | |||
File:ps_out_raster_mask3.png|<div>raster lsat5.5 lsat5.4 lsat5.3<br> maskcell urban_neg elevation<br> maskcolor indigo<br>end</div> | |||
File:ps_out_raster_outline.png|<div>raster basin_50K elevation_shade<br> maskcell basin_50K<br> outline<br> width .2mm<br/> end<br/>end</div> | |||
File:ps_out_raster_setcolor.png|<div>raster basin_50K elevation_shade<br> maskcell basin_50K<br> maskcolor white<br> setcolor 37 magenta<br>end</div> | |||
File:ps_out_raster_grey.png|<div>raster elevation<br> grey yes<br>end</div> | |||
</gallery> | |||
== Vector maps == | == Vector maps == | ||
All vector map accept optionally the following commands: | |||
; layer (number) : Layer number used with cats/where option. | ; layer (number) : Layer number used with cats/where option. | ||
| Line 236: | Line 393: | ||
; cats (n1,n2,...) : List of ''cat''s to show. | ; cats (n1,n2,...) : List of ''cat''s to show. | ||
; where ( | ; where (text) : Argument of the SQL where clausule to filter the areas to show. | ||
; masked yes|no : Masked or not by raster mask (default ''no''). | ; masked yes|no : Masked or not by raster mask (default ''no''). | ||
; label (text) : For description or title in vlegend. | ; label (text) : For description or title in ''vlegend''. | ||
; legend [(number)]: Position in legend (-1, no legend) or enter in a block ''legend''. | |||
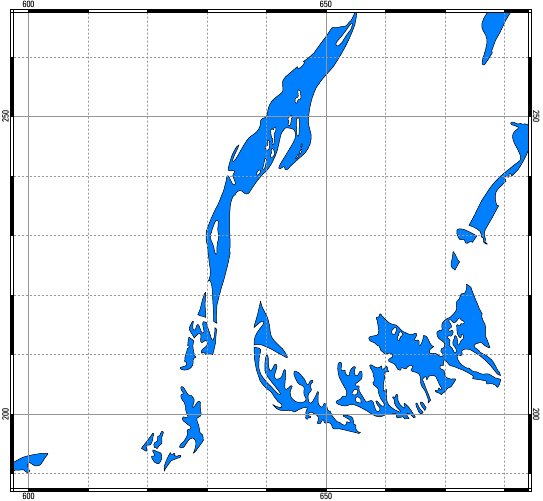
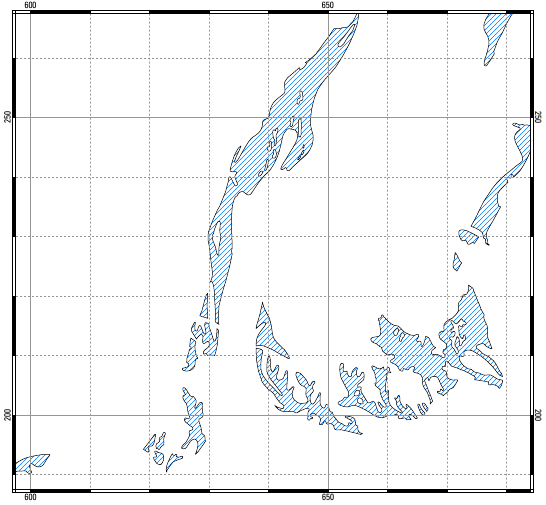
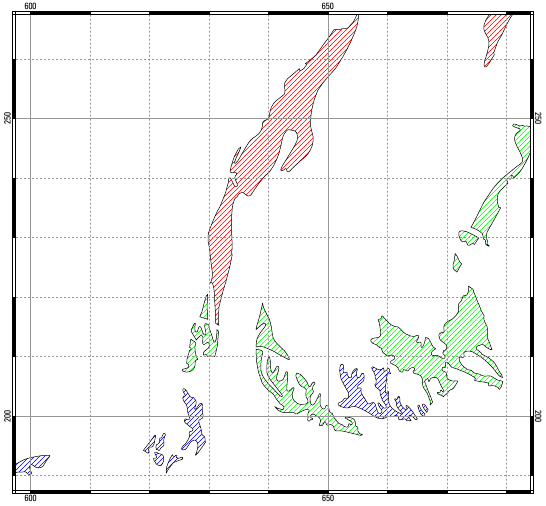
=== vareas === | === vareas === | ||
Draw areas on the map. | Draw areas on the map.<br> | ||
The areas always are drawn first, on the bottom of other type of maps. | The areas always are drawn first, on the bottom of other type of maps. | ||
; vareas (vector) : ''vector'' is a vector of areas, except when ''lwidth'' is different to zero that ''vector'' is a vector of lines. | ; vareas (vector) : ''vector'' is a vector of areas, except when ''lwidth'' is different to zero that ''vector'' is a vector of lines. | ||
; line : | ''<u>The next commands are optionals</u>:'' | ||
; type area|line : Default ''area''. | |||
; | ; line : Block ''line''. Style of the boundary. | ||
; | ; fill : Block ''fill''. Style of the area. | ||
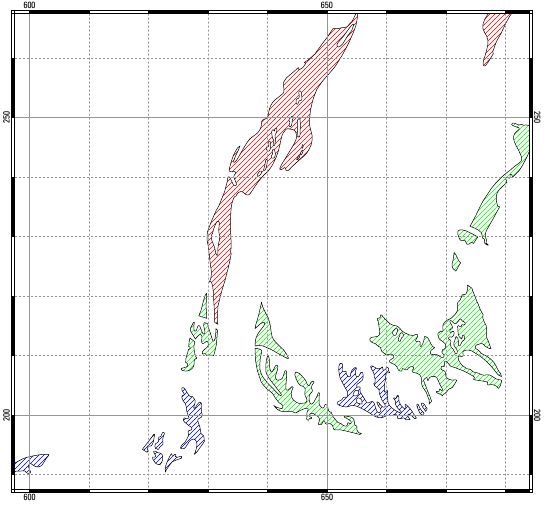
; | ; rgbcol (column.1 [column.2]) : Dynamic fill color in a ''column.1'' of the database, or conditional color from rules applied to ''column.2'' of the database. | ||
; | ; setnorule (text) : Text label when default conditions. | ||
; | ; setrule (n1-n2[<tt>:</tt>color][|dimen] text) : Make a item of a sublegend with label the ''text'' and title the text of the ''label''.<br>The fillcolor of the areas is set to ''color'' and the line width is set to ''dimen'' when ''column.2'' >= n1 and ''column.2'' < n2 (''column.2'' from ''rgbcol''). | ||
''<u>Special commands</u>:'' | |||
; | ; island yes|no : Draw island as normal areas (fill as normal area then hide it). | ||
; mirror (dimen [number]) : The line is drawn as an area with a copy of the line placed with polar coordinates: ''dimen' and ''angle''. | |||
<gallery caption="vareas: sample gallery" widths="200px" heights="200px" perrow="3"> | |||
File:ps_out_vareas0.png|fill<br> color indigo | |||
File:ps_out_vareas4.png|fill<br> color indigo<br> limit 3mm | |||
File:ps_out_vareas3.png|fill<br> pat patterns/diag_up.eps | |||
File:ps_out_vareas1.png|rgbcol - cat<br>setrule 0-500:red A<br/>setrule 500-1000:green B<br/>setrule 1000-5000:blue C | |||
File:ps_out_vareas2.png|island no | |||
File:ps_out_vareas5.png|vareas roadsmajor<br> cat 24,28,32,38,53<br> mirror 5 90<br>[and fill with pat cruz.eps] | |||
</gallery> | |||
< | |||
|< | |||
</ | |||
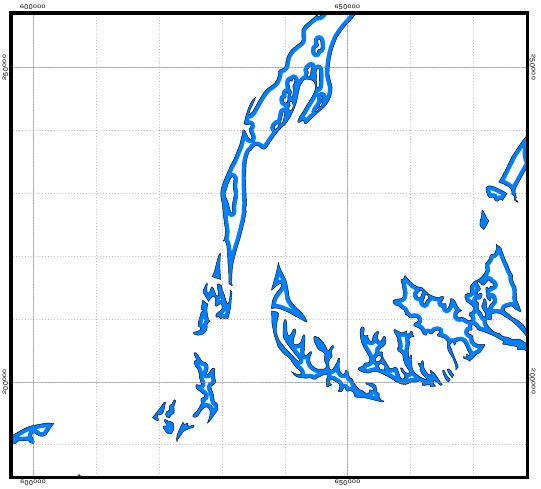
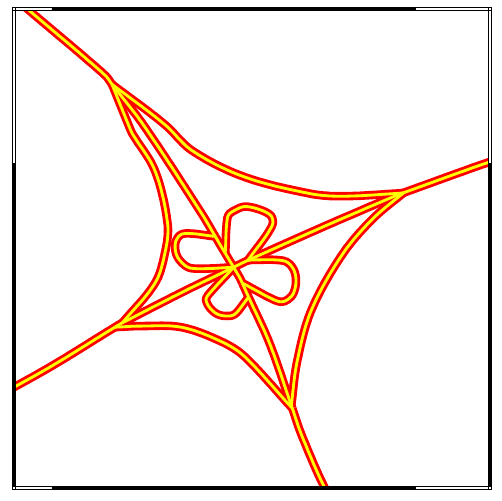
=== vlines === | === vlines === | ||
Draw lines on the map. | Draw lines on the map.<br>The areas always are drawn second, after ''vareas'' and before ''vpoints''. | ||
The areas always are drawn second, after ''vareas'' and before ''vpoints''. | |||
; vlines (vector) : | ; vlines (vector) : | ||
'' | ''vector'' is a vector of lines, except if ''type'' is boundary that ''vector'' is a vector of areas. | ||
'' | ''<u>Optional commands</u>:'' | ||
; type boundary | ; type line|boundary : Draw boundaries of a vector of areas or lines of a vector of lines (default ''line''). | ||
; line : Block ''line''. Normal line. | ; line : Block ''line''. Normal line. | ||
; hline : Block ''line''. Highlight line. | ; hline : Block ''line''. Highlight line. | ||
| Line 338: | Line 461: | ||
; offset (dimen) : Works with ''hline'' to offset from the center of ''line''. | ; offset (dimen) : Works with ''hline'' to offset from the center of ''line''. | ||
; | ; rgbcol (column.1 [column.2]) : Dynamic line color in a ''column.1'' of the database, or conditional color from rules applied to ''column.2'' of the database. | ||
; setnorule (text) : Label in legend when default values and ''setcolor'' rules. | |||
; setrule (n1-n2[<tt>:</tt>color] text) : Make a item of a sublegend with ''text'' as label and title the text of the ''label''. Also, the color of the normal line with column >= n1 and column < n2 (column from rgbcol), is set to ''color''. | |||
<gallery caption="vlines: sample gallery" widths="200px" heights="200px" perrow="3"> | |||
|< | File:ps_out_vlines0.png|hline | ||
File:ps_out_vlines1.png|line 0.05mm<br>setrule 100:brown|.25mm | |||
</gallery> | |||
</ | |||
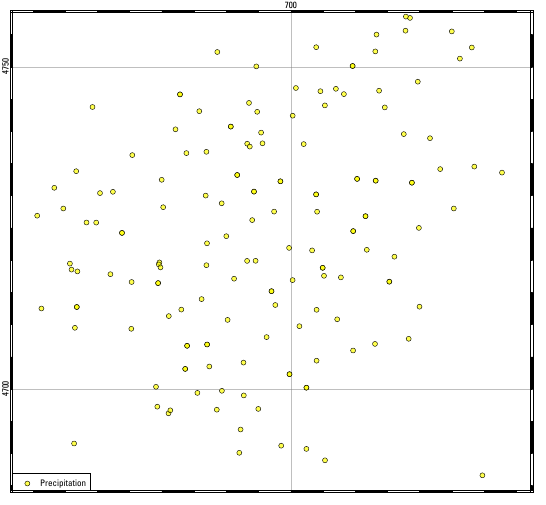
=== vpoints === | === vpoints === | ||
Draw points on the map. The points always are drawn last, after ''vareas'' and ''vlines''. | Draw points on the map.<br>The points always are drawn last, after ''vareas'' and ''vlines''. | ||
; vpoints (vector) : | ; vpoints (vector) : | ||
''vector'' is a vector of points, except when ''type'' is ''centroid'' or ''boundary'' that it is a vector of areas, or when ''type'' is ''line'' that it is a vector of lines. | ''vector'' is a vector of points, except when '''type''' is ''centroid'' or ''boundary'' that it is a vector of areas, or when '''type''' is ''line'' that it is a vector of lines. | ||
''<u>The next commands are optionals</u>'': | ''<u>The next commands are optionals</u>'': | ||
| Line 372: | Line 486: | ||
; type centroid|line|boundary|point : Type of draw (default ''point''). | ; type centroid|line|boundary|point : Type of draw (default ''point''). | ||
; symbol (epsfile) : Symbol to use. | ; symbol (epsfile) : Symbol to use (default: basic/circle). | ||
; line : Block 'line'. Type of line in the symbol. | ; line : Block ''line''. Type of line in the symbol. | ||
; fcolor (color): Static fillcolor of the symbol. | ; fcolor (color): Static fillcolor of the symbol. | ||
; | ; offset (dimen) : Offset of the symbol. | ||
; | ; rotate (number|column) : Angle to rotate the symbol, static ''number'' or dynamic in a ''column'' of the database. | ||
; | ; size (number|column [number]) : Size of the symbol take from ''number'' or from a ''column'' of the database. In the last option, there is a optional ''number'' to define the static size of the symbol in the legend when the size of symbols are dynamic. | ||
; scale (dimen.1 [dimen.2]) : Rescale the size of the symbol by the ''dimen.1'' and, optionally, add a ''dimen.2''. i.e., ''resize = dimen.1 * size + dimen.2''. | |||
; setsize (n1-n2[<tt>:</tt>size] text) : Variable size of symbols from data in ''column'' of database set in ''size''. | |||
''<u>Special commands when type is line</u>'': | |||
; dist (dimen) : Define the distance in paper between symbol over the line. | |||
; cline : Block ''line''. Type of line that connect symbols. | |||
<gallery caption="vpoints: sample gallery" widths="150px" heights="150px" perrow="4"> | |||
File:ps_out_vpoints0.png|''Points with same size ...''<br> size 5 | |||
File:ps_out_vpoints1.png|''Points with dynamic size ...''<br> size PT 5<br> scale 0.01 2 | |||
File:ps_out_vpoints2.png|''Points with conditional size ...''<br> size PT<br> setrule 200-1000:3 < 1000<br> setrule 1000-2500:9 > 1000 | |||
File:ps_out_vpoints3.png|''Points on line ...''<br> type line<br> dist 1cm | |||
</gallery> | |||
=== vlabels === | |||
<u>in progress</u> | |||
; vlabels none|(vector) : | |||
; font : | |||
; labelcol (column) : | |||
; decimals (number) : | |||
; circled yes|no : | |||
; | ; setrule (n1-n2 text) | ||
; | <gallery caption="Sample gallery" widths="200px" heights="200px" perrow="3"> | ||
File:ps_out_vlabels0.png|vpoints firestations<br/n> [...]<br/n>end<br/>vlabels firestations<br/n> labelcol PUMPERS<br/n> font<br/n> name Univers-Bold<br/n> size 10<br/n> color yellow<br/n> end<br/n>end | |||
</gallery> | |||
== Legend of the maps == | == Legend of the maps == | ||
| Line 394: | Line 543: | ||
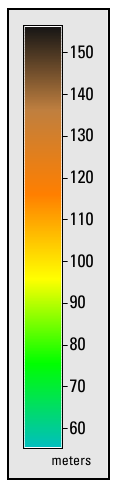
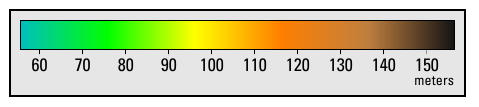
=== rlegend === | === rlegend === | ||
Legend of the raster map.<br>The units ''meters'' in the gradient legend is set with {{cmd|r.support}}. | |||
; rlegend [text] : Text is the title of the legend. | ; rlegend [text] : Text is the title of the legend. | ||
; raster ( | ; raster (raster) : the ''raster'' map to take the data of legend. | ||
''<u>The next commads are optionals</U>'': | ''<u>The next commads are optionals</U>'': | ||
| Line 409: | Line 559: | ||
; frame : Block ''frame''. | ; frame : Block ''frame''. | ||
; swidth (dimen) : Width of the color | ; swidth (dimen) : Width of the symbol area. | ||
''<u>For category legends</u>'' | |||
; cols (number) [(number)] : Number of columns with symbols and separation between columns (default ''1''). | |||
; interline (dimen) : Vertical space between symbols (o to join symbols) | |||
; nodata yes|no : Remove category ''no data''. | |||
; order (n1,n2,...) : To reorder the items. | |||
''<u>For gradient legends</u>'' | |||
; height (dimen), width (dimen) : Dimension of the frame with the legend. | |||
; vertical yes|no : Orientation of the gradient legend (default ''no''). | |||
; range (n1 n2) : Manual set of the data range for legend. | |||
; gradient yes|no : Forze draw gradient legend with category data. | |||
; tick (dimen) : Length of the ticks. | |||
; whiteframe (dimen) : Width of the white frame around the bar color. | |||
<gallery caption="Sample gallery" widths="250px" heights="250px" perrow="3"> | |||
File:ps_out_rlegend.png|rlegend Zip Codes (wake)<br/> raster zipcodes_wake<br/> cols 2 0<br/> swidth 8mm<br/> order 20,10,30,22,34<br/>end | |||
File:ps_out_rlegend1.png|rlegend<br/> raster elevation<br/> height 8cm<br/>end | |||
File:ps_out_rlegend2.png|rlegend<br/> raster elevation<br/> width 8cm<br/> vertical no<br/>end | |||
</gallery> | |||
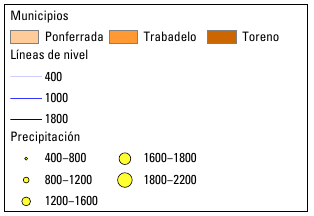
=== vlegend === | |||
Legend of the vector maps. | |||
; vlegend [text] : Optional the title or head of the legend. | |||
''<u>The next commands are optionals</u>'': | |||
; title : Block ''font'' for title of legend. | |||
; font : Block font for normal text of legend. | |||
; frame : | |||
; cols (number.1 [number.2]) : Distribution of the items in ''number.1'' cols. Optionaly, ''number.2'' of span between columns. | |||
; swidth (dimen) : Symbol width. | |||
; interline (dimen) : Space between lines. | |||
: | <gallery caption="vlegend: sample gallery" widths="250px" heights="150px" perrow="3"> | ||
File:ps_output_vlegend0.png | |||
</gallery> | |||
== Conversion to PDF == | |||
: | You can obtain good results with these settings: | ||
ps2pdf14 -dPDFSETTINGS=/prepress -dEmbedAllFonts=true map.ps map.pdf | |||
== | == Example for ps.output control script == | ||
This is the content of a ps.output control file: | |||
<source lang="text"> | |||
paper A4 | |||
landscape y | |||
end | end | ||
maparea | |||
height 12cm | |||
border .8mm | |||
color grey | |||
end | |||
grid | |||
major 100000 | |||
width .1mm | |||
color white | |||
end | |||
minor 50000 | |||
width .1mm | |||
color white | |||
style 1 | |||
end | |||
font | |||
name Univers | |||
size 6 | |||
extend 1.2 | |||
color black | |||
end | |||
fcolor black | |||
format +out | |||
trim 3 | |||
end | end | ||
raster ortho.r ortho.g ortho.b | |||
end | end | ||
</source> | </source> | ||
[[Category: ps.map]] | [[Category: ps.map]] | ||
[[Category:Printing]] | |||
Latest revision as of 20:49, 2 August 2013
The ps.out try to update the standard postscript output of Grass adding new features to design borders, graticules, categorized legends, etc
This is in progress and not all features are yet uploaded in addons.
Command line flags
-d : Draw a 1x1 cm grid on paper to help the placement of the elements of the map.
-e: Create an output file for embedding into another ps.out map
-g: Use the extended PostScript of Ghostscript (for transparent colors only)
-s: Draw the small digit in the coordinate numbers to lower instead upper position.
- Sample gallery
-
A4 paper with flag -d
-
coordinate
-
coordinate with flag -s


Generic Instructions
Parameters
dimen
Define a dimension. Accepted units are:
- unitless
- e.g. 123. The dimension is the number by 1/72".
- inch
- e.g. 1.2inch.
- milimeters
- e.g. 2.3mm.
- centimeters
- e.g. 1.4cm.
- percentage
- e.g. 50%.
The position is relative to the size and position of the map in the paper being 0% the left or bottom corner.
color
Define a color. Accepted formats are:
- standard GRASS name
- e.g. indigo.
- R:G:B
- e.g. 200:123:90
- user name
- e.g. red5.
Defined in palette block
All formats can add '$(0-1)' to define the opacity of the color (alpha channel); e.g., indigo$.75 or 200:120:120$.2
number
text
Blocks of instructions
A block begin with the keywords and finish with keyword end
font
Define the characteristic of a font.
- name (text)
- Name of font.
- size (dimen)
- Size of font.
- extend (dimen)
- Expand the width of font.
- color (color)
- Color of font.
- outline yes|no
- Outline of the font.
line
Define the characteristic of a line.
- width (dimen)
- Width of line.
- color (color)
- Color of line.
- style solid|dashed|dotted|dashdotted|(n1n2...)
- Style of line.
- cap butt|round|extended_butt
- Cap
- extended type step [voffset height width]
- Extended style of line for use mainly with rects.
type = arrow, bar, circled_semi, double_bar, point, rombo, square, triangle, xcross, zigzag (you can use only the first char; and uppercase for filled version).
step = (dimen).
voffset = (dimen).
height = (dimen).
width = (dimen).
- baseline (y|n)
- Work with the extended option to define if the baseline is drawn.
- Sample gallery
-
extended arrow 1mm
-
extended bar 1mm
-
extended circled_semi 1mm
-
extended double_bar 1mm
-
extended point 1mm
-
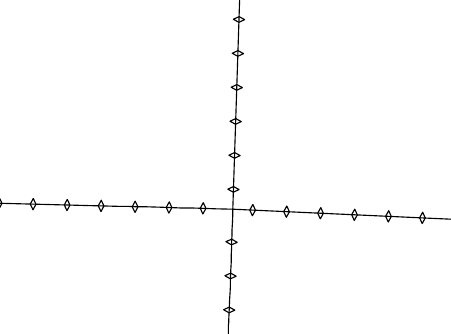
extended rombo 1mm
-
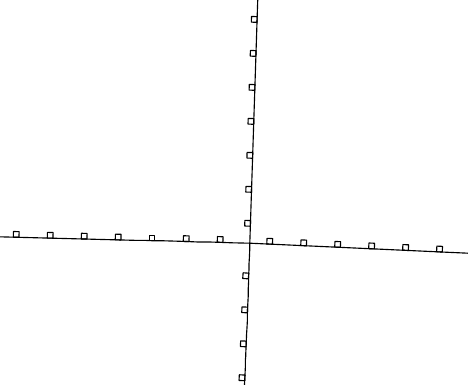
extended square 1mm
-
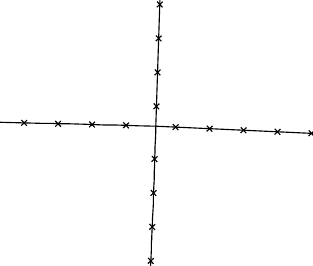
extended xcros 1mm


fill
Define the characteristic of a fill area.
- color (color)
- Fill color.
- pat (file)
- Fill pattern.
- lwidth (dimen)
- Line width of the fill pattern.
- scale (number)
- Scale of the fill pattern.
- limit (dimen)
- Limit the fill to the border with a width of dimen.
frame
Define the characteristic of a frame.
- where (dimen.1 dimen.2)
- Position of frame.
- offset (number.1 number.2)
- Fine x and y adjust of the position of frame.
- ref right|left|center upper|lower|center
- Position is relative to the ref.
- border (dimen)
- Width of the border line
- color (color)
- Color of the border line.
- fcolor (color)
- Fillcolor of the frame.
- rotate (dimen)
- todo
legend
- lpos (number)
- Position in legend
Codes: -1, no show in legend; 0 automatic position; > 0 horizontal position.
- cols (number.1 [number.2])
- Organize legend in number.1 cols with a optional span of number.2
- interline (dimen)
- Set partial legend interline
Map paper
paper
Size of paper.
- paper [A0-6|B0-6|Legal|Ledger|Tabloid|Executive|Folio]
- Type of paper (default A4).
- color (color)
- Paper color.
- width (dimen), height (dimen)
- Custom size of paper.
- left (dimen), right (dimen), top (dimen), bottom (dimen)
- Custom margins (default 0.5" left and right, and 1" top and bottom).
- landscape yes|no
- Paper orientation (default no).
- font
- Block font. Set the default font of the map.
- draw
- Block draw. Free draw as watermarks, before any feature of the map is drawn (see draw).
scale
Scale of the map.
Simple line command to define the scale of the map. The default is adjust map to the paper dimensions. If the remaining dimensions of the paper not permit the scale, ps.out adjust the scale to a new value that it fit in the paper.
- scale 1:(number)
- Scale of map.
For example, scale 1:500000 to rescale maparea dimensions.
maparea
Define specific dimensions of the map (default defined by command scale)
- maparea
- Define characteristics of the map area.
- border (dimen)
- Width of the border map.
Usefull with in and out formats of the grid and geogrid, ignored in iho and can formats.
- color (color)
- Border color-
- fcolor (color)
- Fillcolor of the map area.
- width (dimen), height (dimen)
- Dimensions of the map.
- top (dimen), bottom (dimen)
- Position of the top-left corner of the map.
- draw
- Block draw.
Draw onto the map but before the grid lines, vpoints and vlabels are drawn; i.e. this map elements are drawn over the draw elements.
palette
testing
- palette
- light (color text)
- dark (color text)
- wheel (number text)
- monochrome (color number text)
- complementary (color number text)
- analogous (color number text)
- gradient (color.1 color.2 number text)
- binary (color name)
- sequential (color.1 color.2 number text)
- qualitative (number text)
- diverging (color.1 color.2 number text)
Common elements
grid and geogrid
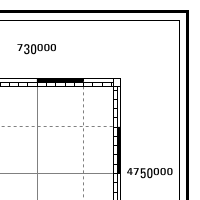
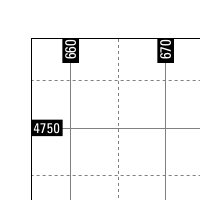
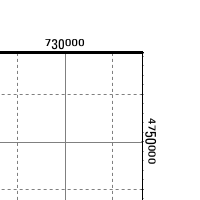
Draw a border around the map.
- grid|geogrid
- format in|out|+out|can|iho
- Type of border (see examples).
- major (number|angle)
- Block line. Usually, number is merters and angle only in geogrid.
- minor (number|angle)
- Block line. Usually, number is merters and angle only in geogrid.
- subminor (number)
- number of subdivisons of the minor divisions.
- trim (number)
- Cut trailing zeros.
- font
- Block font.
- fcolor (color)
- Color of the border.
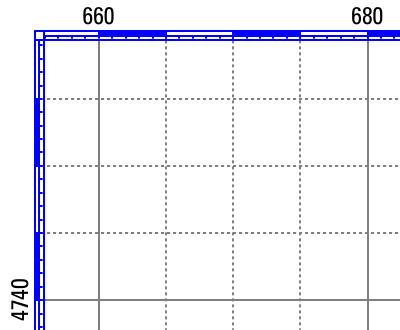
- cross (number)
- Replace lines by cross
- Sample gallery
-
format iho
-
format can
-
format in
-
format +out
-
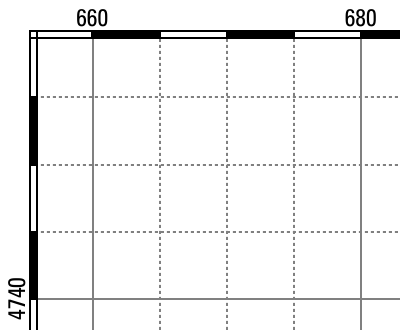
typical map border
-
typical map border with subminor 5 and fcolor blue
-
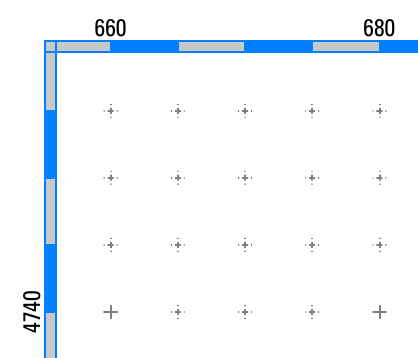
cross 500, fcolor indigo, color 200:200:200 in maparea


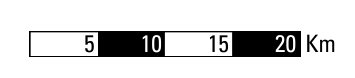
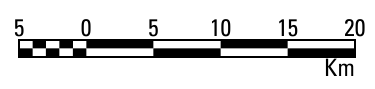
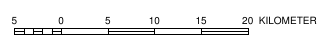
scalebar
Set a scalebar on the map.
Maximun 5 scalebars in each map.
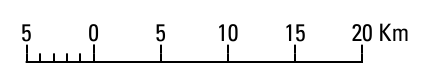
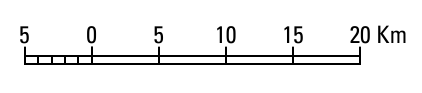
- scalebar I|l|s|S|f|F
- Define the type of scalebar (I: inner, l: line, s/S: simple, f/F: fill).
- length (number)
- Length of the scale.
- units meters|m|kilometers|km|feet|ft|miles|mil|nautical_miles|nm ([text])
- Unit of the length and text' to label the units.
- major (number.1 [number.2])
- Define the number.1 of subdivisions and each number.2 set the labels.
- minor (number.1 [number.2])
- Define the number.1 of subdivisions and each number.2 set the labels.
- frame
- Block frame
- font
- Block font
- fcolor (color)
- Fillcolor.
- height (dimen)
- Height of the bar or ticks.
- zero yes|no
- Set position relative to zero value of the scalebar.
- Scalerbar styles
-
scalebar s
-
scalebar S
-
scalebar I (uppercase i)
-

scalebar f
-
scalebar F
-
scalebar l (downcase L)
-
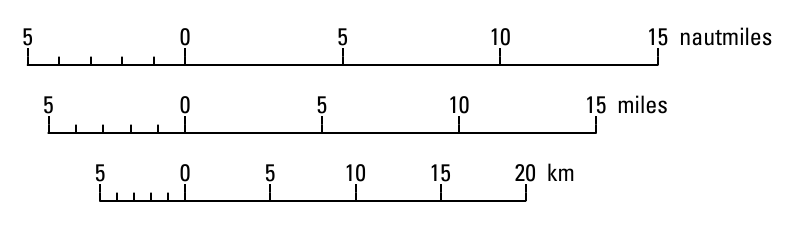
Multiple scalebars zero centered with zero yes

note
Write special text or free text on any place of the paper with frame (also draw permit write free-text in paper).
Maximun 20 notes by map.
- note :file|:maplimits|:dimen|:scale (text)|(text)
- Type of note and text to show.
When free text, use '|' to break lines and '.' as first character to center line.
- text (text)
- Another roption to enter the same as inline note text;
- frame
- Block frame.
- font
- Block font.
- width (dimen)
- Width of note.
- angle (number)
- number of degrees to rotate (do not work fine).
- Note keywords and free text
-
![note :maplimits frame [...] end](/w/images/Ps_out_note_ml.png)
note :maplimits
frame [...]
end -
![note :dimen frame [...] end](/w/images/Ps_out_note_dimen.png)
note :dimen
frame [...]
end -
![note :scale frame [...] end](/w/images/Ps_out_note_scale.png)
note :scale
frame [...]
end -
![in multiple lines frame [...] end](/w/images/Ps_out_note_free.png)
in multiple lines
frame [...]
end -
![.in multiple [...] frame [...] end](/w/images/Ps_out_note_freec.png)
.in multiple [...]
frame [...]
end -
![note :scale scale frame [...] angle 90 end](/w/images/Ps_out_note_scaler.png)
note :scale scale
frame [...]
angle 90
end
![note :maplimits frame [...] end](/wiki/File:Ps_out_note_ml.png)
![note :dimen frame [...] end](/wiki/File:Ps_out_note_dimen.png)
![note :scale frame [...] end](/wiki/File:Ps_out_note_scale.png)
![in multiple lines frame [...] end](/wiki/File:Ps_out_note_free.png)
![.in multiple [...] frame [...] end](/wiki/File:Ps_out_note_freec.png)
![note :scale scale frame [...] angle 90 end](/wiki/File:Ps_out_note_scaler.png)
draw
Simple script language to draw predefined postscript code.
- draw [none|paper|maparea|free]
paper: before any map feature is drawn (equivalent to place inside paper block);
maparea before the last elements of the map (equivalent to place inside mapare block) ;
none: draw over all elements of the map but only in the map area; and
free: after all map features are drawn in any place of the paper; and none.
- ---
- Sample gallery
-

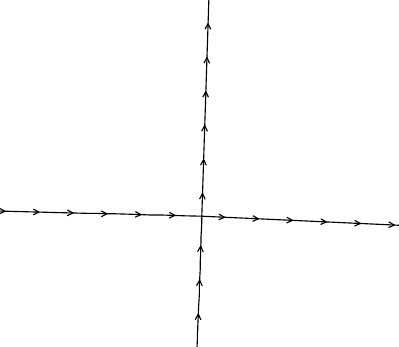
north 700000 4700000
-
north 5cm 16.5cm -
-
maplimits
-
compass 700000 4700000 10000 10.2345


Raster maps
raster
Draw one or two raster maps on the maparea.
- raster (raster|raster.1 raster.2|raster.R raster.G raster.B|:group)
- The raster value is the raster mapname, two raster maps raster.1 or color and raster.2 or shade to draw as relief map, three maps raster.R, raster.G and raster.B to draw as RGB, or a groupname (leader by ':') with tree RGB maps.
The next commands are optionals:
- hillshade yes|no
- Use when draw a shaded raster to draw hillshade.
See http://grass.osgeo.org/wiki/Ps.out_Making_maps#The_second_output
- grey yes|no
- Store and draw the rasters in grey scale (small size of file).
The conversion follows the NTSC video standard.
- maskcell (raster.1 [raster.2])
- Set the raster.1 map to use as mask (independent of the mask set in GRASS with r.mask) and, optionally, the raster.2 map uses as background.
The background raster.2 is painted in grey scale (NTSC) and tinted with maskcolor.
- maskcolor (color|none)
- Set the color of the mask area.
If a raster map as background is set then it's drawn with a scale white-maskcolor.
- outline
- Block line. Outline of categories.
- setcolor null|default|(number) (color)
- Replace the color of the cat number area with a new color.
Multiple setcolor are possibles.
- Sample gallery
-
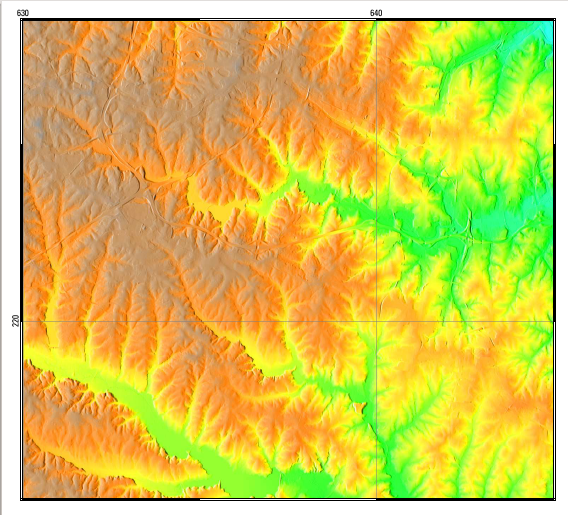
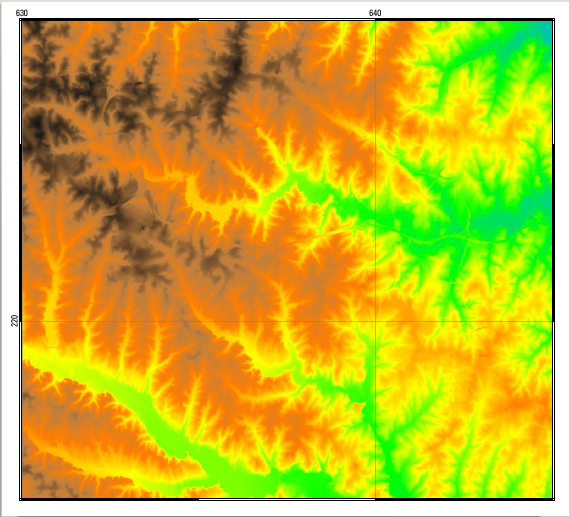 raster elevation
end -
 raster elevation elevation_shade
end -
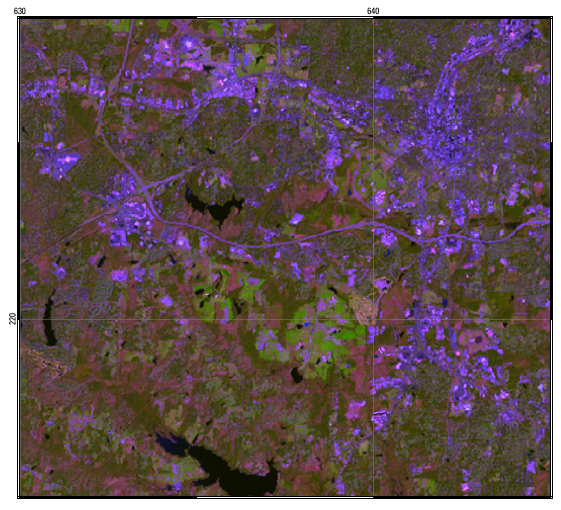 raster lsat5.5 lsat5.4 lsat5.3
end -
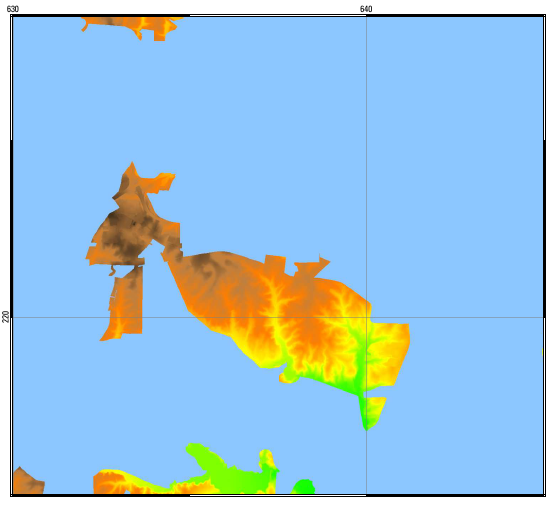 raster elevation
maskcell urban_neg
maskcolor indigo
end -
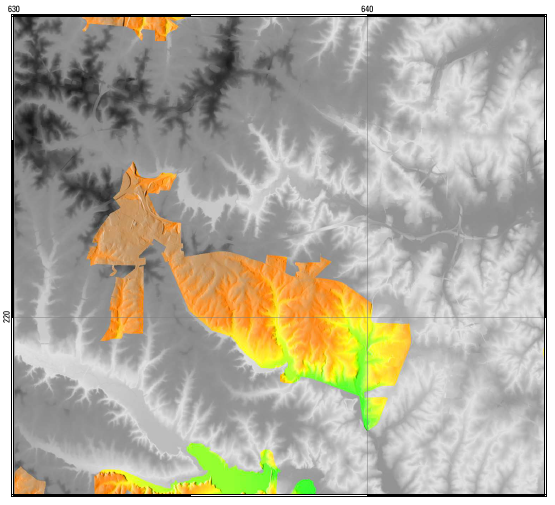 raster elevation elevation_shade
maskcell urban_neg elevation
end -
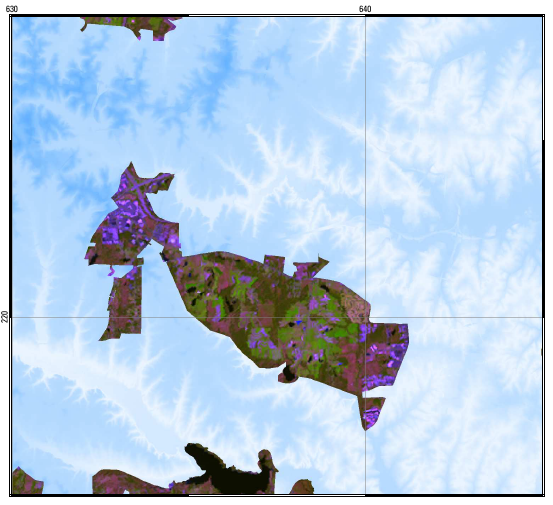 raster lsat5.5 lsat5.4 lsat5.3
maskcell urban_neg elevation
maskcolor indigo
end -
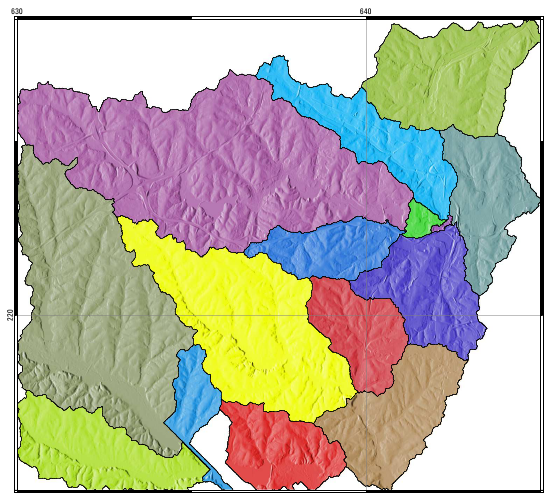 raster basin_50K elevation_shade
maskcell basin_50K
outline
width .2mm
end
end -
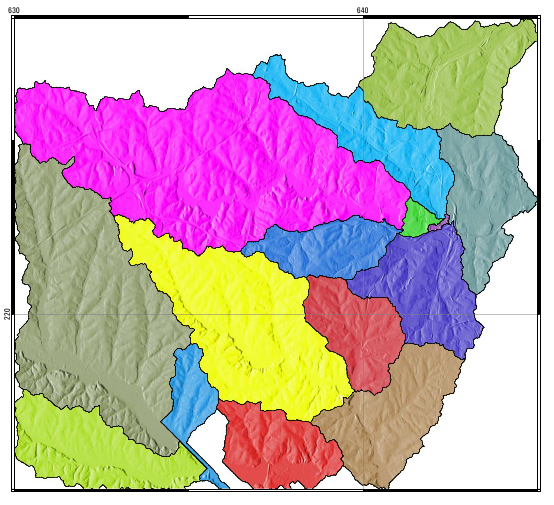 raster basin_50K elevation_shade
maskcell basin_50K
maskcolor white
setcolor 37 magenta
end -
 raster elevation
grey yes
end


Vector maps
All vector map accept optionally the following commands:
- layer (number)
- Layer number used with cats/where option.
- cats (n1,n2,...)
- List of cats to show.
- where (text)
- Argument of the SQL where clausule to filter the areas to show.
- masked yes|no
- Masked or not by raster mask (default no).
- label (text)
- For description or title in vlegend.
- legend [(number)]
- Position in legend (-1, no legend) or enter in a block legend.
vareas
Draw areas on the map.
The areas always are drawn first, on the bottom of other type of maps.
- vareas (vector)
- vector is a vector of areas, except when lwidth is different to zero that vector is a vector of lines.
The next commands are optionals:
- type area|line
- Default area.
- line
- Block line. Style of the boundary.
- fill
- Block fill. Style of the area.
- rgbcol (column.1 [column.2])
- Dynamic fill color in a column.1 of the database, or conditional color from rules applied to column.2 of the database.
- setnorule (text)
- Text label when default conditions.
- setrule (n1-n2[:color][|dimen] text)
- Make a item of a sublegend with label the text and title the text of the label.
The fillcolor of the areas is set to color and the line width is set to dimen when column.2 >= n1 and column.2 < n2 (column.2 from rgbcol).
Special commands:
- island yes|no
- Draw island as normal areas (fill as normal area then hide it).
- mirror (dimen [number])
- The line is drawn as an area with a copy of the line placed with polar coordinates: dimen' and angle.
- vareas: sample gallery
-
fill
color indigo -
fill
color indigo
limit 3mm -
fill
pat patterns/diag_up.eps -
rgbcol - cat
setrule 0-500:red A
setrule 500-1000:green B
setrule 1000-5000:blue C -
island no
-
![vareas roadsmajor cat 24,28,32,38,53 mirror 5 90 [and fill with pat cruz.eps]](/w/images/Ps_out_vareas5.png)
vareas roadsmajor
cat 24,28,32,38,53
mirror 5 90
[and fill with pat cruz.eps]


![vareas roadsmajor cat 24,28,32,38,53 mirror 5 90 [and fill with pat cruz.eps]](/wiki/File:Ps_out_vareas5.png)
vlines
Draw lines on the map.
The areas always are drawn second, after vareas and before vpoints.
- vlines (vector)
vector is a vector of lines, except if type is boundary that vector is a vector of areas.
Optional commands:
- type line|boundary
- Draw boundaries of a vector of areas or lines of a vector of lines (default line).
- line
- Block line. Normal line.
- hline
- Block line. Highlight line.
- offset (dimen)
- Works with hline to offset from the center of line.
- rgbcol (column.1 [column.2])
- Dynamic line color in a column.1 of the database, or conditional color from rules applied to column.2 of the database.
- setnorule (text)
- Label in legend when default values and setcolor rules.
- setrule (n1-n2[:color] text)
- Make a item of a sublegend with text as label and title the text of the label. Also, the color of the normal line with column >= n1 and column < n2 (column from rgbcol), is set to color.
- vlines: sample gallery
-
hline
-
.25mm


vpoints
Draw points on the map.
The points always are drawn last, after vareas and vlines.
- vpoints (vector)
vector is a vector of points, except when type is centroid or boundary that it is a vector of areas, or when type is line that it is a vector of lines.
The next commands are optionals:
- type centroid|line|boundary|point
- Type of draw (default point).
- symbol (epsfile)
- Symbol to use (default: basic/circle).
- line
- Block line. Type of line in the symbol.
- fcolor (color)
- Static fillcolor of the symbol.
- offset (dimen)
- Offset of the symbol.
- rotate (number|column)
- Angle to rotate the symbol, static number or dynamic in a column of the database.
- size (number|column [number])
- Size of the symbol take from number or from a column of the database. In the last option, there is a optional number to define the static size of the symbol in the legend when the size of symbols are dynamic.
- scale (dimen.1 [dimen.2])
- Rescale the size of the symbol by the dimen.1 and, optionally, add a dimen.2. i.e., resize = dimen.1 * size + dimen.2.
- setsize (n1-n2[:size] text)
- Variable size of symbols from data in column of database set in size.
Special commands when type is line:
- dist (dimen)
- Define the distance in paper between symbol over the line.
- cline
- Block line. Type of line that connect symbols.
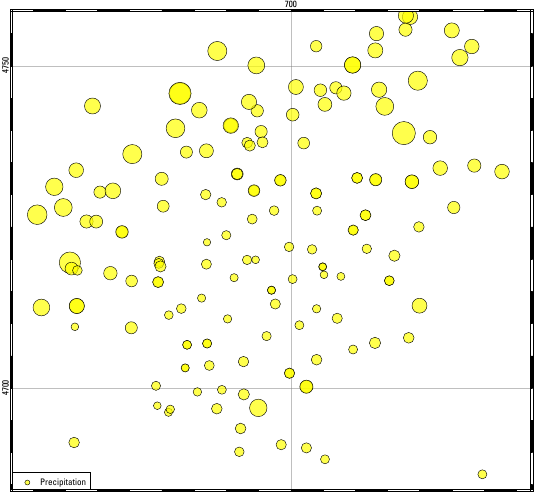
- vpoints: sample gallery
-
Points with same size ...
size 5 -
Points with dynamic size ...
size PT 5
scale 0.01 2 -
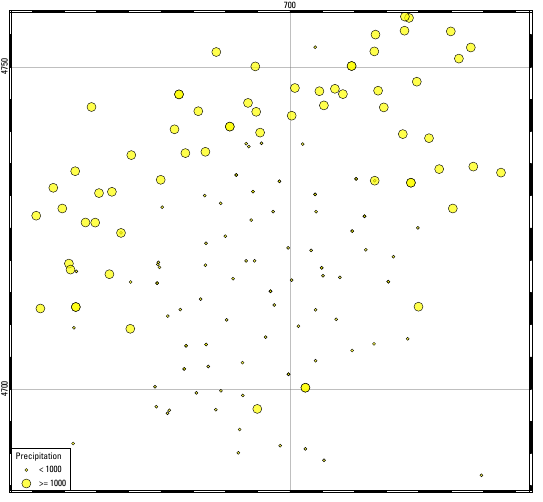
Points with conditional size ...
size PT
setrule 200-1000:3 < 1000
setrule 1000-2500:9 > 1000 -
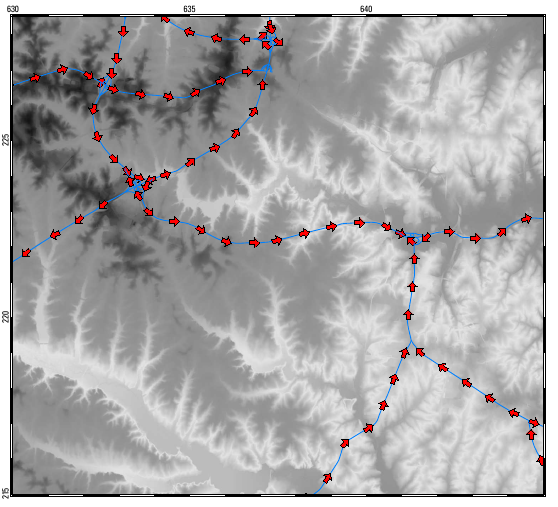
Points on line ...
type line
dist 1cm


vlabels
in progress
- vlabels none|(vector)
- font
- labelcol (column)
- decimals (number)
- circled yes|no
- setrule (n1-n2 text)
- Sample gallery
-
![vpoints firestations [...] end vlabels firestations labelcol PUMPERS font name Univers-Bold size 10 color yellow end end](/w/images/Ps_out_vlabels0.png)
vpoints firestations
[...]
end
vlabels firestations
labelcol PUMPERS
font
name Univers-Bold
size 10
color yellow
end
end
![vpoints firestations [...] end vlabels firestations labelcol PUMPERS font name Univers-Bold size 10 color yellow end end](/wiki/File:Ps_out_vlabels0.png)
Legend of the maps
rlegend
Legend of the raster map.
The units meters in the gradient legend is set with r.support.
- rlegend [text]
- Text is the title of the legend.
- raster (raster)
- the raster map to take the data of legend.
The next commads are optionals:
- titlefont
- Block font for the legend header.
- font
- Block font for the normal text.
- frame
- Block frame.
- swidth (dimen)
- Width of the symbol area.
For category legends
- cols (number) [(number)]
- Number of columns with symbols and separation between columns (default 1).
- interline (dimen)
- Vertical space between symbols (o to join symbols)
- nodata yes|no
- Remove category no data.
- order (n1,n2,...)
- To reorder the items.
For gradient legends
- height (dimen), width (dimen)
- Dimension of the frame with the legend.
- vertical yes|no
- Orientation of the gradient legend (default no).
- range (n1 n2)
- Manual set of the data range for legend.
- gradient yes|no
- Forze draw gradient legend with category data.
- tick (dimen)
- Length of the ticks.
- whiteframe (dimen)
- Width of the white frame around the bar color.
- Sample gallery
-
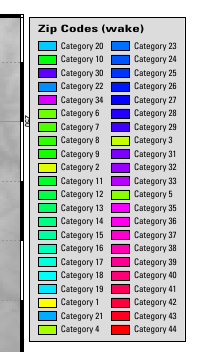
rlegend Zip Codes (wake)
raster zipcodes_wake
cols 2 0
swidth 8mm
order 20,10,30,22,34
end -
rlegend
raster elevation
height 8cm
end -
rlegend
raster elevation
width 8cm
vertical no
end


vlegend
Legend of the vector maps.
- vlegend [text]
- Optional the title or head of the legend.
The next commands are optionals:
- title
- Block font for title of legend.
- font
- Block font for normal text of legend.
- frame
- cols (number.1 [number.2])
- Distribution of the items in number.1 cols. Optionaly, number.2 of span between columns.
- swidth (dimen)
- Symbol width.
- interline (dimen)
- Space between lines.
- vlegend: sample gallery
-

Conversion to PDF
You can obtain good results with these settings:
ps2pdf14 -dPDFSETTINGS=/prepress -dEmbedAllFonts=true map.ps map.pdf
Example for ps.output control script
This is the content of a ps.output control file:
paper A4
 landscape y
end
maparea
 height 12cm
 border .8mm
 color grey
end

grid
 major 100000
  width .1mm
  color white
 end
 minor 50000
  width .1mm
  color white
  style 1
 end
 font
  name Univers
  size 6
  extend 1.2
  color black
 end
 fcolor black
 format +out
 trim 3
end

raster ortho.r ortho.g ortho.b
end