GRASS GIS at NCGIS2017: Difference between revisions
Jump to navigation
Jump to search
⚠️Wenzeslaus (talk | contribs) (→Posters: add How innovations thrive in GRASS GIS) |
⚠️Wenzeslaus (talk | contribs) (→See also: add NCGIS2019) |
||
| (7 intermediate revisions by the same user not shown) | |||
| Line 1: | Line 1: | ||
[[File:Ncgis logo 2017.png|100px|right]] | |||
North Carolina GIS Conference, NCGIS2017, Feb. 22-24, 2017, Raleigh, NC, http://ncgisconference.com/ | North Carolina GIS Conference, NCGIS2017, Feb. 22-24, 2017, Raleigh, NC, http://ncgisconference.com/ | ||
| Line 9: | Line 11: | ||
by Payam Tabrizian (presenter), Anna Petrasova (presenter), Brendan Harmon, Vaclav Petras, and Helena Mitasova from NCSU | by Payam Tabrizian (presenter), Anna Petrasova (presenter), Brendan Harmon, Vaclav Petras, and Helena Mitasova from NCSU | ||
* Citation: Payam Tabrizian | * Citation: Payam Tabrizian, Anna Petrasova, Brendan Harmon, Vaclav Petras, and Helena Mitasova (2017). ''Immersive Tangible Landscape''. Presentation in Technology - Spatial Analysis and Big Data 2 session at NCGIS2017 Raleigh, NC, USA, Feb. 22-24, 2017 | ||
* Description: Tangible Landscape is a tangible interface for geographic information systems (GIS). It interactively couples physical and digital models of a landscape so that users can intuitively explore, model, and analyze geospatial data in a collaborative environment. Conceptually Tangible Landscape lets users hold a GIS in their hands so that they can feel the shape of the topography, naturally sculpt new landforms, and interact with simulations like water flow. Since it only affords a bird's-eye view of the landscape, we coupled it with an immersive virtual environment so that users can virtually walk around the modeled landscape and visualize it at a human-scale. Now as users shape topography, draw trees, define viewpoints, or route a walkthrough, they can see the results on the projection-augmented model, rendered on a display, or rendered on a head-mounted display. In this paper we present the Tangible Landscape Immersive Extension, describe its physical setup and software architecture, and demonstrate its features with a case study. | * Description: Tangible Landscape is a tangible interface for geographic information systems (GIS). It interactively couples physical and digital models of a landscape so that users can intuitively explore, model, and analyze geospatial data in a collaborative environment. Conceptually Tangible Landscape lets users hold a GIS in their hands so that they can feel the shape of the topography, naturally sculpt new landforms, and interact with simulations like water flow. Since it only affords a bird's-eye view of the landscape, we coupled it with an immersive virtual environment so that users can virtually walk around the modeled landscape and visualize it at a human-scale. Now as users shape topography, draw trees, define viewpoints, or route a walkthrough, they can see the results on the projection-augmented model, rendered on a display, or rendered on a head-mounted display. In this paper we present the Tangible Landscape Immersive Extension, describe its physical setup and software architecture, and demonstrate its features with a case study. | ||
* Slides: https://ncsu-geoforall-lab.github.io/tangible-landscape-talk/ncgis2017 | * Slides: https://ncsu-geoforall-lab.github.io/tangible-landscape-talk/ncgis2017 | ||
* Video: https://youtu.be/5K8k964pbz0 | |||
=== The FUTURES Model: An Open-Source Tool For Understanding Where Cities Will Grow And The Impact On Local Economies And Conservation Efforts === | |||
[[File:FUTURES result.png|300px|thumb|right|''The FUTURES Model:'' Example result]] | |||
by Derek Van Berkel from NCSU | |||
* Citation: Derek Van Berkel et al. (2017). ''The FUTURES Model: An Open-Source Tool For Understanding Where Cities Will Grow And The Impact On Local Economies And Conservation Efforts''. Presentation in Applications - Urban and Regional Planning session at NCGIS2017 Raleigh, NC, USA, Feb. 22-24, 2017 | |||
* Description: Increasing global population is accelerating urbanization and rapidly transforming natural systems to impervious built environments. Emerging development challenges include: where (and how) can people live without compromising the natural resources and land systems needed for sufficient food, water, and energy production, and how do we minimize the ecological footprint of cities for maintaining wildlife habitat and special places for outdoor recreation? Despite the important role urbanization plays in the well-being of urban residents, few tools are available for examining the long-term impacts of urban growth. The FUTURES (FUTure Urban-Regional Environment Simulation) model is a new user-friendly, open-source geospatial computer model for simulating urbanization and landscape fragmentation. FUTURES simulates landscape change based on demand for development, local site suitability factors, and a stochastic patch-growing algorithm. In this presentation, I will demonstrate the FUTURES model giving practical advice on how it is implemented, and instructions on how users can leverage the open-source application for their own urban simulation projects. We will explore results for North Carolina to understand how the model can help better understand pressures related to urban growth. Results highlight the tradeoffs of different growth strategies for both local economies and ecological system important for urban residents. FUTURES is an important springboard for initiating and guiding dialogue about planning priorities by helping stakeholders untangle complex urban-related challenges related to rapid urban growth. | |||
* Related modules: {{AddonCmd|r.futures}}, {{AddonCmd|r.futures.pga}}, ... | |||
* Video: https://youtu.be/WrphqyF6PNE | |||
=== 33 years of GRASS GIS as an innovation platform === | === 33 years of GRASS GIS as an innovation platform === | ||
| Line 22: | Line 36: | ||
* Description: US Army CERL started GRASS GIS development in early 80s. Since then, researches around the world have been selecting GRASS GIS as a platform for their new tools. Early on GRASS GIS got 3D view, advanced interpolation methods, hydrology and image processing tools. 3D rasters and time series are now standard data types at the same level as vectors or rasters. Recent developments include novel landform detection, tangible user interface and spatio-temporal algebra. This talk will cover all of this and will show why you should start using GRASS GIS today. | * Description: US Army CERL started GRASS GIS development in early 80s. Since then, researches around the world have been selecting GRASS GIS as a platform for their new tools. Early on GRASS GIS got 3D view, advanced interpolation methods, hydrology and image processing tools. 3D rasters and time series are now standard data types at the same level as vectors or rasters. Recent developments include novel landform detection, tangible user interface and spatio-temporal algebra. This talk will cover all of this and will show why you should start using GRASS GIS today. | ||
* Slides: https://ncsu-geoforall-lab.github.io/grass-as-a-platform/ncgis2017.html | * Slides: https://ncsu-geoforall-lab.github.io/grass-as-a-platform/ncgis2017.html | ||
* Video: https://youtu.be/Vv5NnPg6MOY | |||
=== Seamless fusion of high-resolution DEMs from multiple sources === | === Seamless fusion of high-resolution DEMs from multiple sources === | ||
| Line 32: | Line 47: | ||
* Description: With the increased availability of UAS technologies we can produce extremely high resolution 3D data as often as we need for monitoring of crops, landscape processes, or natural hazards. For certain applications the limited extent of UAS-based data requires us to merge the high resolution topography with other data sources such as lidar. However, simple patching creates discontinuities or artificial edges in the merged DEMs leading to artifacts in modeling results and visualization. In this presentation I will show how to derive seamless digital elevation models combining different sources including time-series of UAS, lidar, and Kinect data, and I will explain how this simple, yet powerful method can be implemented in GIS. | * Description: With the increased availability of UAS technologies we can produce extremely high resolution 3D data as often as we need for monitoring of crops, landscape processes, or natural hazards. For certain applications the limited extent of UAS-based data requires us to merge the high resolution topography with other data sources such as lidar. However, simple patching creates discontinuities or artificial edges in the merged DEMs leading to artifacts in modeling results and visualization. In this presentation I will show how to derive seamless digital elevation models combining different sources including time-series of UAS, lidar, and Kinect data, and I will explain how this simple, yet powerful method can be implemented in GIS. | ||
* Slides: https://petrasovaa.github.io/dem-fusion-talk | * Slides: https://petrasovaa.github.io/dem-fusion-talk | ||
* Video: https://youtu.be/VRiamLVqAIQ | |||
=== Open Source Solutions For Citizen Science In Environmental Reporting, Sensing And Imaging === | |||
by Drew Pilant from US EPA (presenter), Helena Mitasova from NCSU (presenter), and Doug Newcomb from US FWS | |||
* Citation: Drew Pilant, Helena Mitasova, and Doug Newcomb (2017). ''Open Source Solutions For Citizen Science In Environmental Reporting, Sensing And Imaging''. Presentation in Applications - Tools for Reporting and Inventorying session at NCGIS2017 Raleigh, NC, USA, Feb. 22-24, 2017 | |||
* Description: This session focuses on the integration of open source software and data platforms, remote sensing and image classification, and other in-situ environmental sensors such as for air and water quality. The motivation is to highlight open source workflows tools and technology that can help citizen scientists share, process and analyze high resolution imagery and low cost, DIY sensors and observations. | |||
* Video: https://youtu.be/MYYP0xbR-Ik | |||
== Posters == | == Posters == | ||
| Line 45: | Line 69: | ||
* Outline: Lidar Data Processing, Water, Floods and Erosion, Image Segmentations, Topology, Cleaning, Overlays, Attributes, Spatio-Temporal Data Analysis, Vector Network Analysis, Landscape Structure | * Outline: Lidar Data Processing, Water, Floods and Erosion, Image Segmentations, Topology, Cleaning, Overlays, Attributes, Spatio-Temporal Data Analysis, Vector Network Analysis, Landscape Structure | ||
* PDF download: https://trac.osgeo.org/grass/export/70673/grass-promo/grassposter/2017_NCGIS_How_innovations_thrive/How_innovations_thrive_in_GRASS_GIS.pdf | * PDF download: https://trac.osgeo.org/grass/export/70673/grass-promo/grassposter/2017_NCGIS_How_innovations_thrive/How_innovations_thrive_in_GRASS_GIS.pdf | ||
== Booths == | |||
=== Center for Geospatial Analytics, North Carolina State University === | |||
[[File:Ncgis2017 ncsu booth tangible landscape.jpg|300px|thumb|right|Tangible Landscape at NCSU CGA booth (photos by Anna Klevtcova)]] | |||
* The booth featured a [http://tangible-landscape.github.io Tangible Landscape] setup and a [https://youtu.be/pYbpEMjME1Y video] of Tangible Landscape with immersion (a coupling of tangible user interface, GRASS GIS, and [http://blender.org Blender]). | |||
* The following three books authored or coauthored at NC State University were displayed: | |||
** ''Open Source GIS: A GRASS GIS Approach'' (3rd edition) by Markus Neteler and Helena Mitasova | |||
** ''Tangible Modeling with Open Source GIS'' by Anna Petrasova, Brendan Harmon, Vaclav Petras, and Helena Mitasova | |||
** ''GIS-based Analysis of Coastal Lidar Time-Series'' by Eric Hardin, Helena Mitasova, Laura Tateosian, and Margery Overton | |||
* Stickers for Tangible Landscape, GRASS GIS and Tangible Landscape setup sticker showing ''powered by GRASS GIS'' were available as well as flyers about Tangible Landscape explaining its connection to GRASS GIS. | |||
* Organization URL: http://geospatial.ncsu.edu | |||
== See also == | |||
* [[GRASS GIS at US-IALE 2017 Annual Meeting]] | |||
* [[FOSS4G NA 2016: GRASS related workshops and presentations]] | |||
* [[NCGIS2019]] | |||
[[Category: Conferences]] | |||
[[Category: 2017]] | |||
Latest revision as of 03:03, 3 March 2019

North Carolina GIS Conference, NCGIS2017, Feb. 22-24, 2017, Raleigh, NC, http://ncgisconference.com/
Presentations
Immersive Tangible Landscape
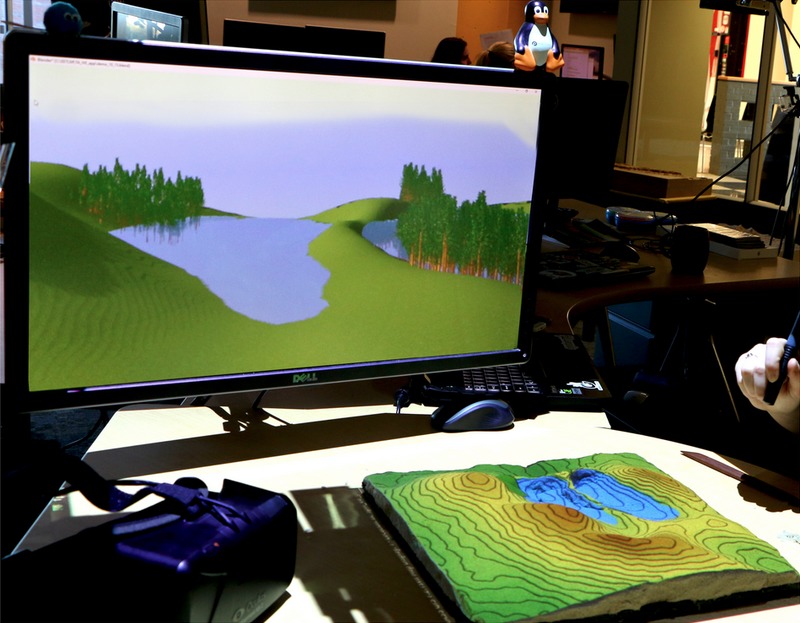
by Payam Tabrizian (presenter), Anna Petrasova (presenter), Brendan Harmon, Vaclav Petras, and Helena Mitasova from NCSU
- Citation: Payam Tabrizian, Anna Petrasova, Brendan Harmon, Vaclav Petras, and Helena Mitasova (2017). Immersive Tangible Landscape. Presentation in Technology - Spatial Analysis and Big Data 2 session at NCGIS2017 Raleigh, NC, USA, Feb. 22-24, 2017
- Description: Tangible Landscape is a tangible interface for geographic information systems (GIS). It interactively couples physical and digital models of a landscape so that users can intuitively explore, model, and analyze geospatial data in a collaborative environment. Conceptually Tangible Landscape lets users hold a GIS in their hands so that they can feel the shape of the topography, naturally sculpt new landforms, and interact with simulations like water flow. Since it only affords a bird's-eye view of the landscape, we coupled it with an immersive virtual environment so that users can virtually walk around the modeled landscape and visualize it at a human-scale. Now as users shape topography, draw trees, define viewpoints, or route a walkthrough, they can see the results on the projection-augmented model, rendered on a display, or rendered on a head-mounted display. In this paper we present the Tangible Landscape Immersive Extension, describe its physical setup and software architecture, and demonstrate its features with a case study.
- Slides: https://ncsu-geoforall-lab.github.io/tangible-landscape-talk/ncgis2017
- Video: https://youtu.be/5K8k964pbz0
The FUTURES Model: An Open-Source Tool For Understanding Where Cities Will Grow And The Impact On Local Economies And Conservation Efforts
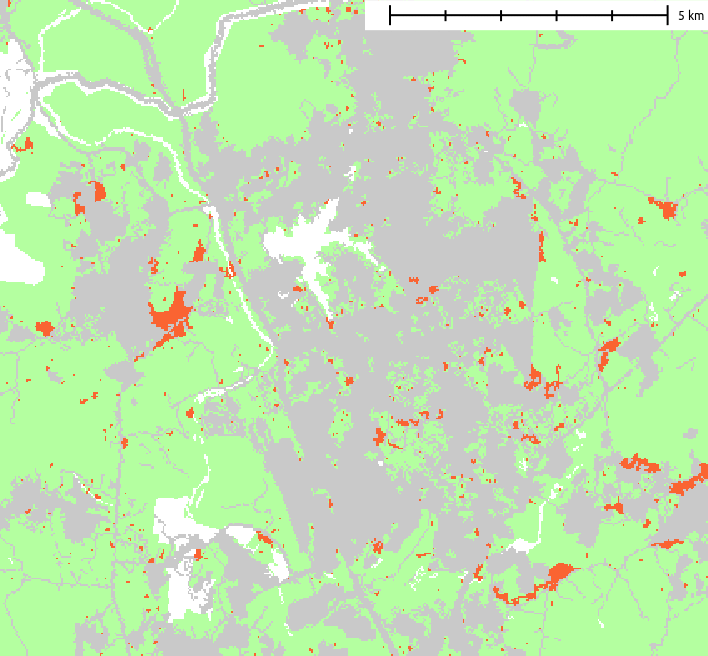
by Derek Van Berkel from NCSU
- Citation: Derek Van Berkel et al. (2017). The FUTURES Model: An Open-Source Tool For Understanding Where Cities Will Grow And The Impact On Local Economies And Conservation Efforts. Presentation in Applications - Urban and Regional Planning session at NCGIS2017 Raleigh, NC, USA, Feb. 22-24, 2017
- Description: Increasing global population is accelerating urbanization and rapidly transforming natural systems to impervious built environments. Emerging development challenges include: where (and how) can people live without compromising the natural resources and land systems needed for sufficient food, water, and energy production, and how do we minimize the ecological footprint of cities for maintaining wildlife habitat and special places for outdoor recreation? Despite the important role urbanization plays in the well-being of urban residents, few tools are available for examining the long-term impacts of urban growth. The FUTURES (FUTure Urban-Regional Environment Simulation) model is a new user-friendly, open-source geospatial computer model for simulating urbanization and landscape fragmentation. FUTURES simulates landscape change based on demand for development, local site suitability factors, and a stochastic patch-growing algorithm. In this presentation, I will demonstrate the FUTURES model giving practical advice on how it is implemented, and instructions on how users can leverage the open-source application for their own urban simulation projects. We will explore results for North Carolina to understand how the model can help better understand pressures related to urban growth. Results highlight the tradeoffs of different growth strategies for both local economies and ecological system important for urban residents. FUTURES is an important springboard for initiating and guiding dialogue about planning priorities by helping stakeholders untangle complex urban-related challenges related to rapid urban growth.
- Related modules: r.futures, r.futures.pga, ...
- Video: https://youtu.be/WrphqyF6PNE
33 years of GRASS GIS as an innovation platform
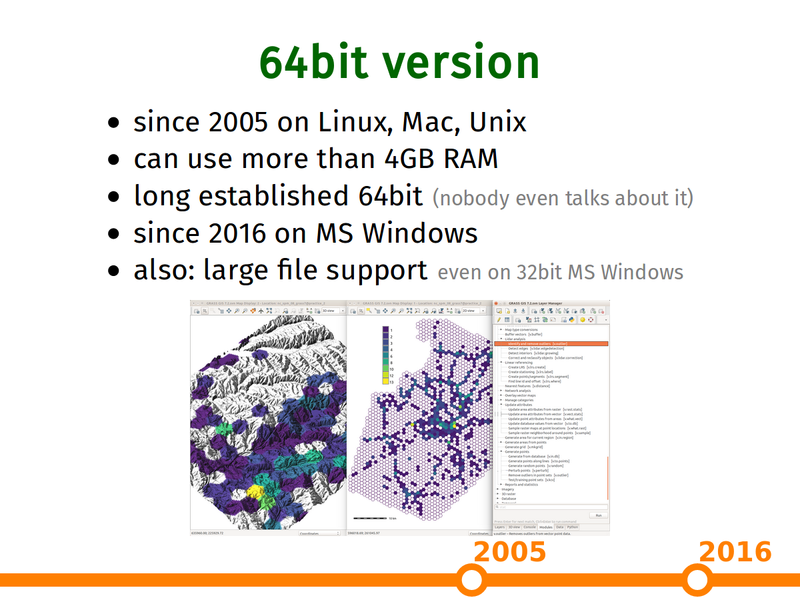
by Vaclav Petras from NCSU
- Citation: Vaclav Petras (2017). 33 years of GRASS GIS as an innovation platform. Presentation in Technology - UAS & Remote Sensing 2 session at NCGIS2017 Raleigh, NC, USA, Feb. 22-24, 2017
- Description: US Army CERL started GRASS GIS development in early 80s. Since then, researches around the world have been selecting GRASS GIS as a platform for their new tools. Early on GRASS GIS got 3D view, advanced interpolation methods, hydrology and image processing tools. 3D rasters and time series are now standard data types at the same level as vectors or rasters. Recent developments include novel landform detection, tangible user interface and spatio-temporal algebra. This talk will cover all of this and will show why you should start using GRASS GIS today.
- Slides: https://ncsu-geoforall-lab.github.io/grass-as-a-platform/ncgis2017.html
- Video: https://youtu.be/Vv5NnPg6MOY
Seamless fusion of high-resolution DEMs from multiple sources
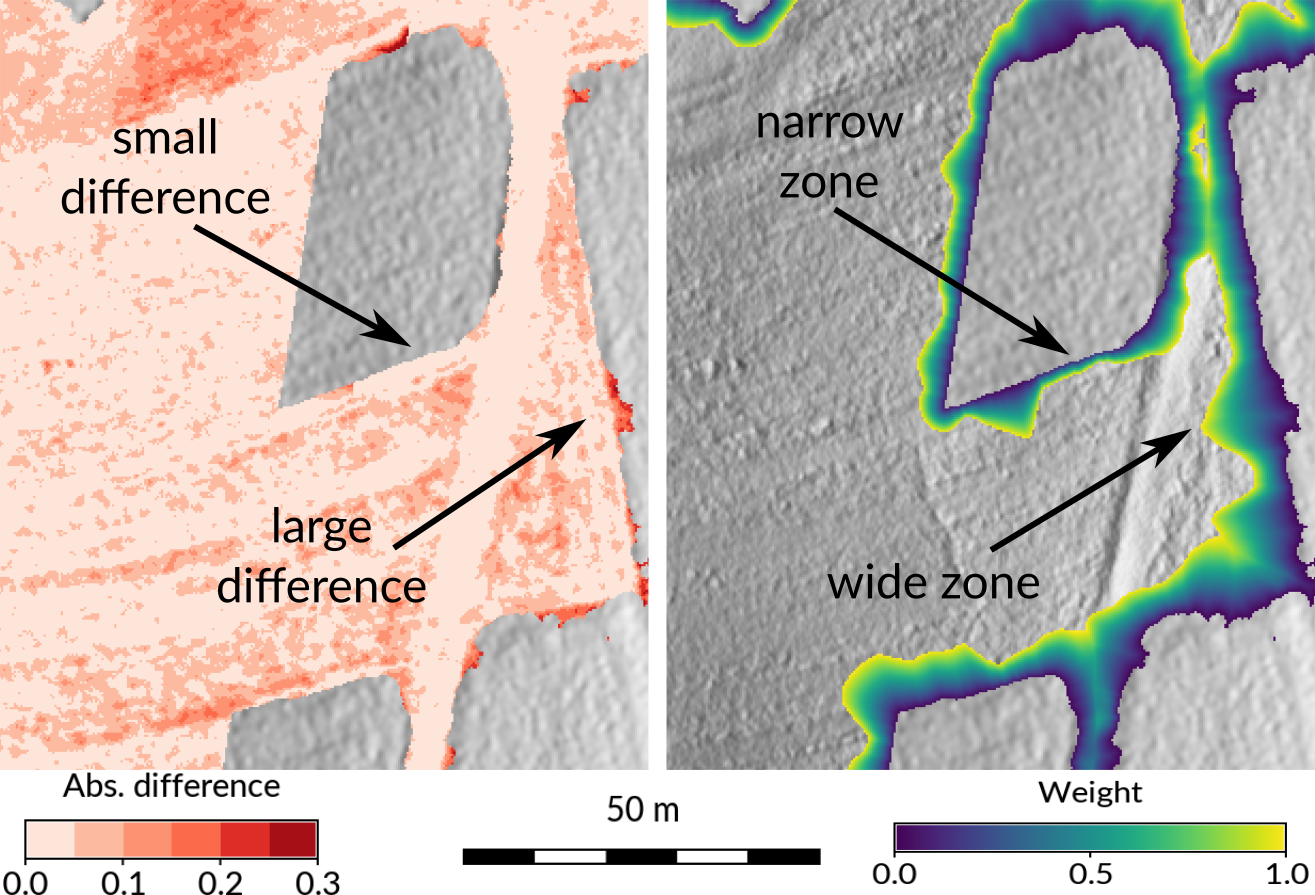
by Anna Petrasova (presenter), Helena Mitasova, Vaclav Petras, and Justyna Jeziorska from NCSU
- Citation: Anna Petrasova, Helena Mitasova, Vaclav Petras, and Justyna Jeziorska (2017). Seamless fusion of high-resolution DEMs from multiple sources. Presentation in Technology - UAS & Remote Sensing 2 session at NCGIS2017 Raleigh, NC, USA, Feb. 22-24, 2017
- Description: With the increased availability of UAS technologies we can produce extremely high resolution 3D data as often as we need for monitoring of crops, landscape processes, or natural hazards. For certain applications the limited extent of UAS-based data requires us to merge the high resolution topography with other data sources such as lidar. However, simple patching creates discontinuities or artificial edges in the merged DEMs leading to artifacts in modeling results and visualization. In this presentation I will show how to derive seamless digital elevation models combining different sources including time-series of UAS, lidar, and Kinect data, and I will explain how this simple, yet powerful method can be implemented in GIS.
- Slides: https://petrasovaa.github.io/dem-fusion-talk
- Video: https://youtu.be/VRiamLVqAIQ
Open Source Solutions For Citizen Science In Environmental Reporting, Sensing And Imaging
by Drew Pilant from US EPA (presenter), Helena Mitasova from NCSU (presenter), and Doug Newcomb from US FWS
- Citation: Drew Pilant, Helena Mitasova, and Doug Newcomb (2017). Open Source Solutions For Citizen Science In Environmental Reporting, Sensing And Imaging. Presentation in Applications - Tools for Reporting and Inventorying session at NCGIS2017 Raleigh, NC, USA, Feb. 22-24, 2017
- Description: This session focuses on the integration of open source software and data platforms, remote sensing and image classification, and other in-situ environmental sensors such as for air and water quality. The motivation is to highlight open source workflows tools and technology that can help citizen scientists share, process and analyze high resolution imagery and low cost, DIY sensors and observations.
- Video: https://youtu.be/MYYP0xbR-Ik
Posters
How innovations thrive in GRASS GIS
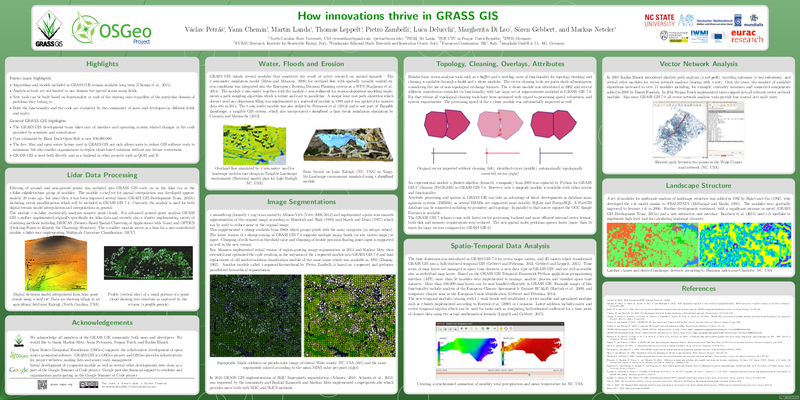
by Vaclav Petras (presenter, typesetter), Yann Chemin, Martin Landa, Thomas Leppelt, Pietro Zambelli, Luca Delucchi, Margherita Di Leo, Sören Gebbert, and Markus Neteler
- Citation: Vaclav Petras, Yann Chemin, Martin Landa, Thomas Leppelt, Pietro Zambelli, Luca Delucchi, Margherita Di Leo, Sören Gebbert, and Markus Neteler (2017). How innovations thrive in GRASS GIS. Poster at NCGIS2017 Raleigh, NC, USA, Feb. 22-24, 2017
- Highlights: Algorithms and models included in GRASS GIS remain available long term. Analytical tools are not limited to one domain but spread across many fields. New tools can be built based on functionality or code of the existing ones regardless of the particular domain of problems they belong to. Both the functionality and the code are evaluated by the community of users and developers in different fields and scales.
- Outline: Lidar Data Processing, Water, Floods and Erosion, Image Segmentations, Topology, Cleaning, Overlays, Attributes, Spatio-Temporal Data Analysis, Vector Network Analysis, Landscape Structure
- PDF download: https://trac.osgeo.org/grass/export/70673/grass-promo/grassposter/2017_NCGIS_How_innovations_thrive/How_innovations_thrive_in_GRASS_GIS.pdf
Booths
Center for Geospatial Analytics, North Carolina State University
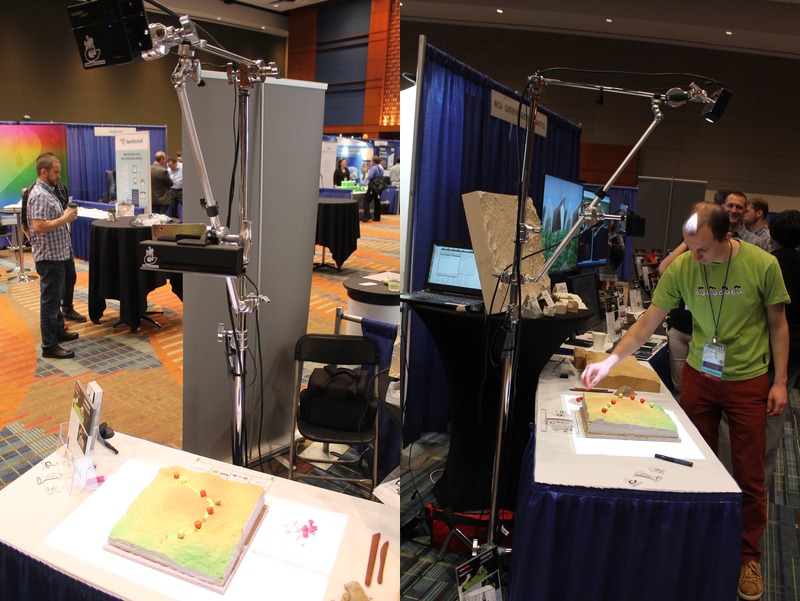
- The booth featured a Tangible Landscape setup and a video of Tangible Landscape with immersion (a coupling of tangible user interface, GRASS GIS, and Blender).
- The following three books authored or coauthored at NC State University were displayed:
- Open Source GIS: A GRASS GIS Approach (3rd edition) by Markus Neteler and Helena Mitasova
- Tangible Modeling with Open Source GIS by Anna Petrasova, Brendan Harmon, Vaclav Petras, and Helena Mitasova
- GIS-based Analysis of Coastal Lidar Time-Series by Eric Hardin, Helena Mitasova, Laura Tateosian, and Margery Overton
- Stickers for Tangible Landscape, GRASS GIS and Tangible Landscape setup sticker showing powered by GRASS GIS were available as well as flyers about Tangible Landscape explaining its connection to GRASS GIS.
- Organization URL: http://geospatial.ncsu.edu