NCGIS2021: Difference between revisions
Jump to navigation
Jump to search
⚠️Dnewcomb (talk | contribs) m (Added link to powerpoint presentation) |
⚠️Wenzeslaus (talk | contribs) (→Presentations: avoid the links turned into just the number when it is not reference/citation) |
||
| (One intermediate revision by one other user not shown) | |||
| Line 10: | Line 10: | ||
* Speakers: Doug Newcomb, Stephen Mather (Cleveland Metroparks) | * Speakers: Doug Newcomb, Stephen Mather (Cleveland Metroparks) | ||
* Materials: [https://youtu.be/p9KCfufNYgE Recording] | * Materials: [https://youtu.be/p9KCfufNYgE Recording] | ||
* Slides: [https://github.com/dnewcomb/grasspresent/blob/main/NCGIS_2021_recreating_the_DEM_dn_svm2.odp ODP at GitHub] | |||
=== New Major Release of GRASS GIS === | === New Major Release of GRASS GIS === | ||
| Line 24: | Line 25: | ||
* Speaker: Doug Newcomb (USFWS) | * Speaker: Doug Newcomb (USFWS) | ||
* Materials: [https://youtu.be/3hOwUdaV4yM Recording] | * Materials: [https://youtu.be/3hOwUdaV4yM Recording] | ||
* Slides: [https://ecos.fws.gov/ServCat/DownloadFile/196770] | * Slides: [https://ecos.fws.gov/ServCat/DownloadFile/196770 PPTX at USFWS ECOS] | ||
== Posters == | == Posters == | ||
Latest revision as of 18:42, 22 April 2021

This page is about work related to GRASS GIS presented at NCGIS2021 (NC GIS 2021 Virtual Conference, North Carolina, USA), February 16-19, 2021 (https://ncgisconference.com/).
Presentations
Quick Methods for Recreating a DEM when Reprojecting a LiDAR Point Cloud
- Description: Working with multiple LiDAR collection point clouds across a landscape can require reprojecting the point cloud and rebuilding a DEM for further analysis. It's fairly straightforward to create a DEM from ground points, but there will be holes for buildings and waterbodies where breaklines may not be present to assist in filling in the holes. Using the LiDAR ground point data, it's possible to quickly fill voids using GRASS GIS raster methods, and to identify areas where the technique does not work well and further work is needed.
- Speakers: Doug Newcomb, Stephen Mather (Cleveland Metroparks)
- Materials: Recording
- Slides: ODP at GitHub
New Major Release of GRASS GIS

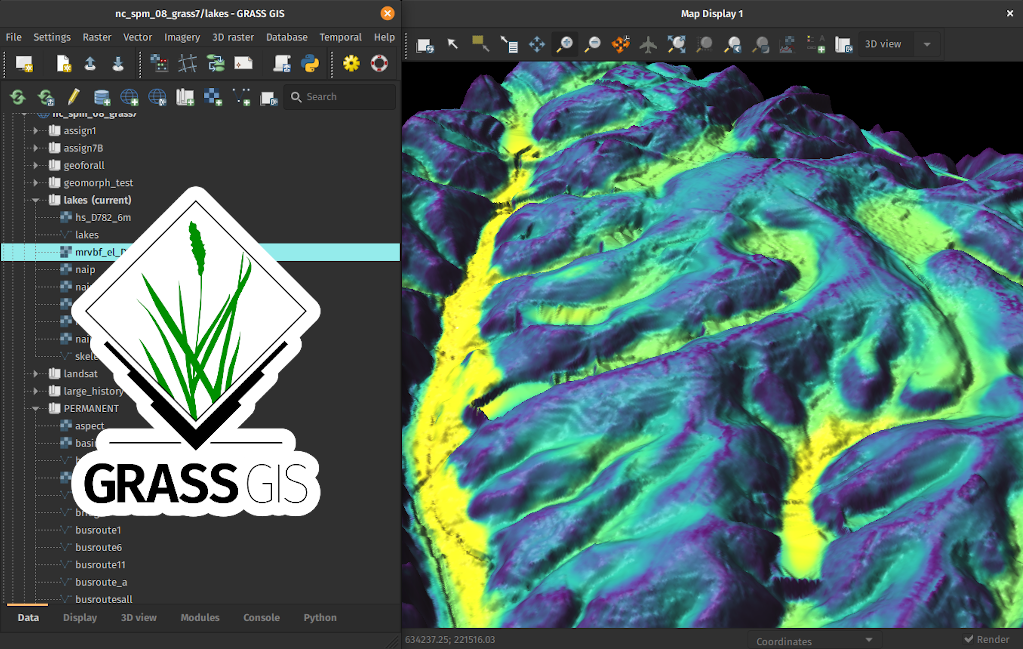
- Description: GRASS GIS is an all-in-one tool for geospatial analysis and remote sensing made by users for users. GRASS GIS is open source which removes the licensing hassle and cost and puts users to the center of the story. This talk will highlight the new major release of GRASS GIS. Version 8 provides a completely new first-time user experience and streamlines how users interact with their data. New features include dark-themed interface support, Voronoi-based area skeletons, gap filling, near feature attribute statistics, image collection support, customizable solar radiance model, and unlimited fine-scale hydrologic simulation. The new version contains all features from the previous versions including Python 3 scripting, spatio-temporal data analysis, PostgreSQL connections, HPC cluster support, low-end hardware support, and more. Experimental features available for download now include buffer statistics, road centerlines, vector attribute update with Python syntax, coastal, stream, and dam flooding, mass-preserving interpolation, transect generation, longest flow path, iterative subwatershed delineation, edge detection, user and producer accuracies, attribute plots, valley flatness, cost-distance area connectivity, and Sentinel, MODIS, USGS, and GBIF data download. Additionally, issues, fixes, and ongoing improvements are now publicly accessible at GitHub. This talk presents contributions by the whole GRASS GIS user and developer community and highlights additions by the Center for Geospatial Analytics at North Carolina State University.
- Speakers: Vaclav Petras (NC State University), Anna Petrasova (NC State University)
- Materials: Recording, Slides
Creating Bathymetric Data for a Freshwater Reservoir using Satellite Imagery
- Description: As part of a habitat assessment for aquatic species in the Roanoke Rapids reservoir, recent bathymetric data was data was needed. The only publicly available bathymetric data was 5 ft contour lines from the historic USGS 7.5’ quadrangle. Using publicly available Sentinel 2 data, depth data from biological sampling locations, lake water level data, and publicly available LiDAR data, a bathymetry layer was created using a combination of GRASS GIS software and the R project statistical software.
- Speaker: Doug Newcomb (USFWS)
- Materials: Recording
- Slides: PPTX at USFWS ECOS
Posters
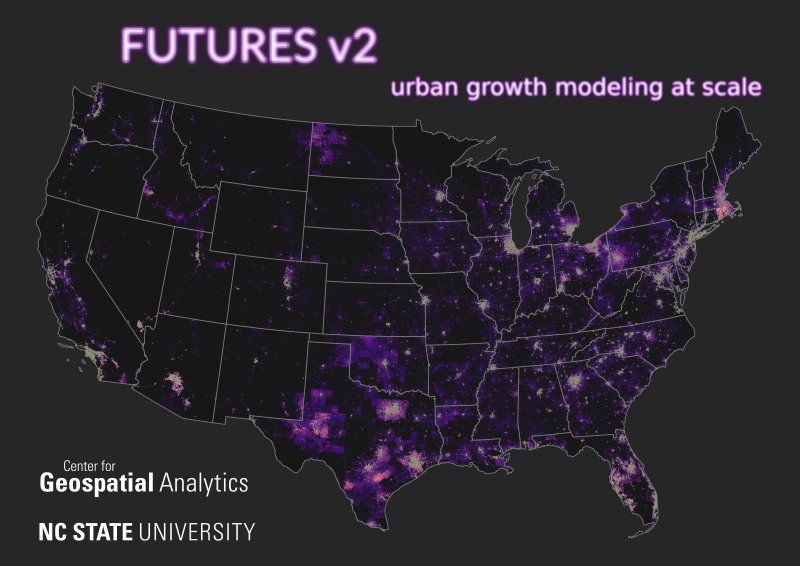
FUTURES v2: Urban Growth Modeling at Scale

- Authors: Anna Petrasova, Georgina Sanchez, Vaclav Petras, Ross K. Meentemeyer
- Poster at ResearchGate
- Citation: Petrasova, A., Sanchez, G., Petras, V., Meentemeyer, R.K. (2021) FUTURES v2: Urban Growth Modeling at Scale. NC GIS Conference. February 2021. DOI: 10.13140/RG.2.2.11830.22081