Creating animation from FUTURES output in GRASS GIS
This is a tutorial how to create an animation from the output of r.futures.pga addon module which is a part of r.futures, an implementation of FUTURES model. It uses GRASS temporal framework to get the output time series into a spatio-temporal dataset which is then used as an input for the WxGUI Animation Tool (g.gui.animation. Not all steps from the tutorial might apply to you case depending on how your input data are structured, which color tables you are using and what static data you wish to add to the animation.
Brief intro to GRASS GIS temporal framework
When using temporal framework, we do not work with individual map layers but with space-time datasets. Dataset is a collection of individual map layers with assigned time stamps. Note that raster, vector and 3D raster data is still stored in standard GRASS database, and temporal framework manages the temporal metadata in separate temporal database.
Dataset can have absolute (2016-01-01) or relative (5 years) temporal type. Maps in dataset can use intervals (both start and end) or instances (only start).
Additional material:
- short presentation from FOSS4G 2014 workshop
- GRASS as a Temporal GIS - Sören Gebbert (longer presentation)
- official documentation
- examples and workflows
Creating spatio-temporal dataset from the output
The Animation tool can work directly with the rasters, however it is more advantageous to register all the rasters in the time series into the temporal database.
Start by creating a spatio-temporal raster dataset with relative temporal type:
t.create output=futures_series type=strds temporaltype=relative \
    semantictype=mean title="Development" \
    description="Development time series 2012 to 2035 generated by FUTURES"
Note that backslashes mean that the line continues on the next line. This syntax works in unix-like command lines. In the GUI Command Console, just put everything on one line without any backslashes.
Now, get list of all map layers in time series generated by r.futures.pga (assuming we set output_series=final when we were running the module):
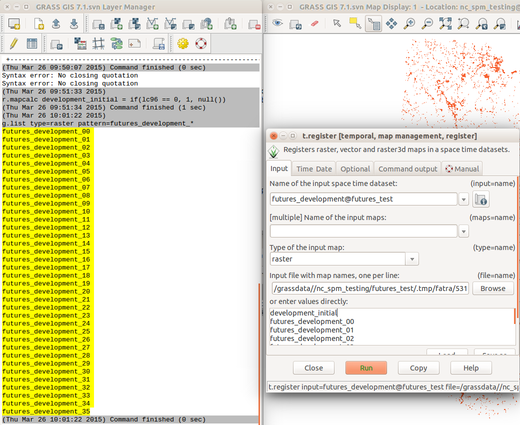
g.list type=raster pattern=step_*
This will create a list of raster maps; each name at one line:
step_00
step_01
...
step_22
step_23
You can prepare the list of rasters in a (plain) text editor and use the file as an input for t.register. Alternatively, you can use GUI dialog for t.register and copy and paste the list of rasters from g.list directly into the given input box of the file option. In any case, the command should be similar to this one:
t.register input=futures_series \
    file=.../.tmp/fatra/5311.19 start=2012 unit=years increment=1
To verify we registered dataset correctly, we can check t.info and t.rast.list output:
t.info futures_series
t.rast.list futures_series
Animation tool
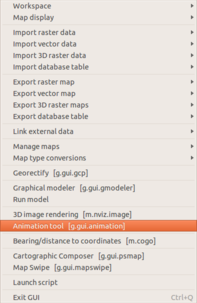
Start GRASS GIS Animation tool from main menu File > Animation Tool (or from command line g.gui.animation). Then find Add new animation button in the toolbar and press it.
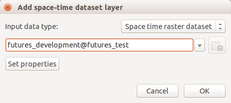
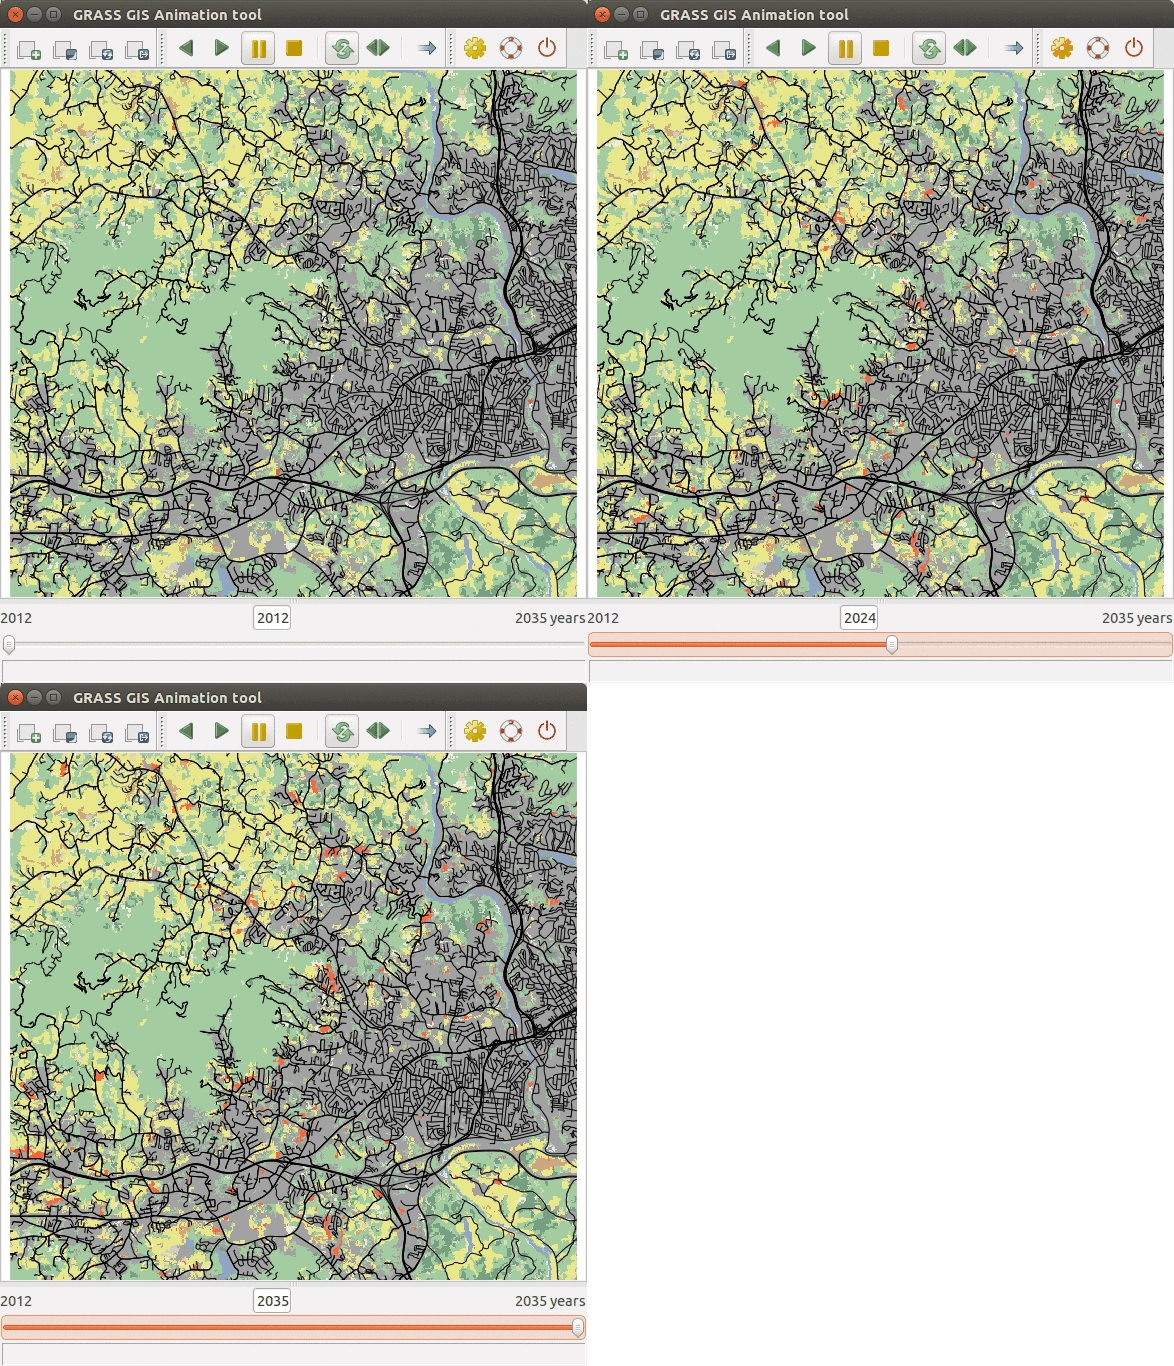
Animation tool can display a series of raster or vector maps or spatio-temporal datasets. Similarly to the Map Display the animation tool can display different static layers, raster or vector. We have already registered the output from r.futures.pga as a spatio-temporal dataset, so we can simply use just this dataset. Set Input data type to Space-time raster dataset and then select the dataset we created earlier.
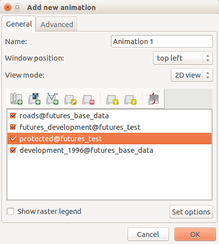
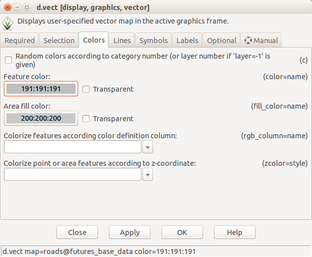
To make the animation more informative, we can display also different static layers (which won't change during the animation), for example roads, or shaded relief. By double-clicking on the layer we can change its display properties, for example for vector we can change symbology in d.vect dialog. Also, we can make the layers semi-transparent if needed.
Animation tool displays the extent of computational region. To change the extent, change the computational region, for example from Map display - Various zoom options - Set computational region extent interactively and draw the extent. Press Rerender in Animation tool.
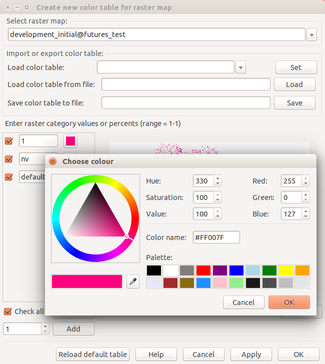
Suggested layers include (from bottom to top) semi-transparent landuse map landuse_2011, FUTURES time series futures_series, initial binary development layer urban_2011 (with d.rast values=1 for displaying only developed areas) and roads. Use tool in Raster > Manage colors > Manage color rules interactively to set color of urban_2011 to grey.
 |
 |
