GRASS GIS at FOSS4G Boston 2017


International Conference for Free and Open Source Software for Geospatial, August 14-19, 2017, Boston, Massachusetts, USA, http://2017.foss4g.org
Workshops
Conference program link: http://2017.foss4g.org/workshops
From GRASS GIS novice to power user
by Anna Petrasova from North Carolina State University (NCSU), Giuseppe Amatulli from Yale University, and Vaclav Petras from NCSU
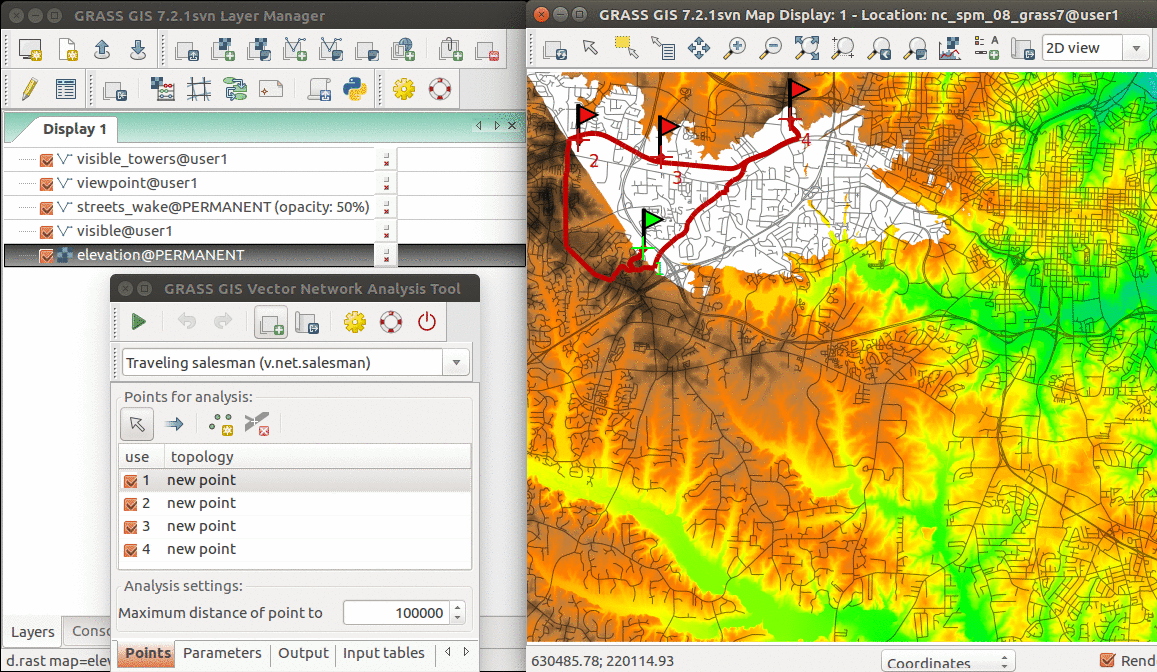
- Description: Do you want to use GRASS GIS, but never understood what that location and mapset are? Do you struggle with the computational region? Or perhaps you used GRASS GIS already but you wonder what g.region -a does? Maybe you were never comfortable with GRASS command line? In this workshop, we will explain and practice all these functions and answer questions more advanced users may have. We will help you decide when to use graphical user interface and when to use the power of command line. We will go through simple examples of vector, raster, and image processing functionality and we will try couple of new and old tools such as vector network analysis or image segmentation which might be the reason you want to use GRASS GIS. We aim this workshop at absolute beginners without prior knowledge of GRASS GIS, but we hope it can be useful also to current users looking for deeper understanding of basic concepts or the curious ones who want to try the latest additions to GRASS GIS.
- Outline: Introduction to the GRASS folder structure and environment, Introduction to graphical user interface and command line, GRASS working environment and working directory, Create location and mapset (from GUI and from command line), Setting the study area extent and pixel size to make the computation correct and efficient, Move data to and from GRASS database, Move data between locations and mapsets, Perform basic raster and vector operations, Try out some of the more advanced and latest features
- Format and requirements: Participants should bring their laptops with GRASS GIS 7. Beginners are encouraged to try using the latest OSGeo-Live virtual machine. There are no special requirements. Just have your laptop with GRASS GIS or OSGeo-Live virtual machine with you.
- Materials: From GRASS GIS novice to power user (workshop at FOSS4G Boston 2017)
Processing lidar and UAV point clouds in GRASS GIS
by Vaclav Petras, Anna Petrasova, and Helena Mitasova from North Carolina State University (NCSU)
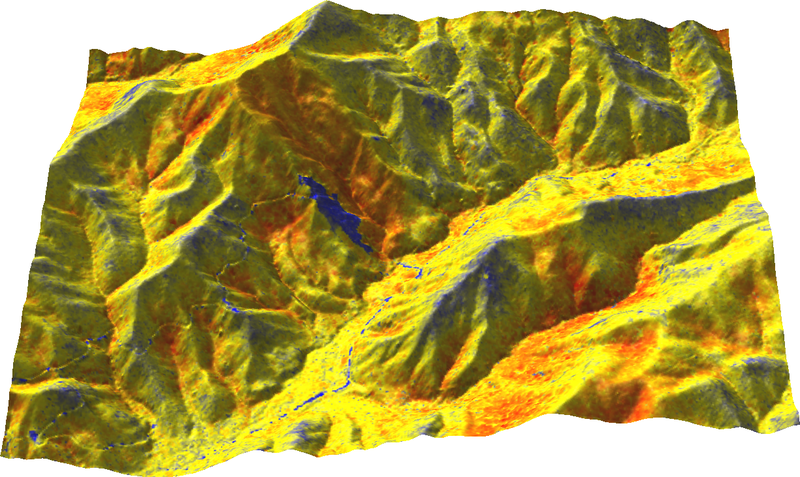
- Description: GRASS GIS offers, besides other things, numerous analytical tools for point clouds, terrain, and remote sensing. In this hands-on workshop we will explore the tools in GRASS GIS for processing point clouds obtained by lidar or through processing of UAV imagery. We will start with a brief and focused introduction into GRASS GIS graphical user interface (GUI) and we will continue with short introduction to GRASS GIS Python interface. Participants will then decide if they will use GUI, command line, Python, or online Jupyter Notebook for the rest of the workshop. We will explore the properties of the point cloud, interpolate surfaces, and perform advanced terrain analyses to detect landforms and artifacts. We will go through several terrain 2D and 3D visualization techniques to get more information out of the data and finish with vegetation analysis.
- Outline: Basic introduction to graphical user interface, Basic introduction to Python interface, Decide if to use GUI, command line, Python, or online Jupyter Notebook, Binning of the point cloud, Interpolation, Terrain analysis, Visualization, profiles and statistics, Vegetation analysis, 3D visualization
- Format and requirements: This workshop is accessible to beginners, but some basic knowledge of lidar processing or GIS will be helpful for smooth experience. Have your laptop with GRASS GIS or OSGeo-Live virtual machine with you. Online Jupyer Notebooks will be available too.
- Slides for related talks from past events: http://wenzeslaus.github.io/grass-lidar-talks/
- Related paper: Petras, V., Petrasova, A., Jeziorska, J., Mitasova, H.: Processing UAV and lidar point clouds in GRASS GIS, ISPRS - International Archives of the Photogrammetry, Remote Sensing and Spatial Information Sciences XLI-B7, 945–952, 2016 (full-text at ResearchGate)
- Materials: Processing lidar and UAV point clouds in GRASS GIS (workshop at FOSS4G Boston 2017)
Presentations
Conference program link: http://2017.foss4g.org/accepted-presentations
Advanced geospatial technologies: The new powerful GRASS GIS 7.2 release
by Vaclav Petras from North Carolina State University (NCSU), Markus Neteler from mundialis GmbH & Co. KG, Anna Petrasova from NCSU and Helena Mitasova from NCSU
- Description: To solve challenges in the world and our backyard and to deal with massive data, we need to have a tool which works on powerful supercomputers as well as on small laptops. We need a tool which GIS novice can use through graphical user interface and a tool which data science expert can use through command line. We present GRASS GIS 7.2 , a powerful platform for geospatial data analysis, network analysis, topological operations, image processing, spatial modeling and more. The new 7.2 release comes with a series of new modules to analyze vector and raster data along with unique features such as temporal algebra functionality. The graphical user interface includes a new management tool for GRASS GIS spatial database and an integrated Python editor where Python beginners can get a template for script with GUI in one click. Furthermore, the libraries were again significantly improved for speed and efficiency, along with support for huge files. The development team added lidar data support as well as new methods for 3D flow accumulation and 3D gradient calculation. Importantly, raster data are now significantly reduced in size through new efficient raster data compression methods. For the ease of automated processing, batch job support was greatly simplified. In addition, there are more than 50 new add-ons available. The talk shows latest advances in GRASS GIS 7.2, proposing to directly enjoy the software rather than to use it in a limited way through other software.
Visualization and analysis of active transportation patterns derived from public webcams
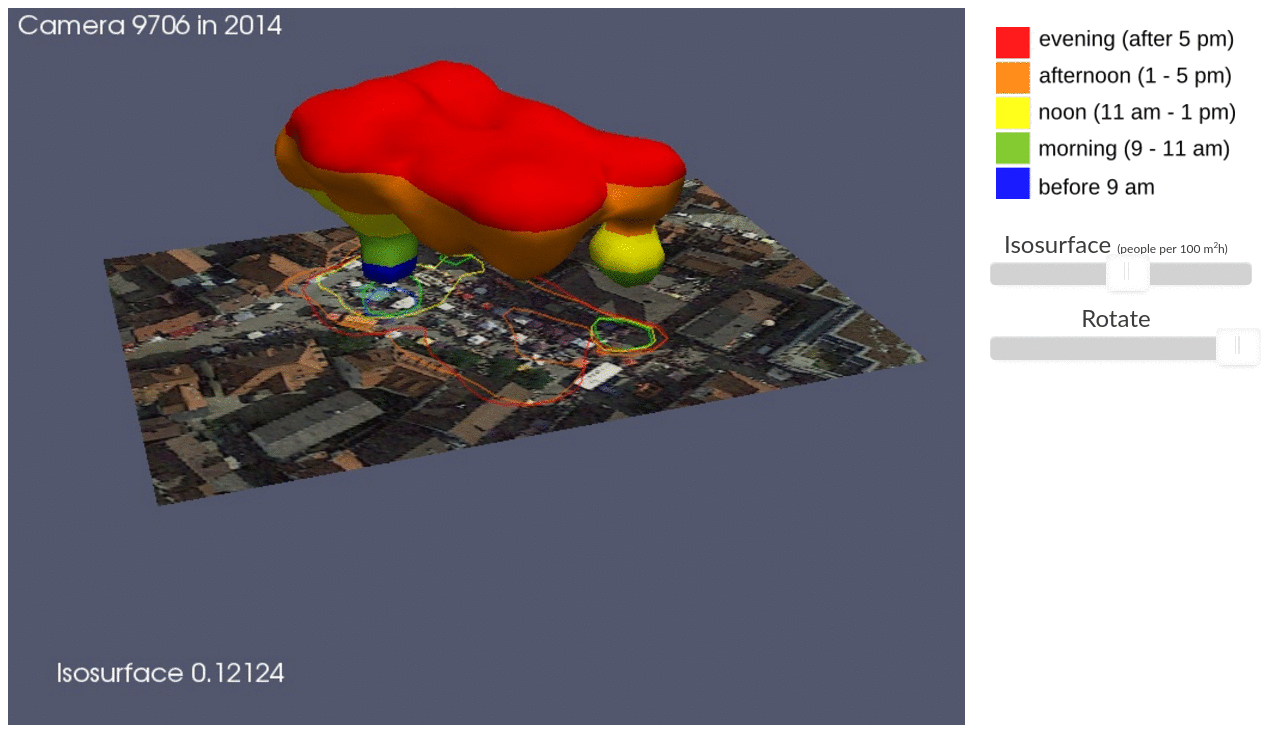
by Anna Petrasova, Aaron Hipp and Helena Mitasova from North Carolina State University
- Description: Public webcams provide us with unique information about the dynamics of public spaces and active transportation behavior such as walking or bicycling. We compiled webcam images capturing public squares of towns and cities in several locations around the world and used crowdsourcing platform Amazon Mechanical Turk (MTurk) to locate pedestrians in these images. In this presentation we will show how we used several scientific Python packages and Jupyter Notebook to turn raw MTurk data into a georeferenced dataset suitable for further analysis and visualization. Using space-time cube representation, we then estimated spatio-temporal density of pedestrians and interactively explored the resulting voxel model in GRASS GIS. Harnessing the power of open source software and crowdsourced data, this study opens new possibilities for the analysis of the dynamics of public spaces within their geospatial context.
- Software used: Jupyter, Python, Matplotlib, GRASS GIS, Paraview, Blender
Using open-source tools and high-resolution geospatial data to estimate landscapes' visual attributes
by Payam Tabrizian, Anna Petrasova, Vaclav Petras, and Helena Mitasova (presenter) from NCSU
- Description: Viewshed, in geospatial applications, is predominantly used to calculate line of sight or area of visible terrain from a given viewpoint. However, with the right open-source tools and high resolution data, viewsheds can be used to acquire a much more in depth understanding of landscapes’ visual attributes. A quantitative understanding of visual attributes will help predicting and enhancing landscapes’ usability, recreation value and experiential quality (e.g, therapeutic potentials). We present a method that combines high-density lidar point clouds, high-resolution landcover data (1ft resolution), and tree stem detection technique to simulate viewsheds for a number of user-defined points. Then for each viewshed, several geospatial operations and statistical tools are applied to compute metrics for visual scale (e.g., depth of views, visual permeability), complexity (e.g., shannon diversity index, edge density, mean shape index), and naturalness (e.g, percentage of canopy cover, percentage of built elements). The entire workflow is implemented using Python and GRASS GIS.
- Software used: Python, GRASS GIS, Blender
- Related modules: r.viewshed, r.mapcalc
Coupling a geospatial Tangible User Interfaces (TUI) and an Immersive Virtual Environment (IVE) using using open-source geospatial and 3D modelling tools
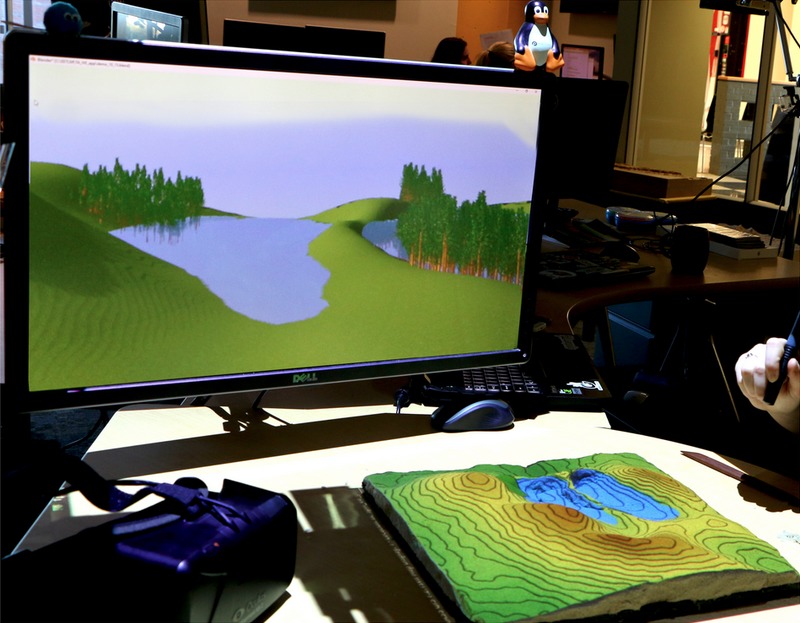
by Payam Tabrizian, Anna Petrasova (presenter), Vaclav Petras, and Helena Mitasova from NCSU
- Description: We present the latest prototype of tangible landscape - a system that couples tangible interaction with open-source geospatial modelling and 3D simulations. With tangible landscape users can collaboratively reshape a physical model of landscape by hand and -in near real-time- receive geospatial simulations projected on the model. We have paired Tangible landscape with a free and open-source 3D modeling and rendering software to enable real-time realistic rendering of human views on a computer display, and immersive head-mounted displays. In this presentation we will describe tangible landscape’s physical setup, software architecture implemented in GRASS GIS and Blender, and the workflow for transforming tangible interaction to geospatial simulation and virtual reality representations. We will demonstrate the system’s functionality and features using a collaborative geospatial modelling case study.
- Software used: Tangible Landscape, GRASS GIS, Blender
- Slides: https://ncsu-geoforall-lab.github.io/tangible-landscape-talk/FOSS4G_2017.html
OSGeo booth
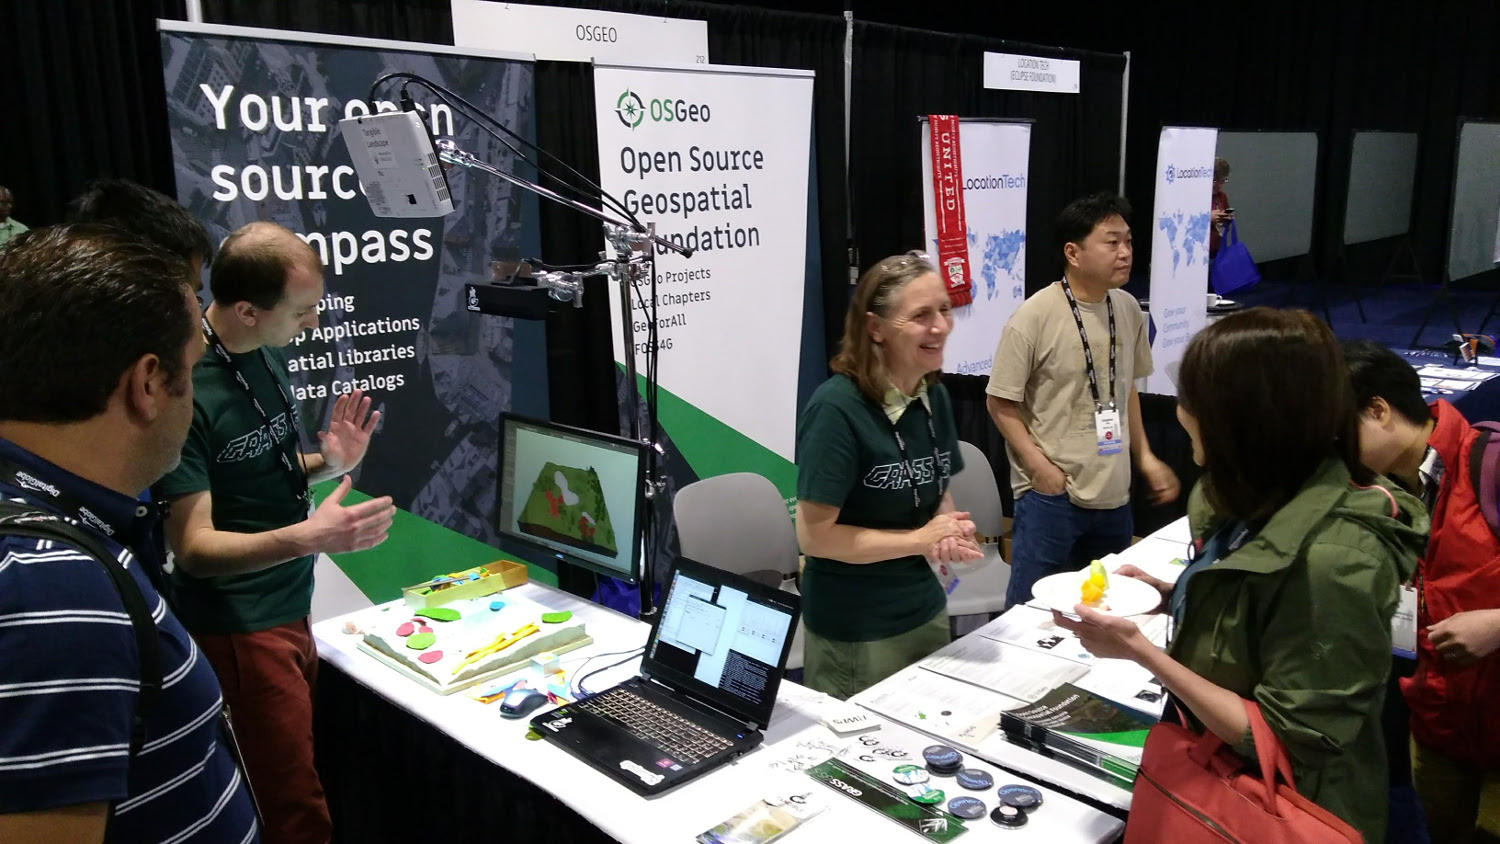
- From GRASS GIS community Helena Mitasova, Vaclav Petras, Anna Petrasova and Payam Tabrizian volunteered at the booth
- Tangible Landscape demo
- GRASS GIS flyers and stickers
Code Sprint
General information and sign up is here:
Participants:
- Anna Petrasova
- ported r.sim.water.mp from addons to r.sim.water and r.sim.sediment (r71417)
- Vaclav Petras
- new OSGeo website content
- trac #3403, r71414, r71415, r71416
- r3.null tests and bug fixing (trac #2992, r71418, r71420, r71421)
- Helena Mitasova: new OSGeo website content
- Steve Krueger (v.centroids example)
- Thomas DeVera (Quickstart on wiki)
- Jachym Cepicky
